


Abstract
The past Asian precipitation δ18O (δ18Op) records from stalagmites and other deposits have shown significant orbital-scale variations, but their climatic implications and regional differences are still not fully understood. This study, as the first attempt of a 300-kyr transient stable isotope-enabled simulation, investigated the characteristics and mechanisms of the orbital-scale δ18Op variations in three representative regions of Asia: arid Central Asia (CA), monsoonal South Asia (SA) and monsoonal East Asia (EA). The modelling results showed that the variations in the CA, SA and EA annual δ18Op exhibited significant but asynchronous 23-kyr precession cycles. Further analyses revealed that although the precession-induced insolation variation was the ultimate cause of the δ18Op variation in all three regions, the dominant mechanisms and the involved physical processes were distinct among them. For the CA region, the rainy-season (November–March) temperature effect and water vapour transport by the westerly circulation were identified as the key precession-scale processes linking the October–February boreal mid-latitude insolation to the rainy-season or annual δ18Op. In the SA region, the rainy-season (June–September) precipitation amount effect and upstream depletion of the monsoonal water vapour δ18O served as the main mechanisms linking the rainy-season or annual δ18Op to the April–July insolation variation at the precession scale. For the EA region, however, the precession-scale annual δ18Op was mainly controlled by the late-monsoon (August–September) and pre-monsoon (April–May) water vapour transport patterns, which were driven by the July–August insolation and the global ice volume, respectively. These results suggest that the climatic implications of the orbital-scale Asia δ18Op variations are sensitive to their geographic locations as determined by the combined effects of insolation and regional circulation patterns associated with the respective rainy seasons. This study provides new insights into understanding the regional differences and formation mechanisms of the Asian orbital-scale δ18Op variations.
INTRODUCTION
As a natural tracer, the precipitation oxygen stable isotope O18 presented as the ratio δ18O (=O18/O16) has long been regarded as a significant indicator of water-cycle and paleoclimate change [1,2]. Precipitation δ18O (abbreviated as δ18Op below) is often affected by local meteorological factors, such as precipitation and/or temperature, usually having a negative (positive) correlation with the local precipitation (temperature), which is named as the precipitation amount (temperature) effect [1,3]. Generally speaking, in evaporation, the lighter water molecules (those with O16) have a greater tendency to break the molecular bond at the surface and become water vapour [1,4], leading to the enrichment of the heavier water left behind in the water body. Inversely, in condensation, the heavier water vapour molecules (H2O18) have a greater tendency to change to liquid water, so that the O18 content in the water vapour is depleted [1]. In the meantime, the isotope fractionation processes are temperature-dependent. With colder temperatures, the depletion of the heavier water vapour molecules is enhanced [1]. The factors controlling local δ18Op also include various large-scale atmospheric processes affecting water vapour oxygen isotope fractionation, such as the changes in the locations of moisture sources or transport pathways, as well as convection, condensation and evaporation in the water vapour source regions and transportation processes [2]. The isotopic records of various sedimentary deposits are often used to reflect past climate changes, in which the cave stalagmite δ18O (abbreviated as δ18Oc below) can inherit the δ18Op and thus is closely related to the precipitation or water vapour characteristics, in combination with the advantages of high-resolution and accurate dating [5]. Therefore, δ18Oc records have been widely used in the field of Asian paleoclimate studies (e.g. [6–8]).
A large number of previous studies on δ18Oc records of the late Quaternary show that the orbital-scale signals in different locations in the Asian monsoon and arid regions have certain common characteristics [9]. For example, in East Asia (EA) [7,8], South Asia (SA) [10] and Central Asia (CA) [11,12], the δ18Oc variations are dominated by the quasi-23-kyr (kiloyears, the same below) precession cycle at the orbital scale, suggesting that the precession forcing might have a common controlling effect on the Asian δ18Oc records, which may reflect the overall intensity of the Asian summer monsoon [13]. However, because the precipitation changes in different regions of Asia are asynchronous, the δ18Oc records may not directly represent the local precipitation variation, but reflect the changes in atmospheric circulation patterns or water vapour sources [14,15]. Additionally, the EA δ18Oc records tended to vary asynchronously with the Arabian Sea sedimentary records associated with the Indian monsoon, although the latter also has a strong precession signature [16]. On the other hand, the most significant cyclic pattern recorded by the Chinese loess is the 100-kyr signal (the glacial–interglacial cycle) in the late Pleistocene [17], indicating an important impact of the global ice volume (GIV) on the EA monsoon. Therefore, the climatic implications and impact mechanisms of the Asian δ18Oc are not entirely clear at this point [18–20].
In recent years, with the development of climate models with the embedded water isotope cycle processes [2,21], several simulation studies have been completed to explore the mechanisms of Asian δ18Op variations and the climatic implications of the relevant δ18Oc. Some modelling studies (e.g. [22,23]) show that the change of δ18Op in EA depends on the upstream rainout (depletion) process or the upstream effect, which is used to explain the Chinese δ18Oc records being controlled by precipitation in the upstream Indian Subcontinent. In the meantime, other modelling studies [24,25] show that the variations of the EA δ18Op or Chinese δ18Oc values are the result of the shifts in water vapour sources or atmospheric circulation pathways. Additional simulations suggest that the Asian δ18Oc records reflect the annual variations of large-scale hydrological processes and circulation regimes [26] or are related to the seasonality of the monsoon precipitation [27]. Although these studies have deepened the knowledge of how δ18Op varies in space and time, so far, the controlling factors and regional differences of the δ18Op variations at the orbital scales in different regions of Asia are still not fully understood.
With rapid development of high-performance computing technology and application of the acceleration technique of Earth orbital forcing [28], transient simulations through long-term continuous integrations have been increasingly employed in studies on orbital-scale monsoon variations (e.g. [26,29–31]). Xie et al. [31] analysed the effects of the orbital-scale insolation forcing and the Northern Hemisphere (NH) high-latitude ice sheets on the EA winter monsoon (EAWM) by using an atmosphere–ocean coupled model in a long-term transient simulation based on the time-varying boundary conditions. Their results show that in the southern EAWM region, its climate variation at the orbital scale is dominated by the 23-kyr cycles in response to the variations of the precession-induced boreal winter insolation, while in the northern EAWM region, the 100-kyr cycle is the dominant pattern due to the strong modulation of the NH ice sheet forcing. Up to now, few existing transient simulations involve the water stable isotope processes or only focus on relatively short time spans, if any (e.g. [32]). In this study, a transient simulation for the past 300 kyr was performed using the same coupled model as in Xie et al. [31], in which the water isotope cycle processes are embedded. Our focus on the past 300 kyr is mainly based on three considerations: first, we hope to simulate a sufficiently long time span to capture the characteristics of orbital-scale periodic changes—that is, at least including multiple 100-kyr periods; second, it is necessary to control the integration time in order to save available computational resources; third, there are relatively rich geological records in the simulated geological period to facilitate the reconstruction of boundary conditions and validation of the simulation results. The main goal of the study is to investigate the controlling factors and regional differences of the orbital-scale δ18Op variations in three different regions in Asia.
TRANSIENT SIMULATIONS
The National Center for Atmospheric Research Community Climate System Model version 3 (CCSM3; [33]) was used to conduct the long-term transient simulation in this study for the past 300 kyr [31]. In the transient simulation, various external forcing conditions, such as Earth's orbital forcing, greenhouse gases (GHGs) and global ice sheets, kept varying with time (Supplementary Note 1, abbreviated as Note S1, and so on). Based on this transient simulation, we further conducted another climate simulation for the past 300 kyr using the isotope-enabled CAM3, which is the same as the atmospheric model of CCSM3 but contains the water isotope cycle. The model can describe the processes of isotopic fractionation closely related to surface evaporation and cloud physics [34]. This model has been successfully applied to modelling studies of precipitation isotope changes in the contemporary climate [35] and paleoclimate [22,23]. We used the isotope-enabled CAM3 to simulate the continuous climate change in the past 300 kyr with 100-time orbital acceleration as in Xie et al. [31] with the same forcing factors varying with time. However, the time-varying global sea surface temperatures were prescribed according to the output of the transient simulation using CCSM3. In this way, we obtained the changes in the δ18Op and atmospheric water vapour δ18O (abbreviated as δ18Ov below) during the past 300 kyr. In addition, the seawater δ18O values at the sea surface, which are referred to as the standard mean ocean water at present [36], were obtained at each time step by linearly interpolating from 1.6‰ for 22 ka [37] to 0.5‰ for 0 ka [38], accounting for their changes due to the fluctuation in the sea level during the deglaciation.
Since this study mainly focuses on the orbital-scale changes of climate and δ18Op, in the following result analyses, a Gaussian low-pass filter [39] of 5.1 kyr is applied to all simulated climate and δ18Op variables in the past 300 kyr to remove the sub-orbital-scale high-frequency climate signals. Regional average climate series of the past 300 kyr (3001 time points at the 100-year resolution) were obtained in three regions in Asia: Central Asian arid region (55–70ºE, 38–50ºN; abbreviated as CA), South Asian monsoon region (70–85ºE, 10–25ºN; as SA) and East Asian monsoon region (105–120ºE, 25–35ºN; as EA) (Fig. 1). When calculating the annual or rainy-season δ18Op (δ18Ov) series from the relevant monthly δ18Op (δ18Ov) values, the monthly precipitation weighted averages were used (e.g. [40]). In the analyses of the simulation results, we used various time-series analysis and multivariate statistical methods to specify the relationships between the δ18Op (δ18Ov) and the forcing factors (see Note S1).
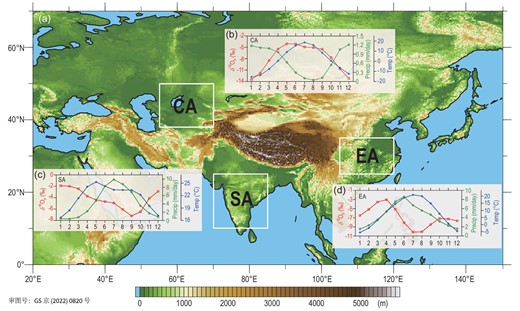
(a) Topography of Asia and the locations of the three study regions: the Central Asian arid region (CA), South Asian monsoon region (SA) and East Asian monsoon region (EA). Diagrams (b), (c) and (d), respectively, show the simulated annual cycles of precipitation (Precip), surface air temperature (Temp) and precipitation oxygen stable isotope ratio (δ18Op) in the CA, SA and EA regions averaged for the past 300 kyr.
ANALYSIS OF SIMULATION RESULTS
We first examined the climatological annual cycles of the simulated climate and δ18Op variables, and found that they differ significantly in the arid and monsoon regions in Asia. The temperature seasonality in the CA region, averaged for the past 300 kyr (Fig. 1b), shows a single-peak type of annual cycle with a warm summer and cold winter. As an arid climate, its sparse precipitation mainly occurs in winter and spring. However, the annual cycle of the CA δ18Op is different from the seasonality of temperature or precipitation, reaching the highest and lowest levels in May and January, respectively. In the SA region, as a typical tropical monsoon climate, its temperature (Fig. 1c) reaches the highest point in May before the onset of the summer monsoon and precipitation is mainly concentrated in summer, while the δ18Op values reach the lowest level in September near the end of the summer monsoon. In the EA region, as a subtropical monsoon region, while temperature and precipitation (Fig. 1d) both have approximately synchronous seasonal patterns, the annual cycle of EA δ18Op is bimodal with the maxima (minima) in April (August) and October (December), which is significantly different from the annual cycle of the SA δ18Op [18]. These distinct characteristics of the annual cycles are generally similar to their modern observations [41–43] in the three regions (Note S2). As a preliminary validation of the modelling results, we also compared the simulated δ18Op values for the EA region with Chinese stalagmite records [8]. It shows that their variations are highly in phase with a strong correlation during the past 300 kyr (Note S3).
The rainy seasons occur at different times of the year in these three regions (Fig. 1b–d), specified as November–March in CA, June–September in SA and May–September in EA, respectively (Note S4). By comparing the covariation patterns of the annual δ18Op in the past 300 kyr with that of the corresponding rainy seasons of the three regions, it can be concluded that the annual δ18Op series in the CA and SA regions have very similar variation patterns to those of the rainy seasons (Fig. 2a and b), with correlation coefficients of 0.934 for the CA and 0.950 for the SA regions, respectively. However, the correlation between the annual and the rainy-season δ18Op series is significantly lower in the EA region (r = 0.722) (Fig. 2c). This implies that the changes in the CA and SA annual δ18Op series are mostly controlled by the changes of the rainy-season δ18Op, while the EA annual δ18Op does not seem to depend as much on the rainy-season δ18Op. A closer inspection revealed that while the rainy-season δ18Op series are more negative than the corresponding annual δ18Op series in all three regions, the SA rainy-season δ18Op series has peak values very close to the annual values, while the trough values of the rainy-season δ18Op are more negative (Fig. 2b). On the other hand, the EA rainy-season series seems to contain more signals of different frequencies than the annual series (Fig. 2c) when compared with the other two regions. These observations imply that the contributions of the rainy-season δ18Op to the annual δ18Op variations are distinct in different regions.
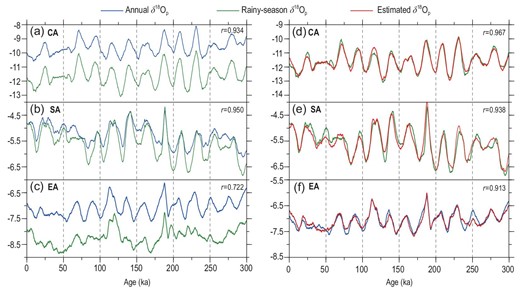
(a) Variations of the annual and rainy-seasonal precipitation δ18Op with time in the CA region during the past 300 kyr; (b) same as (a) but for SA; (c) same as (a) but for EA; (d) comparison of the CA rainy-season δ18Op with the estimated δ18Op using the CA 700-hPa temperature and the whole-troposphere (300-hPa–surface) δ18Ov as the independent variables; (e) same as (d) but for the SA rainy-season δ18Op with the estimated δ18Op using the SA precipitation and the water vapour source-region δ18Ovs; (f) same as (d) but for the EA annual δ18Op with the estimated δ18Op using the EA August–September δ18Op and April–May δ18Op. The r values are the correlation coefficients between the two series in each panel.
Power spectrum analysis of the annual and rainy-season temperature, precipitation and δ18Op time series from these three study regions can reveal their orbital-scale variation characteristics in the frequency domain (Fig. 3). It can be seen that the CA (Fig. 3a), SA (Fig. 3b) and EA (Fig. 3c) series all show dominant 23-kyr precession cycles, although weak 100-kyr signals exist in the SA and CA series, which is supported by the Asian stalagmite records [8,44]. Moreover, there are significant 23-kyr cycles in the CA and SA rainy-season δ18Op series (Fig. 3j and k) but the EA rainy-season δ18Op shows a certain 100-kyr cycle without signals of the 23-kyr cycle (Fig. 3l). Spectral analyses of major climate forcing factors in the late Quaternary (Note S5) show that the GIV and GHG variations are dominated by the 100-kyr cycle, while the annual average insolation by the 41-kyr cycle, and thus they are unlikely to drive the 23-kyr cyclical variation of the CA annual δ18Op. In the CA and SA regions, there are common precession cycles in the rainy-season (Fig. 3j and k) and annual (Fig. 3a and b) δ18Op variations, since the rainy-season series dominate the annual variation (Fig. 2a and b). The rainy-season δ18Op variations are ultimately controlled by the precession-induced insolation forcing with prominent 23-kyr cycles (Note S5). However, the analyses in the time domain (Fig. 2c) and frequency domain (Fig. 3c and l) suggest that the EA annual δ18Op variation cannot be fully attributed to the rainy-season δ18Op variation, as indicated by the mismatch between the 23-kyr cycle in the annual δ18Op (Fig. 3c) and the 100-kyr cycle in the rainy-season δ18Op (Fig. 3l), which may instead be related to the changes in the GIV or GHGs.
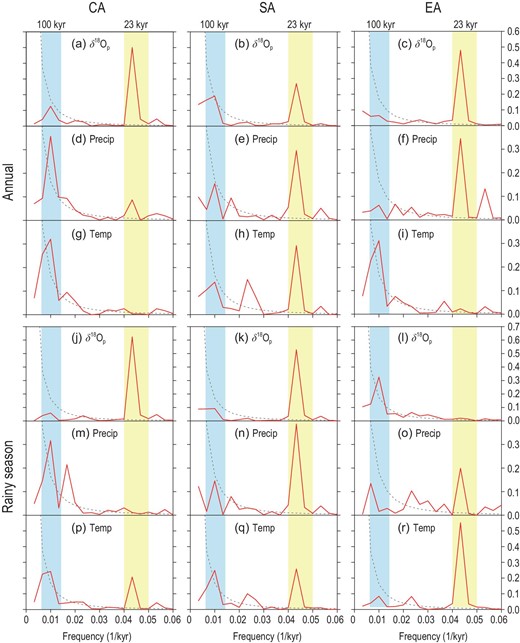
Power spectrum (red lines) analysis results of the standardized annual (a–i) and rainy-season (j–r) δ18Op, precipitation (Precip) and surface air temperature (Temp) series in the CA (left column), SA (central column) and EA (right column) regions in the past 300 kyr. The black dashed lines indicate the red noise spectrum with 90% confidence level, and the blue and yellow columns indicate the 100-kyr glacial–interglacial cycle band and the 23-kyr precession cycle band, respectively.
The above analysis shows that the variations in the annual δ18Op in the CA, SA and EA regions all indicate significant precession signals at the orbital scale. Although the external forcings of the transient simulation include the GIV and GHG variations dominated by the 100-kyr cycle, the Asian δ18Op variations are dominated by the precession cycle. Similar results were also obtained from a previous transient simulation for the NH monsoons using a medium-complexity model [45]. It suggests that the precession forcing plays a leading role in driving the Asian δ18Op variations, but the climate-controlling factors and physical mechanisms of the δ18Op variations in different regions may be distinct. In the following, we focus on the processes that determine the δ18Op variation patterns in each region, in order to clarify the respective variation characteristics and specific controlling factors of the orbital-scale δ18Op variation in these typical monsoon and arid regions in Asia since the late Quaternary.
CA region
Correlation analysis is helpful to infer the relationships between δ18Op and precipitation and/or temperature, due to the aforementioned precipitation amount effect and temperature effect [1,40]. In the CA region, there is a significant positive correlation between the δ18Op series in the past 300 kyr and annual average temperature (r = 0.532), while the positive correlation with precipitation (r = 0.294) is contrary to the precipitation amount effect (Table 1). This seems to suggest that the CA annual δ18Op variation reflects the temperature effect rather than the precipitation amount effect. However, from the results of the power spectrum analyses, we can see that although the CA annual δ18Op series is dominated by the precession cycle (Fig. 3a), annual average temperature does not show the precession cycle (Fig. 3g). Therefore, annual average temperature should not be the direct cause for the variation of the annual δ18Op. Meanwhile, the correlation between the rainy-season δ18Op and temperature is stronger (r = 0.685, Table 1) and both δ18Op (Fig. 3j) and temperature (Fig. 3p) in the rainy season have significant precession cycles. Therefore, it can be inferred that, similarly to certain continental regions in the NH mid-high latitudes [3,46], there is a strong temperature effect on the variation of δ18Op in the rainy season in this region. Since the CA rainy-season δ18Op variation dominates the annual δ18Op variation, the CA annual δ18Op variation also shows a strong signal of the precession cycle. The existing geological evidence shows that the CA water δ18O is controlled or affected by temperature [11,47]. The precipitation amount effect on the CA δ18Op seems to be weak (if any), although when the temperature's effect is removed, the partial correlations of both annual (r = –0.207) and rainy-season δ18Op (r = –0.234) with precipitation are negative (Table 1).
Simple and partial correlation coefficients between annual or rainy-seasonal precipitation oxygen stable isotope ratio (δ18Op), surface air temperature (T) and precipitation (P) in the Central Asia (CA), South Asia (SA) and East Asia (EA) regions during the past 300 kyr. The rainy seasons in CA, SA and EA are defined as November–March, June–September and May–September, respectively. In partial correlation analysis, T and P are used as the control variable alternatively.
| Simple correlation | Partial correlation | |||||
|---|---|---|---|---|---|---|
| δ18Op ∼ T | δ18Op ∼ P | T ∼ P | δ18Op ∼ T (P as control) | δ18Op ∼ P (T as control) | ||
| Annual | CA | 0.532 | 0.294 | 0.791 | 0.512 | –0.207 |
| SA | 0.048 | –0.661 | –0.320 | –0.230 | –0.682 | |
| EA | 0.372 | 0.388 | 0.503 | 0.222 | 0.251 | |
| Rainy season | CA | 0.685 | 0.251 | 0.570 | 0.682 | –0.234 |
| SA | –0.503 | –0.797 | 0.070 | –0.742 | –0.884 | |
| EA | 0.035 | 0.037 | –0.003 | 0.035 | 0.037 | |
Considering that the CA region is located in the interior of the largest land mass on Earth, the variation of δ18Op is not only affected by the surface temperature but also controlled by the upper air temperature [48,49] as the water vapour here has gone through multiple cycles of evaporation and condensation. According to the results of principal component analysis (PCA) of the CA January–December temperature series at various isobaric levels below 300 hPa and the surface (Note S6), there is a consistent variation pattern of the temperature in the winter months (October–February), with an antiphase temperature variation pattern in the summer months, which result from the temperature responses to the precession-induced winter–summer opposite insolation variations as shown in an earlier study [30]. From the correlations between the CA rainy-season δ18Op, tropospheric temperature and δ18Ov (Note S7), the δ18Op series has strong positive correlations with the tropospheric temperatures and the highest correlation is with the 700-hPa temperature (r = 0.770), which is higher than the correlation with the surface temperature (r = 0.685, Table 1). We also find a high positive correlation (r = 0.823) between the CA rainy-season δ18Op and the δ18Ov of the whole troposphere (300-hPa–surface, same below), which is independent of the tropospheric temperature (Note S7). Based on these results, we used the 700-hPa temperature and whole-troposphere δ18Ov as the independent variables to estimate the values of the CA rainy-season δ18Op in regression analysis. The estimated and simulated rainy-season δ18Op series match each other extremely well, with a correlation coefficient of 0.967 (Fig. 2d). In other words, the 700-hPa temperature and the whole-troposphere δ18Ov can explain 93.5% of the variance in the CA rainy-season δ18Op.
Since the effects of orbital forcing are ultimately reflected in the variations of insolation at different latitudes of Earth [50], at the orbital scale, both the upper air temperature and δ18Ov should be related to the insolation variation. By calculating the correlations between January–December monthly temperature series at 700 hPa in the CA region and the insolation at approximately the same latitudes (45ºN), it is found that the correlation coefficients between the monthly average temperature and the leading 1- to 2-month insolation are usually the highest (Note S8). Thus, the CA rainy-season 700-hPa temperature and the whole-troposphere δ18Ov related to the δ18Op are both strongly associated with the average October–February mid-latitude insolation, with correlation coefficients of 0.619 and 0.877, respectively (Note S8).
In order to further understand how the temperature and δ18Ov are modulated by the insolation and what specific physical processes are affecting the δ18Op, we examined the spatial patterns of whole-troposphere water vapour flux and transport in relation to the 45ºN insolation (Fig. 4). In terms of the climatological average conditions, water vapour in the CA region mainly comes from the transport by the westerly circulation during the rainy season (Fig. 4a). Previous studies have shown that the westerly circulation is the main mechanism transporting water vapour into CA in the late Quaternary [30] or even during the entire Cenozoic [51]. In the Eurasian continent, the CA rainy-season δ18Ov is generally high in the south and low in the north (Fig. 4b), which reflects the temperature effect to a certain extent [11,47]. However, in the mid-latitude westerly-circulation controlled areas, from the northern Mediterranean, through the Black Sea and Caspian Sea, to the downstream CA near the Aral Sea, the δ18Ov values are gradually becoming more negative (Fig. 4b), which may reflect the upstream depletion effect influencing the water vapour isotope content. Regression analysis shows that when the insolation in the cold season increases with the precession cycle, the westerly circulation enhances and transports more water vapour with more positive δ18Ov upstream to the downstream areas (Fig. 4c), resulting in more positive (or less negative) δ18Ov in the CA region. On the other hand, the insolation enhancement also causes the CA δ18Ov to shift toward more positive (or less negative) through the temperature effect on fractionation. The combined action of these two results in a highly positive correlation between the CA δ18Ov and the insolation (Fig. 4d and Note S8). It is thus clear that the precession-induced mid-latitude insolation variation ultimately controls the CA δ18Op at the orbital scale by modulating the tropospheric temperature and δ18Ov during the rainy season.
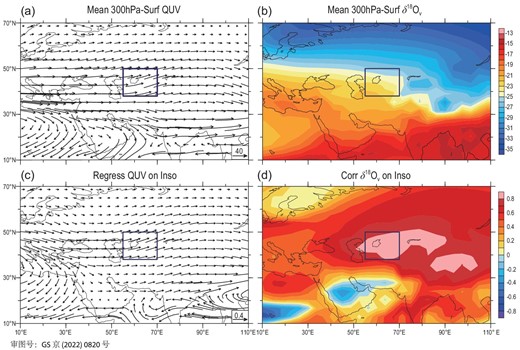
Distribution patterns of the whole-troposphere (a) water vapour flux over Eurasia (units: kg/m/s), (b) water vapour δ18Ov averaged for the CA rainy season (November–March) in the past 300 kyr, as well as (c) the regression field of the water vapour flux (units: kg/m/s) against the October–February 45ºN insolation and (d) correlation field of the rainy-season δ18Ov with the insolation. The dark-blue boxes indicate the CA region.
SA region
Although there are prominent precession signals in both annual precipitation (Fig. 3e) and annual mean temperature (Fig. 3h), there is no correlation between the annual δ18Op and annual mean temperature (r = 0.048, Table 1), while a significant negative correlation exists between the annual δ18Op and annual precipitation (r = –0.661). Therefore, it is preliminarily inferred that the variation of the SA annual δ18Op mainly reflects the precipitation amount effect. Since the SA precipitation is concentrated during the rainy season, further analysis of the relationship between the rainy-season δ18Op and precipitation shows a strong negative correlation (r = –0.797). However, there is also a moderate negative correlation between δ18Op and rainy-season temperature (r = –0.503), which is contrary to the temperature effect. Although the SA rainy-season δ18Op (Fig. 3k), temperature (Fig. 3q) and precipitation (Fig. 3n) all show significant precession cycles, the peak value of the standardized power spectrum of temperature in the precession band (∼23 kyr) is significantly lower than that of precipitation. When the influence of temperature is excluded using partial correlation analysis (Table 1), the negative relationship between the rainy-season δ18Op and precipitation becomes even stronger (partial r = –0.884). The PCA of the SA January–December δ18Op series also shows a consistent variation pattern of monthly δ18Op during June–September, identified as the SA rainy or monsoon season (Note S9). Therefore, it can be concluded that the SA annual δ18Op may mainly depend on the precipitation amount effect during the rainy season, which is also supported by existing research results [52–54].
For the past 300 kyr, the Indian Subcontinent has been one of the regions with the highest precipitation amount in the world during June–September, the rainy season of the SA region (Fig. 5a). Its water vapour mainly originates from the southern Indian Ocean (Fig. 5a). Correlation analysis between the SA rainy-season δ18Op series and the simultaneous precipitation field (Fig. 5b) revealed that the SA δ18Op series has strong negative correlations not only with the local precipitation, but also with the precipitation in the central tropical Indian Ocean extending to the Southern Hemisphere (SH). The increase in precipitation in the SA region is accompanied by the enhancement of water vapour transport from the southwest (Fig. 5b). This means that the variation of the SA δ18Op is not only controlled by the local precipitation effect, but also closely related to the precipitation in the southern tropical Indian Ocean, or the upstream depletion effect. For simplicity, a region of the central tropical Indian Ocean (65º–80ºE, 10ºS–5ºN) is selected as the upstream water vapour source region of SA precipitation (Fig. 5a and b). Moreover, the source region is very stable, as judged from similar correlation patterns of the δ18Ov field with the SA δ18Op series in the glacial and interglacial periods during the past 300 kyr (Note S10).
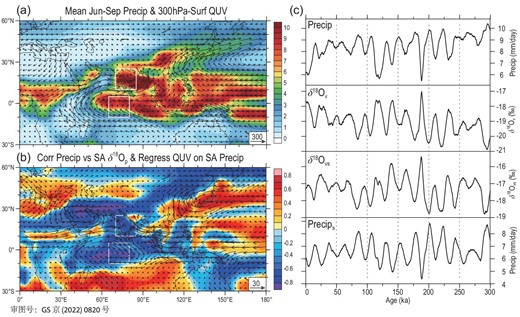
(a) Precipitation (shaded, units: mm/d) and whole-troposphere water vapour flux (arrows, units: kg/m/s) fields averaged for the SA rainy season (June–September); (b) correlation field of the rainy-season precipitation with the SA δ18Op series (shaded) and the regression field of the water vapour flux (arrows, units: kg/m/s) against the SA rainy-season precipitation series; (c) comparisons between the SA rainy-season (June–September) precipitation (Precip), whole-troposphere δ18Ov and the source-region δ18Ov(δ18Ovs) and precipitation (Precips) series. In (a) and (b), the white boxes in the NH indicate the SA region, and those in the SH represent the water vapour source region for SA precipitation in this study.
By comparing the SA rainy-season δ18Op series with the local precipitation and water vapour δ18Ov, as well as the source-region whole-troposphere δ18Ov and precipitation series (Fig. 5c), it can be seen that they all have marked precession cycles with almost synchronous changes. Taking the SA local precipitation and the source-region δ18Ov in the rainy season as two relatively independent influencing factors, we estimated the SA δ18Op series using multiple regression. The correlation coefficient between the estimated and the original simulated δ18Op series reaches 0.938 (Fig. 2e). Considering that the correlation between the SA rainy-season precipitation and δ18Op is –0.797 (Table 1), explaining 63% of the variation in the SA δ18Op, the source-region δ18Ov can explain 73% of the variation, while the combination of the two can account for 88% of the variance of the SA δ18Op.
Results of correlation analysis indicate that the SA precipitation series of each month in the rainy season is usually most closely related to the 30ºN insolation leading by 2 months, thus the SA precipitation in the rainy season (June–September) has the strongest positive correlation with the April–July insolation, while the SA δ18Op or the source-region δ18Ov has the strongest negative correlation (Note S11). Similarly, the correlation fields also show that the April–July average 30ºN insolation has strong positive correlations with the June–September precipitation over the vast tropical areas including the SA and the source region (Fig. 6a), but strong negative correlations are found with the June–September whole-troposphere δ18Ov over most parts of the Asian continent and tropical Indian Ocean (Fig. 6b). This suggests that when the precession forcing causes the insolation to enhance (weaken) for the NH spring and summer, it can result in increases (decreases) in the SA rainy-season precipitation and the depletion (enrichment) of the source-region δ18Ov, eventually leading to the more negative (positive) δ18Op values in the SA region through the local precipitation amount effect and upstream depletion effect.
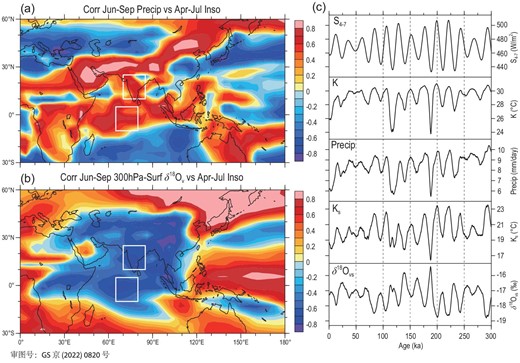
(a) Distribution of correlation coefficients of June–September precipitation in the Asia–Indian Ocean region with the April–July 30ºN insolation series; (b) same as (a) but for the whole-troposphere δ18Ov with the insolation; (c) temporal variation patterns of the April–July 30ºN insolation (S4_7), SA June–September atmospheric stability index (K), SA rainy-season precipitation (Precip), the water vapour source-region K index (Ks) and whole-troposphere δ18Ovs during the past 300 kyr. The white boxes are the same as in Fig. 5.
To explain the insolation-induced atmospheric physical processes affecting the SA precipitation and the source-region δ18Ov, we further analysed the atmospheric water vapour and stability variations related to the orbital forcing. The regression analysis results show that when the April–July 30ºN insolation is strengthened, the water vapour transport into the SA from the southwest is enhanced, resulting in increases in the SA rainy-season water vapour content (and precipitation) (Note S12). Meanwhile, the enhanced insolation may affect atmospheric stability and convective activity. The atmospheric instability and convective intensity can be measured using the K index [55], i.e. K = (T850 – T500) + D850 – (T700 – D700). The first term (T850 – T500) is the air temperature lapse rate between 850 and 500 hPa, and the second term D850 and the third term (T700 – D700) are respectively the dew point temperature at 850 hPa and the 700-hPa dew point depression, reflecting the lower tropospheric humidity. The higher the K index, the stronger the instability and convective activity of the atmosphere. In relation to our simulation results for the past 300 kyr, the enhancement of April–July 30ºN insolation caused by the precession cycle leads to the rise in the K index over the SA region during the rainy season, which is also conducive to the synchronous increase of SA monsoon precipitation (Fig. 6c). At the same time, the enhanced insolation also causes the rise of the K index over the tropical Indian Ocean, resulting in the enhancement of convective precipitation and then the corresponding depletion of the source-region δ18Ov level (Fig. 6c). As a result, the enhanced insolation at the orbital scale in the NH spring and summer increases the local precipitation and lowers the upstream δ18Ov by promoting convective activities in both local and water vapour source areas and enhancing the water vapour transport to the SA region, leading to the further depletion of the SA rainy-season δ18Op. When the precession-induced insolation weakens, the opposite would occur.
EA region
Unlike the CA and SA regions, the EA annual δ18Op is not controlled by the rainy-season temperature or precipitation. From the results of power spectrum analysis, there are significant precession signals in the EA annual δ18Op series (Fig. 3c) and annual precipitation (Fig. 3f). However, there is no precession signal in the EA annual mean temperature (Fig. 3i) or rainy-season δ18Op (Fig. 3l). Although the annual δ18Op is positively correlated with the annual average temperature (r = 0.372, Table 1) and precipitation (r = 0.388), the rainy-season δ18Op is almost irrelevant to the variation of rainy-season temperature (r = 0.035) or precipitation (r = 0.037). It can be seen that the EA annual δ18Op variation at the orbital scale cannot be simply attributed to the variation of temperature or precipitation during the rainy season. Partial correlation analysis does not significantly change the original relationships between the rainy-season δ18Op and temperature or precipitation (Table 1).
Based on the PCA results and correlation analysis of the January–December EA δ18Op series, August–September and April–May δ18Op have been identified as the highest loading contributors to the variation in the EA annual δ18Op (Note S13). In fact, if the two series of August–September and April–May δ18Op are used to estimate the annual δ18Op in the EA region using regression analysis (Fig. 2f), the estimated series is found to be highly consistent with the simulated annual δ18Op (r = 0.913)—that is, the August–September and April–May δ18Op can explain 83.4% of the EA annual δ18Op variation. Actually, only August–September δ18Op alone would be able to explain 61.9% of the annual δ18Op variation. Therefore, the late rainy season is the key period to determine the variation in the EA annual δ18Op.
The EA August–September and April–May δ18Op series are closely related to the concurrent local mid-lower-troposphere water vapour δ18Ov as shown in the corresponding correlation analysis (Note S14). The variation in the δ18Ov over EA mainly depends on the water vapour transport [22] related to the Asian summer monsoon, but the relevant large-scale circulation pattern varies greatly in different stages of the monsoon season [56,57]. For the convenience of discussion in the following, we take three sub-seasonal stages, namely April–May, June–July and August–September, to represent the pre-, early- and late-monsoon stages of the EA region, respectively. Based on the long-term average conditions, the water vapour flux entering the EA region is dominated by the southerly air flow, but mainly affected alternately by the winds from the South China Sea, Arabian Sea–Indian Ocean and western Pacific during the pre-, early- to late-monsoon seasons (Fig. 7a–c).
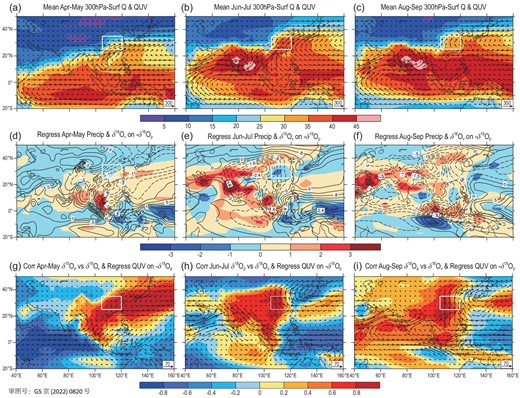
Fields of the whole-troposphere water vapour content (shaded, units: kg/m2) and water vapour flux (arrows, units: kg/m/s) averaged for (a) April–May, (b) June–July and (c) August–September; regression fields of the whole-troposphere water vapour δ18Ov (contour) and precipitation (shaded, units: mm/d) with the –δ18Op series of EA for (d) April–May, (e) June–July and (f) August–September, respectively; correlation fields of the δ18Ov with the EA δ18Op (shaded) and regression fields of the whole-troposphere vapour flux (arrows, units: kg/m/s) against the –δ18Op series of EA for (g) April–May, (h) June–July and (i) August–September. The white boxes indicate the EA region.
According to the regression and correlation analyses, for the pre-monsoon season, the depletion of the EA δ18Op corresponds to the more negative δ18Ov values in the vast areas of south-eastern China, Indochina Peninsula, South China Sea and western Pacific (Fig. 7d, represented by the dashed contours). In other words, the EA δ18Op is highly positively correlated with the δ18Ov in these areas (Fig. 7g). However, the depletion of the EA δ18Op due to the enhanced northward water vapour transport (Fig. 7g) has little to do with the precipitation variation in most of the Asian monsoon region (Fig. 7d), because the rainy season has not yet begun. As a comparison, there are significant positive correlations between the EA δ18Op and the δ18Ov in most parts of the Asian continent in the early-monsoon season (Fig. 7h), corresponding to the more depleted δ18Ov values in this general region with the depletion of EA δ18Op (Fig. 7e). In the estimated water vapour flux field, the variation of the EA δ18Op does not seem to be directly related to the anomalous water vapour transport from the upstream Arabian Sea to SA, but more so to the water vapour transport from the western Pacific/East China Sea (Fig. 7h). Therefore, although the EA water vapour in the early-monsoon season climatologically mainly comes from the south-westerly flow over the Indian Ocean (Fig. 7b), the June–July south-westerly water vapour transport makes little contribution to the orbital-scale variation of the EA annual δ18Op.
It is worth noting that in the late-monsoon season (Fig. 7f), the depletion of the EA δ18Op corresponds to the decreases of δ18Ov in most parts of the Asian continent and the upstream tropical Indian Ocean, as well as the increases of precipitation near the Arabian Peninsula, Indian Subcontinent and Sumatra Island. Accordingly, the EA δ18Op series has highly positive correlations with the variation of δ18Ov from the upstream South China to the Arabian Sea (Fig. 7i), and is also related to the water vapour transport from the northern Arabian Sea to SA and then into EA (Fig. 7i). In fact, the stronger the water vapour transport from the upstream to the EA region, the more negative the EA δ18Op tends to be due to the upstream depletion effect (Fig. 7i). It is thus clear that although the water vapour over the EA region climatologically mainly comes from the South China Sea and the western Pacific during the late-monsoon season (Fig. 7c), the orbital-scale variation of EA δ18Op actually depends on the water vapour transport from the Arabian Sea to SA. Several previous simulation [22,23] and observation [43,58] studies have pointed out that the variation of δ18Op in EA is largely controlled by the upstream convective activity or rainout process. However, here we want to suggest that such a mechanism plays a role mainly in the late-monsoon season.
In terms of the forcing mechanisms, we find that the August–September EA δ18Op and water vapour content have strong positive correlations with the July–August insolation, while the April–May δ18Op and water vapour content are strongly correlated with the variations of GIV and GHGs (Note S15). The time series of the EA August–September δ18Op plotted against the July–August 30°N insolation (Fig. 8a) and the EA April–May δ18Op against the GIV (Fig. 8b) show close associations between the δ18Op and the respective forcings. The regression analysis suggests that, corresponding to increasing insolation and thus stronger warming over the land mass than that over the ocean (Fig. 8c), the 850-hPa geopotential heights rise over the North Pacific and fall over the Asian continent centred on West Asia, resulting in enhanced water vapour transport from the Arabian Sea and SA to EA due to enhanced low- to mid-latitude pressure gradients across 60ºE–110ºE. This anomalous circulation pattern leads to the reduced EA δ18Op through the upstream depletion effect (Fig. 7i). On the other hand, the retreat of the NH ice sheets induces the decline of the geopotential heights in the Arctic region and the rise of geopotential heights in the mid-latitude North Pacific to EA, resulting in the increased water vapour transport from the western Pacific into the EA region (Fig. 8d). This situation favours the EA δ18Op to shift towards a more positive level (Fig. 7g). Therefore, the increase (decrease) of the July–August insolation due to the precession cycle combined with the expansion (retreat) of the NH ice sheets is most conducive for the EA δ18Op content to be depleted (enrichened). Since the EA annual δ18Op mainly depends on the August–September δ18Op variation and the contribution by the April–May δ18Op is relatively small, we can conclude that the variation of the EA annual δ18Op is mostly controlled by the July–August insolation reflecting the effects of the precession cycle, although it is also related to the fluctuation of the GIV (including the GHG concentration) at the precession scale (Note S5).
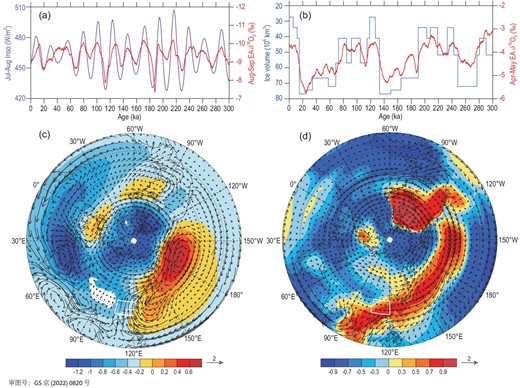
(a) Time series of the EA August–September δ18Op and July–August 30ºN insolation series; (b) the EA April–May δ18Op series and the GIV series used in the model; (c) the regression NH fields of the August–September average 850-hPa geopotential heights (shaded, units: gpm) and the whole-troposphere water vapour flux (arrows, units: kg/m/s) against the July–August 30ºN insolation; (d) the NH distributions of correlations of the April–May whole-troposphere δ18Ov with the negative GIV series (shaded) and the regression field of the water vapour flux (arrows, units: kg/m/s) against the negative GIV series. The white boxes in (c) and (d) indicate the EA region, and the white shaded area in (c) shows the Tibetan Plateau.
Regional comparisons
The above analyses show that the simulated annual δ18Op variations in the CA, SA and EA regions all have the dominant 23-kyr cycle, but are driven by the precession-induced insolation of different months. In terms of the time domain, the CA, SA and EA annual δ18Op show almost completely synchronous changes at the orbital scale with the October–February, April–July and July–August NH insolation, respectively (Fig. 9a–c), although there seems to be the signal of the 100-kyr cycle in the SA region (Fig. 9b). It can be observed more clearly in the frequency domain (Fig. 3b). The cross-spectral analysis reveals the phase relationships of the simulated CA, SA and EA annual δ18Op series relative to the precession parameter (Fig. 9d). For the 23-kyr precession cycle, the annual δ18Op series of the CA and SA regions lead the minimum of precession parameter (corresponding to the NH June insolation maximum at mid-low latitudes) by ∼0.3 and ∼1.3 kyr, respectively; while the EA annual δ18Op series lags the minimum of the precession parameter by ∼3.2 kyr. In other words, the EA annual δ18Op lags the SA (CA) by 4.5 kyr (3.5 kyr), while the CA annual δ18Op lags the SA annual δ18Op by only 1 kyr. This indicates that although the variations of the annual δ18Op series in all three regions are dominated by the precession cycle, their phase relations with the precession band are not entirely the same.
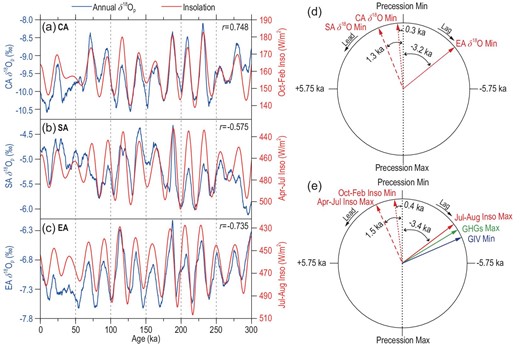
(a) Comparisons of the CA annual δ18Op with October–February average 45ºN insolation series; (b) same as (a) but for the SA δ18Op with April–July 30ºN insolation; (c) same as (a) but for the EA δ18Op with July–August 30ºN insolation; (d) the phase relationships between the precession parameter minimum (Min), the simulated CA, SA and EA annual δ18Op minima in the precession band, and (e) the phase relationships between the precession parameter (Min) and the forcing factors including the October–February 45ºN insolation (Inso) minimum, April–July 30ºN insolation maximum, July–August 30ºN insolation maximum, global ice volume (GIV) minimum and concentrations of greenhouse gases (GHGs) maximum (CO2 equivalent).
Compared with the phases of the various forcing factors at the precession scale (Fig. 9e), we can see the corresponding relationships of the δ18Op in these three regions and different factors. The phase of the temperature-affected CA δ18Op minimum is very close to that of the October–February minimum insolation, the phase of the precipitation-affected SA δ18Op minimum is close to that of the April–July insolation maximum, while the EA δ18Op minimum is close to the July–August insolation maximum as well as the GHGs maximum and GIV minimum. These phase relationships confirm that the variations of CA and SA annual δ18Op are mainly decided by their rainy-season δ18Op and ultimately controlled by the corresponding NH insolation, while the EA δ18Op is mainly controlled by the late-monsoon insolation and it is probably also related to the variations of GIV and GHGs. In the precession cycle, there exist fixed phase differences of the insolation variations of different months [50]. Since the CA, SA and EA annual δ18Op variations in the precession band are determined by the insolations of different months (Fig. 9), there should also be relatively stable phase differences between the variations of the δ18Op in these regions. However, these modelling results remain to be verified with geological records available for different regions in the future.
CONCLUSIONS AND DISCUSSIONS
In this study, the transient climate simulation spanning the past 300 kyr was carried out using a global atmosphere–ocean coupled model and the corresponding isotope-enabled atmospheric model. Based on the analyses of the simulation results, the characteristics and mechanisms of the orbital-scale variations of δ18Op in three representative regions of Asia (the CA, SA and EA region) are investigated and compared. The results show that the orbital-scale variations of the CA, SA and EA δ18Op are all dominated by the 23-kyr precession cycle, although weak 100-kyr signals exist in the CA and SA regions. However, the precession-scale δ18Op variations are not synchronous, with certain phase differences between these regions of Asia. At the precession scale, the EA annual δ18Op lags those of the SA and CA regions, by ∼4.5 and 3.5 kyr, respectively, and the CA annual δ18Op is ∼1 kyr behind that of the SA region. Our results indicate that the annual δ18Op variations at the precession scale in the three regions are driven by the insolation forcing in different months. Therefore, the inherent phase differences of the insolation in different months in the precession cycle create relatively stable phase relationships between the annual δ18Op series of these regions.
Although the δ18Op in the three regions studied have significant precession signals at the orbital scale, the physical mechanisms of their formations are distinct. The CA annual δ18Op variation mainly depends on the rainy-season (November–March) δ18Op. The NH mid-latitude insolation in October–February, 1 month ahead of the rainy season, is the ultimate forcing factor driving the changes of the CA rainy-season and annual δ18Op variation. When the precession-induced October–February insolation strengthens (weakens), the tropospheric temperature over the CA rises (falls), and the water vapour transported to the CA increases (decreases) by the westerly circulation carrying water vapour of more (less) positive δ18Ov upstream, which leads to the enrichment (depletion) of CA δ18Op under the combined action of the temperature effect and upstream circulation effect.
The SA annual δ18Op variation primarily depends on the rainy-season (June–September) δ18Op. The main driving factor is attributed to the April–July insolation in the NH mid-low latitudes, 2 months ahead of the rainy season. When the April–July insolation is enhanced (reduced) by the precession forcing, the convection and precipitation in the SA monsoon region and its upstream water vapour source region in the tropical Indian Ocean are enhanced (depressed), along with the increase (decrease) in water vapour transport to the SA region from the upstream tropical Indian Ocean and Arabian Sea. As a consequence, the SA rainy-season and the resulting annual δ18Op levels tend to be more negative (positive) due to the combined influence of precipitation amount effect and the upstream depletion effect.
Differently from the CA and SA regions, the change of the annual δ18Op of the EA region is not determined by the whole monsoon-season δ18Op (May–September) but that of the late-monsoon season (August–September), although there is also a certain contribution by the pre-monsoon season (April–May) to the annual δ18Op. At the orbital scale, the changes of the August–September and April–May δ18Op are driven by the July–August insolation of the NH mid-low latitudes and the GIV, respectively. The enhanced July–August insolation can promote the August–September water vapour transport from the Arabian Sea and SA to EA, and lead to the reduced EA δ18Op through the upstream depletion effect, while the retreat of the NH ice sheets helps increase the water vapour transport from the western Pacific to EA, resulting in the enriched EA δ18Op in April–May. Therefore, the increase of the July–August insolation combined with the expansion of NH ice sheets is most conducive to depleting the EA δ18Op, while the decrease of insolation in combination with the retreat of the NH ice sheets is conducive to enriching the EA δ18Op.
The orbital-scale changes of the annual δ18Op in the three regions of Asia all reflect the atmospheric and hydrologic responses to the precession forcing, although the specific physical processes involved are remarkably distinct. The current study confirmed some results from previous studies. For example, the CA δ18Op variations indicated by the ice core δ18O records in the eastern Pamir [47] and the stalagmite δ18O record in Uzbekistan [11] are related to the temperature effect. However, the δ18Op variation in SA is related to the precipitation amount effect. A comprehensive analysis based on stalagmite records in different regions of the world and climate model simulation results [53] indicates that there is a significant positive correlation between the δ18Op values in the tropical monsoon regions, including India, and the local precipitation amount. Additionally, previous simulations of the δ18Op during the last interglacial period [52], the last deglaciation period [32] and the Holocene [54] all show that the changes of δ18Op in SA are mainly the result of the precipitation amount effect. Our results further indicate that the CA and SA δ18Op variations are also affected by the upstream depletion effect associated with the changes in atmospheric circulation patterns, in addition to the local temperature or precipitation amount effect, and both are the results of the insolation changes caused by the precession forcing. The detailed physical processes of Asian orbital-scale δ18Op changes (such as the vapour source location and transport pathway, repeated condensation, and re-evaporation) need to be further studied in the future.
A comprehensive understanding of the climatic significance of δ18Op has been a challenge for the EA paleo-environment research for many years. Similar to some previous research results (e.g. [22,23]), our results suggest that the orbital-scale EA δ18Op variation does not depend on local precipitation or temperature, but is the result of the atmospheric circulation change driven by the precession forcing. However, previous studies mostly emphasized the contribution of the whole monsoon rainy season to the annual δ18Op variation, while we found that the upstream depletion process in August–September during the late-monsoon season is the key factor that controls the EA annual δ18Op changes. Our simulation results make it clear that the precession-induced upstream depletion process in August–September dominates the EA annual δ18Op changes at the orbital scale. At the same time, the EA annual δ18Op variation is also related to the fluctuation of GIV at the precession scale. Although previous studies (e.g. [59]) speculated that the stalagmite δ18O records in EA could contain the information of winter temperature, our simulation finds that the expansion or contraction of the NH ice sheets (GIV) in the precession band mainly affects the EA April–May δ18Op by modulating the Asia–Pacific large-scale atmospheric circulation.
This current study emphasizes that the climatic implications of the δ18Op vary from place to place at the orbital scale. There are significant differences not only among the three regions of CA, SA and EA of Asia, but also between different sub-regions of the same climate type. For example, with the Pamir Plateau-Tianshan Mountains as the boundary, the Asian inland arid area can be roughly divided into two sub-regions—the western side is the arid region in CA, while the eastern side is the arid region in EA centred on the Tarim Basin. The CA and EA arid sub-regions are dominated respectively by the winter-rain and summer-rain regime climates [60]. Although the arid regions of CA and EA are all controlled by the westerly circulation, the climatic significance indicated by the annual δ18Op variation may be different due to the difference in precipitation seasonality between these two regions. Additionally, the EA monsoon region selected in this study includes south-eastern China in its southern part. On the orbital timescale, precipitation in EA often has the characteristic of opposite variation patterns between the southern and northern EA [61]. The water vapour sources for the southern and northern EA are not exactly the same [62,63], and the proportion of water vapour directly from the ocean is higher in the southern part than that in the northern part [56,57]. Therefore, the interpretation of the orbital-scale δ18Op variation for the southern part of EA monsoon region cannot be simply extended to the northern part, and additional analysis is needed to better understand the δ18Op variation pattern for each specific sub-region.
The δ18Op variations from our long-term transient simulations are helpful to deepen our understanding of the climatic implications of the oxygen isotope records of the Asian stalagmite and other sedimentary deposits by direct comparisons between the simulation results and geological records. However, due to the lack of available geological records, only the simulated EA annual δ18Op series and a Chinese stalagmite δ18O record [8] in the past 300 kyr can be well compared in detail (Note S3). At present, limited by the time span and continuity, the stalagmite δ18O records in CA [11] and SA [10] are not sufficient for direct comparisons with our simulation results. Therefore, the phase differences between the CA, SA and EA δ18Op series obtained by our simulation are currently difficult to verify with geological records. We also noted that the phase difference between the orbital-scale evolution series of the EA summer monsoon and the Indian summer monsoon reconstructed with the multi-proxy records from the Arabian Sea [64] are significantly different due to the phase difference between our simulated EA and SA annual δ18Op series. These discrepancies deserve further investigation in the future.
FUNDING
This work was supported by the Strategic Priority Research Program of the Chinese Academy of Sciences (XDB40030100), and the National Natural Science Foundation of China (41888101, 41991254, 41690115 and 42105049).
AUTHOR CONTRIBUTIONS
X.L. and Z.G. conceived the research. X.X. and G.C. performed the numerical experiments and plotted the figures. X.L. and Z.Y. drafted the manuscript. All the authors contributed to the interpretation of the simulation results and improvement of the paper.
Conflict of interest statement. None declared.
