


Abstract
The impact of the Tibetan Plateau uplift on the Asian monsoons and inland arid climates is an important but also controversial question in studies of paleoenvironmental change during the Cenozoic. In order to achieve a good understanding of the background for the formation of the Asian monsoons and arid environments, it is necessary to know the characteristics of the distribution of monsoon regions and arid zones in Asia before the plateau uplift. In this study, we discuss in detail the patterns of distribution of the Asian monsoon and arid regions before the plateau uplift on the basis of modeling results without topography from a global coupled atmosphere–ocean general circulation model, compare our results with previous simulation studies and available biogeological data, and review the uncertainties in the current knowledge. Based on what we know at the moment, tropical monsoon climates existed south of 20°N in South and Southeast Asia before the plateau uplift, while the East Asian monsoon was entirely absent in the extratropics. These tropical monsoons mainly resulted from the seasonal shifts of the Inter-Tropical Convergence Zone. There may have been a quasi-monsoon region in central-southern Siberia. Most of the arid regions in the Asian continent were limited to the latitudes of 20–40°N, corresponding to the range of the subtropical high pressure year-around. In the meantime, the present-day arid regions located in the relatively high latitudes in Central Asia were most likely absent before the plateau uplift. The main results from the above modeling analyses are qualitatively consistent with the available biogeological data. These results highlight the importance of the uplift of the Tibetan Plateau in the Cenozoic evolution of the Asian climate pattern of dry–wet conditions. Future studies should be focused on effects of the changes in land–sea distribution and atmospheric CO2 concentrations before and after the plateau uplift, and also on cross-comparisons between numerical simulations and geological evidence, so that a comprehensive understanding of the evolution of the Cenozoic paleoenvironments in Asia can be achieved.
INTRODUCTION
The Asian monsoons and arid climates are closely related to global change and, to a large extent, determine the formation and development of various Asian environments [1,2]. The formation and evolution of the Asian monsoon system and inland arid climates have long been a hot topic of Earth's environmental science. With continued accumulation of geological evidence of past climate and advances in the integration and analysis of such records, our knowledge on the timing of establishment of the Asian monsoons and evolution of Asian inland arid climates has improved significantly in recent decades. In terms of the South Asian monsoon (SAM), deep sea drilling records from the Arabian Sea [3] and ecological records from the South Asian Subcontinent [4] suggested that the establishment or enhancement of the SAM occurred at ∼8 Ma during the late Miocene. However, owing to relatively short time-spans for most geological records of the SAM, there is no sufficient evidence regarding the existence or absence of the SAM before the Miocene. In contrast, there is a great abundance of geological evidence on the history of the East Asian monsoon (EAM), which has helped advances in research on the initiation of the EAM. For example, various studies based on the Chinese loess and red clay deposits, which reflected alternating periods of dominating winter and summer monsoons in East Asia, indicated the existence of the EAM system since approximately 2.6 Ma [5–7], or 7–8 Ma [7–9], or even 22–25 Ma [10,11]. Comprehensive reconstructions of evolution of the patterns of paleoenvironments based on geological and geo-biological evidence [12–14] constrained the time of formation of the EAM to the late Oligocene-early Miocene transition. As good proxies of the aridity of inland Asia and intensity of the atmospheric circulation [10,15,16], so far the oldest eolian loess deposits have been found to appear during the late Oligocene to early Miocene [10,11,17]. However, a recent study by Quan et al. [18] suggested that the EAM may have existed during most of the Paleogene (65–23 Ma), which limited the formation of the zonal distribution pattern of arid climates in East Asia. The discrepancies in the timing of the EAM origin in geological observations may result from the differences in the definition of monsoons and interpretations of climate proxy data. From the above, it can be seen that there are still different views presented in current studies of the Asian paleoenvironments, especially those regarding the timing of the formation of the Asian monsoons, establishment of the subsystems of the Asian monsoons, and the evolution of Asian inland arid climates.
Beside geological observations, numerical simulations using 3-D global climate models have become an important approach in studying the evolution of the Asian monsoons and arid environments. In numerical simulations, boundary conditions of atmospheric circulations and/or external forcings can be modified to isolate the effects of various forcing mechanisms and to examine the responses of Asian regional climates to such changes. According to the conventional concept of monsoon climate, monsoon circulation is mainly the product of seasonal variation in land–ocean thermal contrast [19,20]. Numerous simulation experiments have indicated that changes in the land–ocean distribution [21,22] and the uplift of the Tibetan Plateau (TP) [23–25] can have significant impacts on the establishment and evolution of the Asian monsoons. Comparisons of the results of numerical simulations with certain geological evidence of the Cenozoic climate change may allow us to qualitatively determine the long-term trends, regional differences, and the forcing mechanisms of climate change in Asia during geological time periods when matching results exist. For example, numerical simulations by Kutzbach et al. [24] and Liu and Yin [25] indicated that the TP uplift increased the effects of the plateau as a heat source in summer and heat sink in winter, which amplified the seasonal contrast and enhanced the seasonal shift of the dominant winds in Asia. Therefore, the uplift of the TP enhanced both the Asian winter and summer monsoons. In the meantime, the blocking of moisture by the plateau topography, descending currents caused by the topography-induced stationary wave and dynamic divergent flows from the west to east (W–E) of the plateau, and the descending air in regions outside the immediate vicinity of the plateau which compensates the rising air above the plateau caused by heating in summer all contributed to the aridification of inland Asia [24,26,27]. These simulation results are qualitatively consistent with the geological records that reflected paleoenvironmental changes during the Cenozoic, with wetting trends in regions south and east of the TP and drying trends in regions west and north of the TP [24,28,29], reflecting the important roles played by the TP uplift in evolution of the Asian climates during the Cenozoic.
Through model-observation comparisons in studies of the impact of the TP uplift on the formation of the Asian monsoons and inland aridification, it has been recognized that there are still many uncertainties. According to the cumulating geological records over time, the main body of the TP, its margins, and various units of the plateau may have different uplift histories [30–32]. Therefore, the linkages between the history of the plateau uplift and the evolution of the Asian monsoons are not entirely straightforward. For example, An et al. [33] suggested that the evolution of the Asian monsoons was coupled with the TP uplift in several stages since the late Miocene, while others have claimed that the Asian monsoons existed in Eocene [34,35], which is earlier than the timing of full-scale uplift of the TP. Several idealized numerical simulations also indicated that the Asian monsoons can be induced by the land–ocean distribution pattern alone without any topography [21,22]. Other model studies suggested that the uplift of the TP only had limited influence on the SAM [36] or that the monsoon is only a result of the seasonal shift of the Inter-Tropical Convergence Zone (ITCZ) [37]. Regarding the evolution of arid inland environments in Asia, numerical simulations have revealed that the uplift of the TP contributed significantly to the formation of the mid-latitude arid climates in Asia [26], although other factors, including the retreat and closing of the Tethys Sea and associated changes in the land–ocean distribution pattern, may have also contributed to the aridification of inland Asia [38,39]. Additionally, at a finer scale, a recent simulation study revealed that the limited uplift of the mountains in the northern TP, including the Pamirs, Tianshan, Kunlun, Altyn-Tagh, and Qilian Mountains, also contributed to the aridification of inland Asia since the Miocene [40].
It can be seen from the above that numerous studies have been conducted based on geological records, numerical simulations, or comparisons between the two to examine the formation and evolution of the Asian monsoons and arid inland environments during the Cenozoic. However, different views still exist, especially regarding the impact of the plateau uplift and, if such an impact indeed exists, its magnitude and spatial range. Therefore, it is necessary to obtain the knowledge of the conditions before the TP uplift, so that a focus on the background of the formation of the Asian monsoons and inland arid environments, especially the distribution patterns of the Asian monsoon regions and arid inland arid regions before the TP uplift, is of great scientific significance for achieving a comprehensive understanding of the history of the Asian paleoenvironmental change. Equally important is to understand the roles played by the TP uplift in this process. In this article, we first describe numerical simulation results from a global coupled atmosphere–ocean general circulation model (AOGCM) for scenarios with and without global topography. By integrating a detailed analysis of the current simulation results with comparisons with previous studies, we examine the distribution patterns of the Asian monsoons and arid climates before the TP uplift and then review and discuss relevant issues and associated uncertainties, which allow us to identify some of the problems or issues that are worth further study in the future.
RESULTS FROM A COUPLED ATMOSPHERE–OCEAN MODEL
We first analyze simulation results from a fully coupled AOGCM by focusing on the spatial distribution patterns of the Asian monsoons and arid zones in a simulation without the global topography and using this analysis as the basis for further discussion and review. The model used in this study is the Fast Met. Office and UK universities Simulator (FAMOUS) coupled AOGCM [41,42], which is a low-resolution version of the HadCM3 AOGCM [43]. These AOGCMs do not use flux adjustments. FAMOUS has an atmospheric component with a horizontal resolution of 5° × 7.5°, with 11 vertical levels. The ocean component has a horizontal resolution of 2.5° × 3.75°, with 20 vertical levels. The atmosphere and ocean are coupled once every day. FAMOUS is structurally almost identical to HadCM3, and produces climate and climate-change simulations that are reasonably similar to HadCM3 but runs much faster. This characteristic is particularly useful for long runs of paleoclimate simulations, for which HadCM3 is too expensive in terms of computing time and resources. More details of the description of FAMOUS and the simulated climates are documented in Smith et al. [43,44]. The two experiments described in this study have been run with the standard pre-industrial setup of FAMOUS [43] with an atmospheric CO2 concentration of 280 ppmv. One experiment has the present-day land–ocean mask and topography (abbreviated as ‘OROG’ for the name of the experiment); and the other has the same land–ocean mask and idealized, uniform land surface characteristics as the OROG, but with global orography height set to 0 (abbreviated as ‘FLAT’ for the name of the experiment). Despite zero global topography in the FLAT experiment, the Asian regional climate is more impacted by the TP than any other terrains. Thus, the FLAT experiment is regarded as a scenario before the large-scale uplift of the TP for simplicity. Both of these experiments have highly idealized, globally uniform land surface characteristics (albedo, roughness length, etc.) to highlight the impact of the orographic changes. Both experiments have been run for 1000 years and the last 100 year mean results are used in this paper. We mainly focus on the distributions of the Asian monsoon regions and arid zones in the following analysis.
Asian monsoon regions
The characteristics of precipitation of monsoon climates are mostly reflected in the seasonal cycle of alternating rainy and dry seasons during the year. In reference to Wang and Ding [45], we first define the monsoon regions in the Eastern Hemisphere for the OROG and FLAT experiments using the rainfall seasonality. Specifically, we define monsoon regions as places where the difference in rainfall between summer [rainy season, as June–July–August (JJA) for Northern Hemisphere (NH) and December–January–February (DJF) for Southern Hemisphere (SH)] and winter (dry season, as DJF for NH and JJA for SH) is greater than 200 mm, and where the percentage of summer to annual total rainfall is greater than 40%. Regions with summer–winter rainfall difference greater than 400 mm can be considered as the typical monsoon regions. Based on this definition, for the OROG experiment representing the present-day condition with global topography (Fig. 1A) , the simulated typical monsoon regions are mostly found in the northern tropical Africa (∼5–20°N), Indian Subcontinent, Indochina, eastern part of the TP, central and southern China (east of the TP and south of 40°N) and northeastern China in the NH. In the SH, typical monsoon regions are found in the southern tropical Africa (∼5–20°S) and northern Australia (north of 20°S). For the typical monsoon regions where rainy–dry season rainfall differences are greater than 400 mm, rainy-season rainfall all exceeds 40% of the annual totals and it may reach 70% or higher in the core regions (Fig. 1A). The simulated typical monsoon regions in general match the distribution of the modern monsoon regions in the Eastern Hemisphere as defined by observed precipitation data [45], which indicates good reliability of the model in producing realistic Asian monsoon climates in simulations.
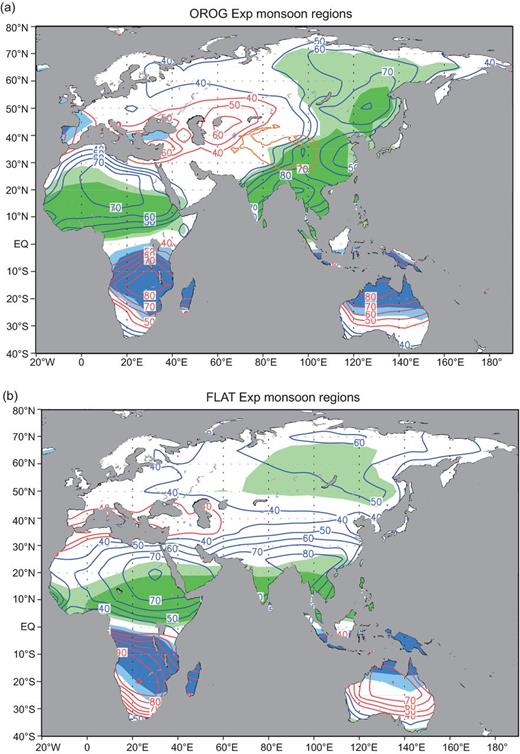
Distributions of the typical monsoon regions in (a) OROG and (b) FLAT experiments. The dark (light) green shaded areas indicate that the difference in rainfall between JJA and DJF is greater than 400 mm (200–400 mm). The dark (light) blue shaded areas indicate that the difference in rainfall between DJF and JJA is greater than 400 mm (200–400 mm). The blue (red) lines show the percentage of JJA (DJF) to annual total rainfall. The orange line in figure 1(a) represents the areas with elevations higher than 3000 m.
Under the condition of zero global topography (Fig. 1B), the monsoon regions simulated in the FLAT experiment are still found in tropical Africa and Australia, although their positions have shifted slightly and spatial extents are somewhat reduced. The greatest changes are found in the Asian monsoon region, where the typical monsoon regions north of 20°N in Fig. 1A have all disappeared in South and East Asia. Fig. 1B shows that the main monsoon regions in Asia are now limited to the Indian subcontinent and central-southern Indochina. This suggests that even without the presence of the TP, the South and Southeast Asian monsoons may still exist, but with reduced intensities and spatial extents, as long as the land–ocean configuration remains the same as today. Additionally, weak monsoon climates can be found in parts of southwestern, southern, and eastern China. It should also be noted that beside the tropical and subtropical monsoons, there exists a quasi-monsoon region in Siberia of the upper mid-latitudes of the Asian continent (∼50–65°N) where summer rainfall accounts for 45–60% of the annual total (Fig. 1B).
According to the traditional definition of monsoons, they should be characterized by a seasonal reversal of dominating winds [19,46], which lead to wet summers and dry winters. In order to visually interpret the seasonal changes of the dominant winds from the FLAT experiment representing the zero-topography condition, we mapped the simulated NH winter (DJF) and summer (JJA) 1000 hPa wind vectors (Fig. 2). In the NH winter (Fig. 2A), the wind field from Africa to East Asia is very similar to typical planetary wind belts, with the regions south of 30°N mostly being dominated by northeasterly winds. In the NH summer (Fig. 2B), however, the regions south of 20°N from Africa to South and Southeast Asia and those south of 30°N in East Asia are mostly dominated by southwesterly winds. Such northward shift of the summer southwesterly winds from African sector to Asian sector is predominantly due to the land–sea thermal contrast [22], although the uplift of the TP further promotes the northward advance of Asian summer monsoon and the final onset of the EAM in the north as demonstrated in previous studies [22,23,25,47] and this study. With such seasonal changes in the wind field across the Asian continent, the winter–summer dominant wind direction differences are greater than 120° for the central and southern Indian subcontinent, Indochina, and southern China (south of the Yangtze River) (as shaded areas in Fig. 2). Obviously, these tropical monsoon phenomena as shown in Fig. 1B are attributable to the seasonal oscillation of the ITCZ. Although Fig. 2 shows that the seasonal wind reversal can reach as far north as 30°N, the typical monsoon climate according to rainfall seasonality (Fig. 1B) would limit its northern boundary around 20°N. We also noted that across the entire Eurasia, there is a narrow belt running from W–E north and east of the Lake Baikal with prominent seasonal wind reversal (Fig. 2). This region is located along the northern margin of mid-latitude westerlies in winter, while in summer it is influenced by easterly winds in the northern part of the continental low pressure system. This narrow belt with seasonal reversal of the dominant surface winds matches the aforementioned upper mid-latitude quasi-monsoon belt centered at 55–60°N, defined earlier using seasonality of precipitation.
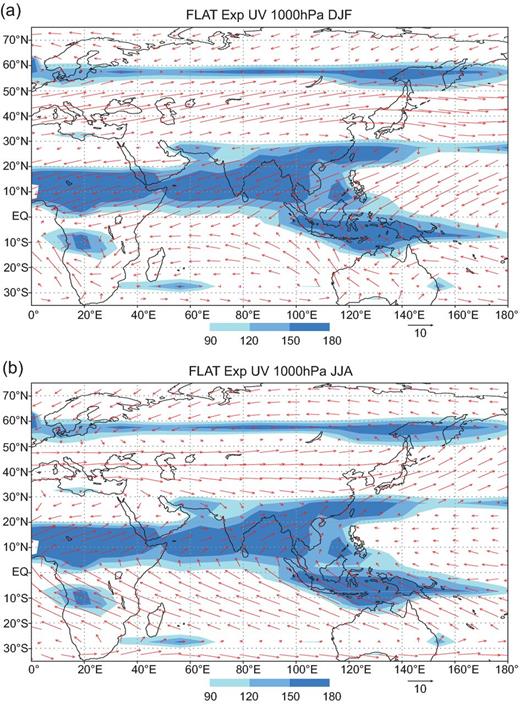
FLAT experiment simulated wind vector fields at 1000 hPa for (a) DJF and (b) JJA. The areas shaded are where the absolute value of difference in the mean wind directions between winter and summer is from 90 to 180 degree.
Summarizing the above analysis, based on the seasonal cycles of precipitation and wind, the typical monsoon regions are mostly found in the tropical regions before the TP uplift. Across the Asian continent, typical monsoon climates can be found in the central and southern Indian subcontinent and Indochina, connecting to the weak monsoon regions in southwestern, southern, and eastern China. At the same time, typical monsoon climates can be found in the tropical Africa and northern Australia. Additionally, there might be a narrow zone of quasi-monsoon climate running across the upper mid-latitude Eurasia, especially in central and southern Siberia.
Continental arid zones
Aridity results from the presence of dry descending air and a lack of moisture, which lead to the lack of clouds and precipitation. Aridity arises from a number of general causes acting individually or working together, for example, atmospheric high pressure zones, continentality, rain shadows, and cold ocean currents [48,49]. At the regional scale, the causes of aridity mainly include continentality that depends on distances from large water bodies or oceans, rain barrier/rain shadow effects of mountains, or cold oceanic surface currents that create stable atmosphere and divert rain–laden air away from coastlines. At the continental or global scale, relatively extensive aridity results from subtropical high-pressure zones related to the downward branches of the Hadley Cells. The descending branches forms zones of elevated sea-level pressure (SLP), referred to as the subtropical high-pressure belts where anticyclonic circulations are persistent [50]. Compression and adiabatic warming of the descending air mass within the high-pressure belts lead to dry and stable atmospheric conditions, eventually promoting development of dryland climates for the regions lying under the anticyclones of the subtropics. Therefore, SLP fields can be used to represent distributions of persistent high-pressure systems and the associated arid climate zones.
In the FLAT simulation representing the SLP distribution conditions before the TP uplift (Fig. 3), there is a zonal pattern of SLP isobars in the NH winter across the entire Eurasian continent, with SLP values decreasing from the south to north in the mid- to high-latitude regions north of 30°N (Fig. 3A). This distribution pattern indicates the dominant control of the westerly circulation in the mid- to high-latitudes with the center of the subtropical high-pressure zone located close to 30°N from Southwest to East Asia, while the low-pressure zone corresponding to the ITCZ is located in the tropical regions south of the equator (Fig. 3A). During the NH summer (Fig. 3B), there is a warm-core surface low pressure over the land mass, with the center located near the Lake Baikal at approximately 55°N. The thermal low in the mid-high latitudes over the Asian continent is a direct response to the summer solar radiation and heating of the Eurasian continent since weak land surface feedbacks associated with the uniform land surface characteristics. This low pressure over land extends to the south and interrupted the continuity of the subtropical-high belt over the Eurasian continent, while over the oceans the northern extent of the subtropical high-pressure cells can reach 40°N or even further north in the Pacific (Fig. 3B). At the same time, the subtropical high-pressure belt in the SH is centered near 30°S, extending from southern Africa to central Australia. For the annual average SLP (Fig. 3c), the NH subtropical high-pressure belt extends from North Africa to East Asia, centered near 30°N and there is a low-pressure zone extending W–E centered near 55°N. The latitudes in-between are controlled by the westerlies, while the latitudes north of 55°N are dominated by the polar easterlies. In the SH, the subtropical high-pressure belt is centered near 30°S.
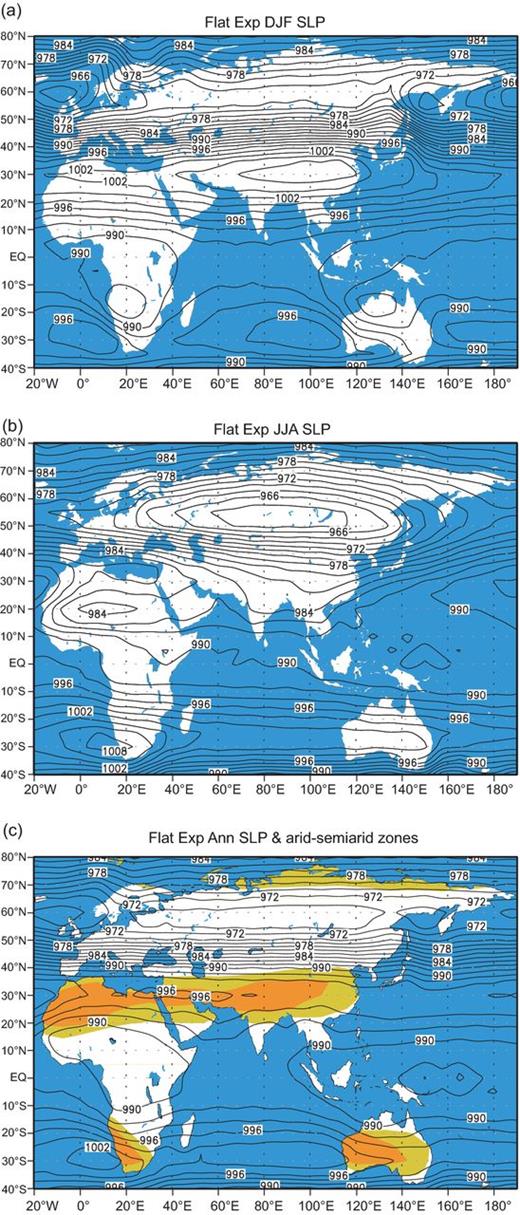
. FLAT experiment simulated SLP fields for (a) DJF, (b) JJA, and (c) annual means. The areas of <200 mm/a and 200–400 mm/a are shaded with brown and yellow colors, respectively.
According to the comprehensive physical regionalization of China by Zhao [51] and Dry/wet Climate Zoning by Geng et al. [52], the simplest criterion to define dry and wet climates is mean annual precipitation (MAP). We define regions with MAP lower than 200 mm as arid and those with MAP of 200–400 mm as semi-arid [51]. Fig. 3c shows the distribution of arid and semi-arid regions under the condition of zero topography (FLAT), which are mostly found in a continuous zone between 20°N and 40°N, extending from North Africa to East China, with the core regions near 30°N corresponding to the central location of the NH subtropical high-pressure belt. Zhang et al. [53] simulated the Asian climates during the early Eocene and found similar results with an arid zone between 20°N and 40°N. Therefore, it is likely that monsoon climates did not exist in the northern part of South Asia and most of East Asia before the uplift of the TP. Instead of a monsoon circulation, these regions are dominated by widespread and persistent subtropical high pressures and the associated circulation patterns that create the low- to mid-latitude arid zone in Asia. Additionally, arid and semi-arid regions are also found in southwestern South Africa, central and southern Australia, and the northern margin of Eurasia.
DISCUSSION AND PERSPECTIVES
In this section, we integrate the above results from the AOGCM simulations with previous relevant simulation and observation studies and discuss the establishment of the Asian monsoons and development of Asian inland arid climates in the Cenozoic. After summarizing the uncertainties in the current knowledge, we will propose some research questions worthy of in-depth study in the future.
Formation of the Asian monsoons and inland aridity
From the above experiment of zero global topography in a coupled AOGCM, we have inferred distribution patterns of monsoons and arid climates in Asia before the plateau uplift. The simulation results indicate that without global topography, only the tropical monsoons exist in South and Southeast Asia, while the EAM does not exist. These results have validated previous results from atmospheric general circulation models (AGCMs) that the establishment of the SAM is independent of the presence of the TP [36]. Previous studies using AGCMs also revealed that the presence of monsoon precipitation and seasonally reversing wind system in the broad region south of 25°N stretching from the Arabian Sea, to India, Bay of Bengal, and Southeast Asia is clearly evident even without the TP topography [25,54]. Therefore, it is not surprising to find the establishment of monsoon climates in the tropical Asia as early as the Eocene according to recent paleoclimate simulations [34,35]. In contrast, the evolution of the EAM is more sensitive to the uplift of the TP than that of the SAM, especially for the northern part of East Asia [25]. The TP initiates the extratropical EAM, especially through its thermal effects [25,55], and thus its uplift should have played an important role in the formation of the entire Asian monsoon system, but especially for the East Asian component. Our results indicate that, if monsoon climates existed in regions north of the Yangtze River in East Asia in the Eocene or even earlier as suggested by Quan et al. [18,56], then the premise should be that the TP uplift must have already occurred and achieved a considerable scale and height at that time. Since the uplift of TP is a complex and diachronous process [57,58], its impact on different sub-systems of the Asian monsoon system is also variable [59] and requires further study. However, at this moment, the 3-D paleoelevation data of the TP since Paleogene and quantitative records of the East Asian peleoenvironments are still sketchy. Even for the limited amount of geological records available, some cannot be fully cross-validated among themselves, due to low temporal resolutions and difficulties in dating [18,32,60–62], or with numerical simulation results (see the last paragraph of this paper).
It is worth noting that there may have been a narrow quasi-monsoon zone running across the upper mid-latitude Eurasia (50–65°N), especially in central and southern Siberia before the TP uplift according to our simulation results (Fig. 1B). This region is characterized by a summer rainy season with prominent seasonality. In its core region at 55–60°N, the directions of the winter and summer dominating winds are nearly opposite (Fig. 2), fitting the traditional definition of the monsoon climate. Therefore, to a certain extent, this region can be considered as having a weak monsoon climate. However, it should be pointed out that at these relatively high latitudes, the winds that bring moisture to produce summer precipitation are not originated from the tropical oceans and have no direct connections to the low-latitude and SH circulations. Thus, such a quasi-monsoon climate is different in nature from the conventional monsoon climates in tropical and subtropical regions. However, this feature of quasi-monsoon climate needs to be further defined, as there are no geological data yet available to support such a model phenomenon.
Under our simulated conditions of zero global topography, the 20–40°N latitudes in the Eastern Hemisphere are under the influence of subtropical high-pressure belt year-around, which causes the formation of the W–E running arid zone. This distribution pattern of the arid climate has been supported by geological evidence indicating that broad zonal arid regions existed across the mainland China in early Tertiary [12,13], while in inland Asia, dry climates prevailed during the long geological period of Eocene to Oligocene [63–65]. The regions south of the subtropical arid zone are mainly controlled by the tropical monsoons, while the latitudes north are dominated by the westerly circulation. In our simulation results, there is no arid climate in the inland Asia north of 40°N, which is similar to previous simulation results by AGCMs [26,66]. This means that, according to numerical simulation results, arid regions did not exist in mid- to high-latitudes of Central Asia before the TP uplift. The characteristics of the actual present-day landforms, however, show that most deserts in Central Asia, Republic of Mongolia, and northern China are located in 40°N or higher latitudes. Even with the convincing results from simulation studies pointing to the TP uplift as the major cause of the aridification of Central Asia, the actual climate events during the drying process of Asian inland need further investigation. For example, based on geological records from a terrestrial site (∼48°N) in the Junggar Basin in the Asian interior, an evident aridification event at the Eocene–Oligocene boundary was attributed to global cooling rather than regional tectonic uplift [67]. However, the severe aridity and vast deserts of the Junggar Basin could not have occurred without its specific geography and topography in the region and its vicinity. Therefore, the TP uplift, especially the uplift of the northern TP [40], may have an inherent relation to the formation of the arid regions north of 40°N in Central Asia, the emergence of inland deserts in North China, and enhanced dust cycles in these regions during the Cenozoic.
Comparisons with biogeological data
Our numerical experiments, thus, have generated some clear insights with regards to the Cenozoic evolution of the Asian climate pattern of dry–wet conditions. Prior to the TP uplift, typical monsoonal climates are only found in the tropical regions. Across the Asian continent, monsoons prevail in the central and southern Indian subcontinent and Indochina, connecting to the weak monsoon regions in southwestern, southern, and eastern China (Fig. 1B). Typical monsoons are also found in the tropical Africa and northern Australia. These monsoon phenomena have been resulted from the insolation-induced seasonal shifts of the ITCZ. On the contrary, a similar-to-present monsoon pattern is observed in the model outputs corresponding to a modern-topography scenario with an elevated TP (Fig. 1A). These results are highly consistent with the available geological evidence in South Asia (e.g. [68,69]) and reconstructions of the Cenozoic paleoenvironmental patterns based on biogeological data from China [12,13,70,71]. Sediment records from northeastern India show that the SAM was already established by the late Oligocene with an intensity similar to that of today [68]. The fossil wood of Myanmar also shows that the Bengal Bay experienced a significant monsoonal regime as early as 40 Ma ago [69]. The monsoonal regions in the low-latitudes prior to the TP uplift, as shown in our experiments (Fig. 1B), are consistent with the relatively humid conditions in southern China from the Paleogene to the Oligocene as documented by the biogeological data [12,13] (Fig. 4A and b). Because the cause of these low-latitude monsoons is attributed to the seasonal oscillation of the ITCZ, their presence could be traced back to the very early Earth history when these low-latitude land masses drifted to the present latitudinal positions [13].
![Paleoenvironmental patterns during the Oligocene and Miocene in China (modified and simplified after Guo et al. [13]). (a) Early and middle Oligocene; (b) late Oligocene (with dashed line indicating the uncertainty for defining the southeastern boundary between the arid/semi-arid belt and the humid belt owing to insufficient data); (c) early and middle Miocene; and (d) late Miocene.](https://oup.silverchair-cdn.com/oup/backfile/Content_public/Journal/nsr/2/4/10.1093_nsr_nwv068/3/m_nwv068fig4.jpeg?Expires=1748417280&Signature=OkEr8ucWEaSCjI5QcFyybxJ9OIj8tgy8lN-WusONlDfaRBeuT0HwgU7DXPb2fglci3rZdVT9inVI1J7Shvf~eGcjczw8Ka06Z5gRO4klwnAt9n7k3QGbXG7ZAKfzI67GDvC11AweL1JnWr7JW04hpwgeOtz~Ok3YmcjEQM4kjRrq40nHDOFYT8~UacFiJR1UrAQg-x4jNJgPrfa3RfinmLEeXmvO~rJGiq-WiIg6nJIlur8h1zYR-mmFj0o5u0K33WXejzjlz2ncOdfVnk~cFtA6GsagVzHlInL50qHK7UUm4sGhVqJs4SYieAqjc68kb-Jluu3EGTbQe93tRE5peQ__&Key-Pair-Id=APKAIE5G5CRDK6RD3PGA)
Paleoenvironmental patterns during the Oligocene and Miocene in China (modified and simplified after Guo et al. [13]). (a) Early and middle Oligocene; (b) late Oligocene (with dashed line indicating the uncertainty for defining the southeastern boundary between the arid/semi-arid belt and the humid belt owing to insufficient data); (c) early and middle Miocene; and (d) late Miocene.
As for the Asian drylands under the condition of zero global topography, our experiments show a roughly zonal and continuous arid and semi-arid belt prior to the TP uplift, which is located between 20°N and 40°N extending from North Africa to East China, with the core regions near 30°N. This dry belt is clearly attributable to the NH subtropical high-pressure zone. In contrast, such a continental low-latitude dry belt disappears in the scenario after the TP uplift. Meanwhile, central Asia including northwestern China becomes drier. The dry conditions in central Asia after the TP uplift are no longer linked with the subtropical high. The simulated zonal dry belt before the TP uplift (Fig. 3c) is highly consistent with the semi-arid zone defined by the biogeological indicators with Paleogene ages within China (Fig. 4A and b) [12,13]. There was a broad W–E running arid zone across the mainland China in the early Tertiary. From the late Tertiary to present, however, the arid climate had been limited mostly to the northwestern China. The somewhat boarder dry belt shown by the biogeological data may be caused by the latitudinal shifts of the dry zone in response to the changing global boundary conditions, such that the actual dry belt at any given time should be narrower [13]. This kind of aridity distribution, referred to as ‘planetary-type dry lands’, is linkable without any doubts with the NH subtropical high-pressure zone. Given that the presence of the subtropical high is relatively independent of any specific topography conditions, such distribution of aridity could also be traced back to much earlier history of the Earth when continents were present in the subtropical latitudes [13].
The results of numerical experiments in this study for the scenario with global topography are also in agreements with the Cenozoic paleoenvironmental patterns (Fig. 4) [12,13]. The most prominent features in our model outputs include the reinforced Asian summer monsoon circulations prevailing in the low- and mid-latitudes of Asia and expanded monsoon regions over East Asia (Fig. 1A). This is strongly supported by the biogeological data [13] showing a drastic humidification in eastern China since the early Neogene (Fig. 4c). Similarly, the simulated dry climate in central Asia is consistent with the dry conditions documented by the biogeological data [12,13]. Thus, the spatial configurations of the monsoon and arid regions are highly comparable in shape with the modern climate pattern in Asia. The disappearance of the subtropical aridity in East Asia after the TP uplift is clearly attributable to the northward development of the EAM with the TP uplift. Although our current study has not taken into account the roles of land–sea distributions, changing CO2 concentrations and other possible global boundary conditions, it provides clear insights to the important roles of the TP uplift in the formations of the monsoon-dominated climates and inland deserts in Asia. Thus, from both modeling and biogeological data perspectives, the low-latitude monsoons prior to the TP uplift are conceptually different from the present-day Asian monsoons that prevail not only in the low-latitude continents, but also in the mid-latitude Asia close to the position of the NH westerlies. Similarly, the subtropical high controlled aridity in Asia before the TP uplift also radically differs, in both origin and concept, from the present-day dry lands in central Asia, which are independent of the subtropical high. Our results suggest that any studies of the subject should consider these crucial conceptual differences. Otherwise, controversies could arise simply because the discussed concepts of the monsoons and aridity are different.
The timing of this drastic climate transition, from a zonal pattern to the similar-to-present patterns over the Asian continent has also drawn much attention from the paleoclimate community. Our model outputs, in association with the geological data, may provide a significant insight to this issue. Although modeling results themselves are not actual chronological events, geological data (Fig. 4) indicate that this major transition would have occurred near the Miocene/Oligocene boundary, between 22 and 25 Ma [10,12,13]. From a temporal perspective, the Miocene loess-soil sequences in northern China [10,11,13] are strong evidence of the presence of monsoon-dominated climates in East Asia back to the early Miocene, as the loess layers attest to the presence of circulation patterns that brought eolian dust from the deserts of interior Asia, while the clay-leached paleosols are firm evidence of more humid conditions with circulation patterns that brought moisture from the oceans [10,13]. These two phases of circulation patterns might be in presence at the same time but alternating seasonally with different directions, rightfully defining a monsoonal climate pattern at least by the early Miocene. Comprehensive reconstructions of the spatial patterns of paleoenvironments based on biogeological evidence can better reflect the evolution process of the Asian arid regions than separate geological records at individual locations. The mapping of the biogeological data by different authors [12,13,71] consistently showed that the Oligocene environmental patterns remained zonal but the Miocene patterns, especially the one for the early Miocene (Fig. 4) [13], were already similar to the present-day pattern. Such changes suggest that at the boundary between the Oligocene and Miocene, the atmospheric circulation over East Asia experienced the shift from a planetary-wind-dominant type to a monsoon-dominated wind system, which disrupted the contiguous zonal pattern of arid regions in Asia and caused corresponding changes in the paleoenvironments. These maps tend to constrain the major transition of climate to the Miocene/Oligocene boundary in age, approximately 22–25 Ma. This transition of the paleoenvironmental pattern marks the establishment of the monsoon climates over East Asia north of about 30°N in the early Miocene, which can be used as important evidence against the views of earlier or later EAM establishment. The main challenge for the views about an earlier EAM establishment, for example, the Eocene monsoon [35], would be the zonal climate pattern defined by the Eocene geological data. In contrast, the similar-to-present-day environment pattern since the early Miocene [13] and the loess-soil sequences in northern China would negate the views of a much later EAM establishment. It should be pointed out that the above shift of paleoenvironmental patterns over East Asia could be the consequence of the TP uplift achieving a certain threshold, because the monsoon over the northern East Asia did not exist until the TP reached about half of its current height [25] in despite of earlier uplift of the TP [31,32].
The history of establishment and development of the SAM has not been entirely clear from geological observations, and thus it is difficult to conduct a comprehensive model-observation comparison. Most geological records of the SAM have relatively short time spans, except at few sites where the history of the monsoon can be traced back to the late Oligocene [68] or the late Eocene [69], before the large-scale uplift of the TP or for a period with low topography in general. Up to date, no marine records have been obtained to reflect an early existence (prior to the Miocene) of the SAM, although tropical monsoons related to the seasonal oscillation of the ITCZ should have existed before the TP uplift according to numerical simulations. A recent study based on stable carbon isotope records of benthic foraminifera from the Arabian Sea proposed that the present-day SAM wind system began to develop during the late Middle Miocene (∼12.9 Ma) and the summer monsoon was in its full strength in the late Miocene (∼7 Ma) [72]. However, the middle or late Miocene should be regarded as a period of intensification rather than initiation of the SAM. Evidently, the major episodes of strengthening of the SAM in mid-late Miocene [3,4,72] may not have a direct link to the uplift of the main body of the TP, an event far before the Miocene [31,32,73]. Additionally, the climatic significance of the proxies for the SAM needs further exploration. For example, the late Miocene Indian Ocean high-productivity event estimated using benthic foraminiferal data, which was originally linked to intensification of the SAM, may be attributed to the Antarctic glaciation and global cooling [74]. A recent oceanography study [75] did not reveal any significant sea surface temperature changes in the Arabian Sea, a crucial criterion previously used by Kroon et al. [3] to define the reinforced SAM.
Current uncertainties and further issues
It should be noted that the above views regarding the distributions of the monsoon regions and arid zone in Asia before the TP uplift have limitations and uncertainties. First, in this simplified experiment, we look at a condition with zero global topography globally, which is unrealistic for almost any geological period. Also, in our study, as well as in many other previous numerical simulations, the same present-day land–ocean configuration has been used, while in fact global distribution pattern of land masses and oceans changed greatly during the Cenozoic due to plate tectonics [30,76]. The position of the Eurasia continent, especially the position of the Indian subcontinent [77], and the condition of the Tethys Sea [78,79] were very different from the present. Earlier numerical simulations have indicated that changes in the land–ocean configuration, especially such changes in the lower latitudes, may significantly influence the establishment and evolution of the monsoon climates [21,22,54,80]. Therefore, there is the urgent need to study the influence of the geologically realistic distribution pattern of land masses and oceans on the formation of Asian monsoons before the TP uplift.
Second, changing atmospheric CO2 concentration was not considered in our numerical simulations. Atmospheric CO2 concentration changed significantly during the Cenozoic [81]. A recent simulation study by Licht et al. [35] revealed that the Asian monsoons had already appeared in the late Eocene, which was likely the result of the enhanced greenhouse effect from extremely high atmospheric CO2 concentrations at the time. However, according to the IPCC's projections for future climate change scenarios based on multi-model ensembles [82], although precipitation may increase in the Asian monsoon regions under the scenario of increased greenhouse gas concentrations, mostly caused by enhanced moisture convergence, the monsoon circulation intensity itself will be weakened. This means that the effects of changing atmospheric CO2 concentration on the Asian monsoons before the TP uplift should also be examined in detail. Additionally, making things even more complex, the palaeogeography related to plate tectonics has been recognized as a key factor controlling the long-term evolution of the atmospheric CO2 through its capability of modulating the efficiency of silicate weathering and the climate sensitivity to atmospheric CO2 [83]. Consequently, the modulation of changing atmospheric CO2 to the development of the Asian monsoons during geologic time has been identified as an important area for further research.
Finally, in view of the current limited knowledge and the importance in understanding the distribution of the Asian monsoon and arid regions before the TP uplift as the foundation for the study of the impact of the TP uplift on spatial patterns of climates in Asia, there is much more to accomplish in areas of numerical simulation and analysis of geological records. This is especially true in terms of cross-comparison and integration of the simulation results and geological evidence. For example, regarding the question of whether the EAM existed before the Miocene, or if it indeed existed back then, its spatial range and intensity are still open for answers. From the modeling perspective, the emergence of the SAM should be earlier than that of the EAM, which, however, still lacks supporting geological evidence at the present. Unless the paleoelevation of the TP was sufficiently high in the Paleocene–Eocene period, the EAM system would not have been established at a much earlier time than the Miocene. For future studies, in the Tertiary before the TP uplift or when the plateau elevation was still low, the question of whether there existed a quasi-monsoon zone in the mid- to high-latitudes of Eurasia, separated from the tropical and subtropical circulations, also requires cross-validation using relevant geological records. Although there should have been no strong aridity in the mid-latitude Asian inland north of 40°N before the TP uplift according to numerical simulations, the actual timing of formation and spatio-temporal evolution history of the mid-latitude arid regions in central Asia remain as important scientific questions that require validation using reliable high-resolution geological records.
BD and RS are supported by the U.K. National Centre for Atmospheric Science-Climate (NCAS-Climate) at the University of Reading.
FUNDING
The work was supported by the Strategic Priority Research Program of the Chinese Academy of Sciences (XDB03020601) and the National Natural Science Foundation of China (41290255, 41572150) with numerical modelling support from NCAS-Climate and NCAS-CMS in the UK.
REFERENCES
