


Abstract
Glioblastoma (GBM) carries a poor prognosis despite standard of care. Early palliative care (PC) has been shown to enhance survival and quality of life while reducing healthcare costs for other cancers. This study investigates differences in PC timing on outcomes for patients with GBM.
This study used Surveillance, Epidemiology, and End Results (SEER)-Medicare data from 1997 to 2016. Based on ICD codes, three groups were defined: (1) early PC within 10 weeks of diagnosis, (2) late PC, and (3) no PC. Outcomes were compared between the three groups.
Out of 10 812 patients with GBM, 1648 (15.24%) patients had PC consultation with an overall positive trend over time. There were no significant differences in patient characteristics. The late PC group had significantly higher number of hospice claims (1.06 ± 0.69) compared to those without PC, in the last month of life. There were significant differences in survival among the three groups (P < .0001), with late PC patients with the longest mean time to death from diagnosis (11.72 ± 13.20 months).
We present the first investigation of PC consultation prevalence and outcomes, stratified by early versus late timing, for adult GBM patients. Despite an overall increase in PC consultations, only a minority of GBM patients receive PC. Patients with late PC had the longest survival times and had greater hospice use in the last month of life compared to other subgroups. Prospective studies can provide additional valuable information about this unique population of patients with GBM.
Glioblastoma (GBM), the most common primary brain malignancy diagnosed in adults, carries a poor prognosis despite standard of care treatment. With an overall median survival of 16–21 months, patients with GBM suffer from neurologic and cognitive symptoms, undergoing treatments that further affect their body and mind.1,2 Palliative care (PC) is defined by the World Health Organization as “an approach that improves the quality of life of patients and their families facing … life-threatening illness, through the prevention and relief of suffering …” in a broad manner.3 Literature about PC and its benefits for patients with advanced cancers is relatively developed, stating improvements in symptoms, mood, quality of life, and healthcare costs, along with some improvement in survival.4–7
PC timing in particular has been under investigation for patients with advanced cancers. Early PC was investigated as an intervention in a well-known clinical trial, resulting in enhanced quality of life and mood as well as survival benefit for nonsmall cell lung cancer (NSCLC) patients receiving PC consultation within 8 weeks of diagnosis.8 Current American Society of Clinical Oncology (ASCO) clinical practice guidelines updated in 2016 recommend interdisciplinary PC involvement for newly diagnosed patients within 8 weeks of cancer diagnosis.9 The ASCO recommendation appears based on clinical trials that enrolled patients with advanced-stage solid or hematogenous malignancies, which did not specify or include GBM diagnoses.10–13 Unfortunately, the prognoses for patients with GBM is overall poor as the majority of this patient population have survival times even shorter than the ranges of prognoses cited as eligibility criteria in randomized controlled trials investigating the impact of early PC for patients with advanced cancer.10,11
Early PC for patients with GBM warrants additional attention given the physical and neurocognitive symptoms associated with both the disease and treatment course.14 Early PC, along with timely advance care planning, would be a potentially advantageous implementation for GBM patients, who suffer from impaired decision-making capacity due to their progressive illness.14 Unfortunately, studies on early PC for seriously ill patients with brain tumors, in general, are lacking. In one retrospective investigation, McDermott et al. found that only 48% of NSCLC patients with intracranial metastatic disease were referred to PC, with median time from initial PC consultation to death as 1.6 months.15 Our retrospective study is based on a nationwide cancer registry/claims database and characterizes the landscape of early PC, with consultations within 10 weeks of diagnosis based on current standard of care treatment paradigms for GBM, and late PC after 10 weeks from diagnosis. We hypothesize that patients who received early PC, compared to those with late or no consultation, would have less aggressive end-of-life care and resource utilization.
Methods
Data Source
This study used the Surveillance, Epidemiology and End Results (SEER)-Medicare Linked Database. SEER is a national program of cancer registries collecting clinical, demographic, and cause of death information for persons with cancer. Medicare is a Center for Medicare and Medicaid Services health insurance program covering the elderly (65 or older), people with certain disabilities, or end stage renal failure from eligibility to death. Medicare data is composed of claims as enrollees navigate through the covered healthcare services.
We used SEER-Medicare 1997–2016 with claims from the five following files: (1) Medicare Provider Analysis and Review files, which includes all Part A short stay, long stay, and skilled nursing facility with one summarized record per admission (2) Carrier Claims files, which includes collected physician/supplier (Part B) bills for 100 percent of all claims (3) Outpatient files, which contain Part B claims for 100 percent for each calendar year from institutional outpatient providers (4) Home Health Agency, which contains 100 percent of all claims for home health services (5) Hospice files which contains claims data submitted by providers.
Patient Selection
We searched for patients with GBM with International Classification of Diseases (ICD)-O-3 site code C710-C719, histology code 9440–9442. Only malignant, microscopically confirmed cases were retained. We included decedents during study years (1997–2016), aged 66 years and above. Additional inclusion criteria are continuous enrollment in Medicare Part A and B from 3 months before diagnosis through death. Exclusion criteria included individuals enrolled in Health Management Organization (HMO) programs at any point in this period and patients who received their first palliative care (PC) consultation on the day of death, because of lack of time to evaluate patterns of care at the end of life.
PC encounter was identified using ICD-9 code V66.7 and ICD-10 code Z51.5 from Medicare data.16–19 For those with > 1 PC encounter, only the first instance was included. As the manuscript aims to investigate outcomes based on timing of PC, three analysis groups were defined: (1) the early PC group of patients whose first PC encounter occurred within 10 weeks of GBM diagnosis, (2) the late PC group of patients whose first PC encounter occurred after 10 weeks from GBM diagnosis, and (3) the no PC group. The timing of 10 weeks from diagnosis was selected based on previous retrospective studies citing a range of timing (4 weeks–90 days) for implementing early PC for other advanced cancer diagnoses.8,16,20,21 At present, GBM standard of care consists of surgical resection or biopsy followed by six cycles of concomitant and maintenance temozolomide chemotherapy as well as radiation therapy after sufficient recovery time from neurosurgery.22,23 Most published randomized controlled trials either did not address the timing of PC or focused on advanced solid malignancies, such as lung, gastric, and pancreatic cancers, without primary central nervous system cancers.24–26 There is currently no operationalized definition of when GBM, itself a notable disease with a poor prognosis from its onset, is considered advanced until it becomes recurrent and requires additional surgery and treatment.23
Patient Characteristics
Patients’ characteristics include age at diagnosis, comorbidities, GBM location and treatment-related information. The Elixhauser score was used to account for the burden of comorbidities.27 We used the adaptation to ICD-9-CM codes developed by Quan et al.28 Comorbidities were evaluated 3 months before diagnosis.
Outcomes of Interest
We assessed the following measures of health care utilization and cost from diagnosis to death, within 30 days and 6 months leading to death: (1) number of emergency room (ER) visits, intensive care unit (ICU) admissions, outpatient visit, hospital admission, home health agency service (HHA) use and hospice use; (2) total number of days for ICU stay, and total of days for hospital stay; (3) the Medicare payment to outpatient, hospital, HHA and hospice use, respectively; (4) Total Medicare payment. Payments were inflation-adjusted to 2016 US dollars using the medical component of the consumer price index (accessible through the United States Bureau of Labor Statistics website).29 The analysis of outcomes within the last 30 days and 6 months of life were performed in subgroups of those who survived at least 30 and 60 days after diagnosis, respectively. We also evaluated survival.
Statistical Methods
Demographics were compared using Kruskal Wallis test for continuous variables and Chi-square test for categorical variables among the groups. In order to obtain comparative groups by accounting for bias due to nonrandomization, inverse probability of treatment weight (IPTW) technique was used.30 In this method, the weight of underrepresented observation is increased and that of overrepresented observations is decreased in order to reduce the imbalances related to treatment allocation, mimicking the effect of randomization on baseline characteristics. To calculate the IPTW, a propensity score (PS) was first calculated using a logistic regression model in which the group was the dependent variable, and all the patient characteristics were included as independent variables. Then, for each person, the weight was calculated as the sample size adjusted inverse of the propensity of getting the PC that they actually got, i.e. , where n is the sample size of the group and PS is the propensity score of belong to that group. Post IPTW covariate balance was evaluated with P-values from Krustal Wallis test for continuous variables and Chi-square test for categorical variables. Outcomes were compared between the three groups using IPTW-weighted generalized linear regression, negative binomial regression for the number of healthcare utilization encounters, and linear regression on log-transformed values for payments. All tests were 2-sided and a P-value < .05 as considered statistically significant. Statistical analyses were performed with SAS 9.4 (SAS Institute Inc., Cary, NC).
Results
Patient Characteristics
A total of 10 812 patients over age 66 who were diagnosed with GBM, had Medicare insurance and records, and were deceased prior to 2017 were included (Figure 1). One thousand six hundred and forty-eight (1648, 15.24%) patients with GBM had PC consultation at any point during their disease course prior to death. Early PC involvement was defined as consultation within 10 weeks of GBM diagnosis as detailed in the Methods. Six hundred and seventy-six (676, 6.25%) patients with GBM in our study met criteria for early PC consultation. Nine hundred and seventy-two (972, 8.99%) patients with GBM had late PC consultation.
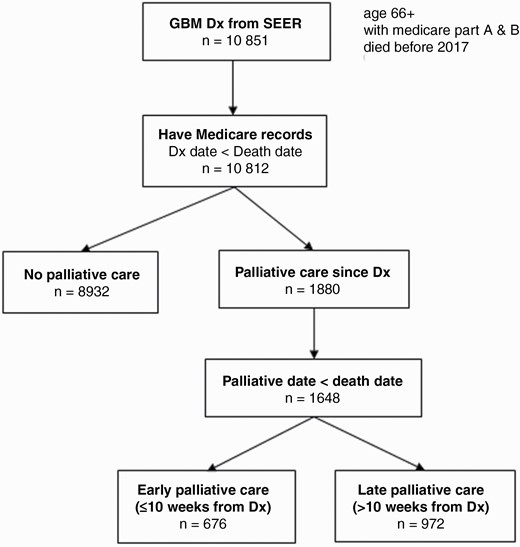
Flow chart of glioblastoma (GBM) decedents included for analysis, derived from SEER-Medicare database of 1997–2016.
In the IPTW-weighted data, there were no significant differences in demographics characteristics, including age, sex, and race, among groups of patients who either did not receive or received early or late PC. The average age across the three subgroups (no PC, early PC, and late PC) was 76 ± 6 years, and the majority of patients with GBM were male (no PC: 54.7%; early PC: 51.9%; late PC: 54.1%) (Table 1). The vast majority of patients were of White/Caucasian background (no PC: 92.3%; early PC: 92.1%; late PC: 93.2%). The Elixhauser Index is a measure of mortality based on 31 comorbidities, and most patients with GBM within each subgroup had scores over 3 (no PC: 45.6%; early PC: 46.2%; late PC: 45.5%).31 There were no significant differences in tumor location among the PC subgroups. Furthermore, patients within each PC subgroup underwent similar rates of biopsy, surgical resection, radiation therapy, and chemotherapy.
Patient Demographics and Tumor Characteristics Separated Into Groups of Patients Who Received no Palliative Care (PC) Consultation Versus Early PC Referral Versus Late PC Referral
| Unweighted | P value | IPTW weighted | ||||||||
|---|---|---|---|---|---|---|---|---|---|---|
| [1] No PC (n = 8932) | [2] Early PC (n = 676) | [3] Late PC (n = 972) | [2] vs.[1] | [3] vs. [1] | [3] vs. [2] | [1] No PC (weighed n = 8935) | [2] Early PC (weighed n = 661) | [3] Late PC (weighed n = 977) | P value | |
| Age at diagnosis | < .0001 | < .0001 | < .0001 | .173 | ||||||
| Mean (SD) | 76 ± 6 | 77 ± 7 | 74 ± 6 | 76 ± 6 | 76 ± 6 | 76 ± 6 | ||||
| Median (Q1, Q3) | 75 (71,80) | 77 (72,82) | 73 (70,78) | 75 (71,80) | 75 (71,80) | 75 (71,80) | ||||
| Min–Max | 66–98 | 66–98 | 66–94 | 66–98 | 66–98 | 66–98 | ||||
| Sex | .8311 | .8936 | .7943 | .3605 | ||||||
| Male, n (%) | 4887 (54.7%) | 367 (54.3%) | 534 (54.9%) | 4887 (54.7%) | 343 (51.9%) | 528 (54.1%) | ||||
| Female, n (%) | 4045 (45.3%) | 309 (45.7%) | 438 (45.1%) | 4045 (45.3%) | 318 (48.1%) | 449 (45.9%) | ||||
| Race | .7403 | .475 | .7106 | ) | .6406 | |||||
| White, n (%) | 8256 (92.4%) | 622 (92%) | 888 (91.4%) | 8247 (92.3%) | 609 (92.1%) | 910 (93.2% | ||||
| Black, n (%) | 307 (3.4%) | 27 (4%) | 37 (3.8%) | 313 (3.5%) | 26 (3.9%) | 26 (2.6%) | ||||
| Other/unknown, n (%) | 369 (4.1%) | 27 (4%) | 47 (4.8%) | 375 (4.2%) | 26 (3.9%) | 41 (4.2%) | ||||
| Marital Status | .038 | < .0001 | < .0001 | .4053 | ||||||
| Married, n (%) | 5685 (63.7%) | 397 (58.7%) | 689 *70.9%) | 5717 (64%) | 404 (61.6%) | 625 (64%) | ||||
| Unmarried, n (%) | 2972 (33.3%) | 255 (37.7%) | 250 (25.7%) | 2937 (32.9%) | 236 (35.8%) | 328 (33.6%) | ||||
| Unknown, n (%) | 275 (3.1%) | 24 (3.6%) | 33 (3.4%) | 280 (3.1%) | 21 (3.1%) | 23 (2.4%) | ||||
| Elixhauser Index (3 mo to diagnosis) | .008 | .0725 | .005 | .9401 | ||||||
| 0, n (%) | 1609 (18%) | 97 (14.4%) | 204 (21%) | 1613 (18.1%) | 126 (19%) | 188 (19.2%) | ||||
| 1, n (%) | 1671 (18.7%) | 110 (16.3%) | 164 (16.9%) | 1642 (18.4%) | 114 (17.3%) | 178 (18.2%) | ||||
| 2, n (%) | 1615 (18.1%) | 122 (18.1%) | 161 (16.6%) | 1603 (17.9%) | 116 (17.5%) | 167 (17.1%) | ||||
| 3+, n (%) | 4037 (45.2%) | 347 (51.3%) | 443 (45.6%) | 4077 (45.6%) | 306 (46.2%) | 444 (45.5%) | ||||
| Tumor location | < .0001 | .0003 | < .0001 | .8114 | ||||||
| Frontal, n (%) | 2235 (25%) | 188 (27.8%) | 268 (27.6%) | 2273 (25.4%) | 159 (24%) | 266(27.3%) | ||||
| Temporal, n (%) | 2322 (26%) | 139 (20.6%) | 293 (30.1%) | 2326 (26%) | 177 (26.8%) | 268 (27.4%) | ||||
| Parietal, n (%) | 1581 (17.7%) | 94 (13.9%) | 149 (15.3%) | 1540 (17.2%) | 115 (17.3%) | 153 (15.7%) | ||||
| Occipital, n (%) | 479 (5.45%) | 23 (3.4%) | 54 (5.6%) | 469 (5.3%) | 32 (4.8%) | 53 (5.4%) | ||||
| Cerebellar, n (%) | 325 (3.6%) | 31 (4.6%) | 30 (3.1%) | 326 (3.7%) | 28 (4.2%) | 32 (3.3%) | ||||
| Multifocal, n (%) | 1990 (22.3%) | 201 (29.7%) | 178 (18.3) | 2000 (22.4%) | 152 (22.9%) | 204 (20.9%) | ||||
| Biopsy | < .0001 | < .0001 | < .0001 | .8956 | ||||||
| Yes, n (%) | 2834 (31.7%) | 313 (46.3%) | 205 (21.1%) | 2832 (31.7%) | 215 (32.5%) | 306 (31.4%) | ||||
| Surgery | < .0001 | < .0001 | < .0001 | .1533 | ||||||
| Yes, n (%) | 6084 (68.1%) | 357 (52.8%) | 778 (80%) | 6096 (68.2%) | 427 (64.6%) | 667 (68.3%) | ||||
| Radiation | < .0001 | < .0001 | < .0001 | .7683 | ||||||
| No, n (%) | 2870 (32.1%) | 411 (60.8%) | 100 (10.3%) | 2856 (32%) | 222 (33.5%) | 317 (32.4%) | ||||
| Yes, n (%) | 5839 (65.4%) | 253 (37.4%) | 859 (88.4%) | 5869 (65.7%) | 427 (64.5%) | 633 (64.8%) | ||||
| Unknown, n (%) | 223 (2.5%) | 12 (1.8%) | 13 (1.3%) | 209 (2.3%) | 13 (2%) | 27 (2.7%) | ||||
| Chemotherapy | < .0001 | < .0001 | < .0001 | |||||||
| Yes, n (%) | 554 (6.2%) | 21 (3.1%) | 100 (10.3%) | 570 (6.4%) | 41 (6.3%) | 73 (7.5%) | .3983 | |||
| MRI Brain, CT Head | .0002 | < .0001 | .0755 | .0962 | ||||||
| Yes, n (%) | 8611 (96.4%) | 667 (98.7% | 967 (99.5%) | 8652 (96.8%) | 634 (95.9%) | 935 (95.7%) |
Inverse probability of treatment weight (IPTW) technique was used to match and obtain comparable groups by accounting for bias due to confounders. Statistical significance was obtained if P value was less than or equal to .5. The bolded values are the significant (with threshold P < 0.05). Abbreviations: PC, palliative care; IPTW, inverse probability of treatment weight; SD, standard deviation; MRI, magnetic resonance imaging; CT, computed tomography.
Healthcare Utilization among Palliative Care Subgroups at End of Life
Various aspects of healthcare utilization were categorized for each PC subgroup and divided into the number of claims, encounters, and costs incurred during the last 30 days of life and the last 6 months prior to death (Table 2).
Patient Outcomes and Healthcare Utilization for Glioblastoma (GBM) Patients Who Had No Palliative Care (PC) Referral Versus Early PC Referral Versus Late PC Referral
| Outcomes, Mean (SD) | IPTW weighted | ||||||
|---|---|---|---|---|---|---|---|
| [1] No Palliative | [2] Early Palliative | [3] Late Palliative | P-value | ||||
| [2] vs [1] | [3] vs [1] | [3] vs [2] | |||||
| Healthcare use in the last 30 days | (n = 8225) | (n = 542) | (n = 977) | ||||
| count/# claims | # of ER visit | 0.33 ± 0.6 | 0.47 ± 0.66 | 0.59 ± 0.74 | < .0001 | < .0001 | .0019 |
| # of ICU admissions | 0.1 ± 0.32 | 0.18 ± 0.39 | 0.18 ± 0.45 | < .0001 | < .0001 | .9773 | |
| # of days for ICU stay | 0.46 ± 2.06 | 0.88 ± 2.71 | 0.79 ± 2.53 | .0021 | .0007 | .7024 | |
| # of outpatient visit | 0.75 ± 1.51 | 1.01 ± 1.69 | 0.79 ± 1.41 | .0014 | .3437 | .0434 | |
| # of Hospital admission | 0.43 ± 0.78 | 0.68 ± 0.93 | 0.69 ± 0.92 | < .0001 | < .0001 | .7832 | |
| # of days for LOS | 3.37 ± 6.97 | 5 ± 7.75 | 4.65 ± 7.24 | .002 | .0008 | .661 | |
| # of HHA use | 0.1 ± 0.31 | 0.1 ± 0.29 | 0.1 ± 0.31 | .8025 | .6568 | .6276 | |
| # of Hospice use | 0.98 ± 0.76 | 1 ± 0.63 | 1.06 ± 0.69 | .6377 | .008 | .2055 | |
| payment | Payment for outpatient visit | 411 ± 1327 | 656 ± 1834 | 455 ± 1257 | < .0001 | .2992 | .0035 |
| Payment for hospital admission | 5407 ± 12 194 | 8726 ± 13 814 | 8259 ± 13 793 | < .0001 | < .0001 | .4827 | |
| Payment for HHA use | 211 ± 888 | 263 ± 956 | 181 ± 777 | .1487 | .3452 | .0797 | |
| Payment for hospice use | 2691 ± 3222 | 2552 ± 3133 | 2912 ± 3143 | .3399 | .0365 | .041 | |
| Total Medicare payment | 10 267 ± 13 994 | 14 593 ± 16 225 | 13 702 ± 15 900 | < .0001 | < .0001 | .244 | |
| Healthcare use in the last 6 months | (n = 3265) | (n = 55) | (n = 617) | ||||
| count/#claims | # of ER visit | 1.37 ± 1.52 | 1.25 ± 1.54 | 1.99 ± 1.69 | .7847 | < .0001 | .0083 |
| # of ICU admissions | 0.34 ± 0.68 | 0.29 ± 0.61 | 0.51 ± 0.85 | .5669 | < .0001 | .0452 | |
| # of days for ICU stay | 1.48 ± 4.76 | 1.56 ± 6.22 | 2.12 ± 5.14 | .8495 | .0057 | .5016 | |
| # of outpatient visit | 7.8 ± 7.79 | 7.01 ± 7.36 | 9.95 ± 8.81 | .3972 | < .0001 | .0134 | |
| # of Hospital admission | 1.54 ± 1.95 | 1.27 ± 1.54 | 2.14 ± 1.99 | .3616 | < .0001 | .0072 | |
| # days for LOS stay | 18.02 ± 30.59 | 17.07 ± 28.98 | 23.02 ± 32.04 | .8508 | .0066 | .3051 | |
| # of HHA use | 0.72 ± 1.05 | 0.48 ± 0.79 | 0.82 ± 0.96 | .1118 | .0241 | .0323 | |
| # of Hospice use | 2.66 ± 2.7 | 3.12 ± 2.59 | 2.44 ± 2.21 | .1297 | .0424 | .0348 | |
| payment | Payment for outpatient visit | 6878 ± 12 464 | 9224 ± 16 020 | 11 248 ± 16 658 | .1397 | < .0001 | .3249 |
| Payment for hospital admission | 22 882 ± 35 703 | 17 552 ± 25 091 | 29 812 ± 34 823 | .3348 | < .0001 | .0565 | |
| Payment for HHA use | 2250 ± 3670 | 1096 ± 2271 | 2550 ± 3733 | .1125 | .0523 | .0641 | |
| Payment for hospice use | 10 056 ± 12 023 | 11 761 ± 13 478 | 8511 ± 10 430 | .2542 | .0052 | .0278 | |
| Total Medicare payment | 50 735 ± 41 432 | 47 215 ± 30 923 | 62 650 ± 41 081 | .5476 | < .0001 | .0201 |
The bolded values are the significant (with threshold P < 0.05). Abbreviations: GBM, glioblastoma; PC, palliative care; ER, emergency room; ICU, intensive care unit; LOS, length of stay; HHA, home health agency
When accounting for healthcare costs in the last 6 months prior to death for patients with GBM who had received PC, the late PC subgroup had significantly greater overall Medicare payments (62 650 ± 41 081) compared to patients with early PC (47 215 ± 30 923) as well as the group with no PC (50 735 ± 41 432). Likewise, in the last 6 months prior to death, the late PC subgroup had significantly greater numbers of ER visits (1.99 ± 1.69), ICU admissions (0.51 ± 0.85), hospital admissions (2.14 ± 1.99), outpatient admissions (9.95 ± 8.81), and overall days for length of stay (23.02 ± 32.04) compared to patients without PC and those who received early PC. While the late PC group had significantly fewer number of hospice claims (2.44 ± 2.21), these patients had significantly higher counts of HHA service use (0.82 ± 0.96). There were no significant differences in healthcare resource utilization between the early PC and no PC subgroups in the final six months of life.
Some of these differences between early and late PC were abrogated when examining the last month prior to death, such as numbers of ICU admissions, hospital admissions, length of stay as well as number of HHA and hospice claims. When comparing the early PC and no PC subgroups, patients who had early PC encounters also had significantly greater numbers of ER visits (0.47 ± 0.66), ICU admissions (0.18 ± 0.39), outpatient visits (1.01 ± 1.69), total hospital admissions (0.68 ± 0.93) as well as more days for ICU admission (0.88 ± 2.71) and overall length of stay (5.00 ± 7.75). These trends were reflected when comparing the late PC subgroup with patients who did not receive PC. Of note, while the differences in the number of outpatient visits (0.79 ± 1.41) and HHA claims (0.1 ± 0.31) did not reach statistical significance, patients who received late PC had significantly higher number of hospice claims (1.06 ± 0.69) compared to those without PC involvement. In addition, the total healthcare costs associated with PC (early PC: 14593 ± 16225; late PC: 13702 ± 15900) are significantly greater than for those who did not receive PC in the last month of life.
Patient Survival Among Palliative Care Subgroups
There were significant differences in the survival curves among patients (P < .0001) (Figure 2). Patients with GBM who received early PC had a mean time to death from diagnosis as 3.99 ± 4.22 months, while patients who received late PC had the longest mean time to death from diagnosis as 11.72 ± 13.20 months compared to both no and early PC subgroups (Supplementary Table 1). Those who did not receive any PC during their disease had overall mean survival time of 7.76 ± 9.23 months.
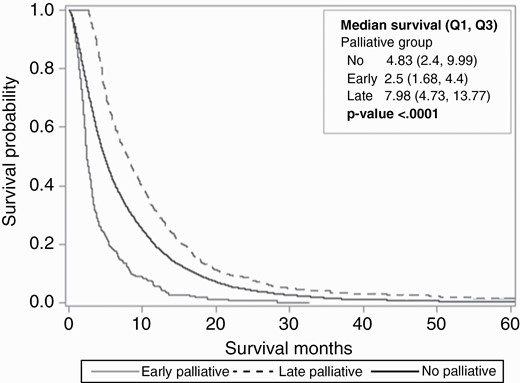
Kaplan-Meier survival curve depicting survival probability over time for glioblastoma (GBM) patients who had no palliative care (PC) referral versus early PC referral versus late PC referral. Statistical significance among all three curves was depicted by P value < .0001.
Trends in Palliative Care Utilization
From 1997 to 2015, there was an overall increase in PC use for patients with GBM with a positive trend from 2.64% in 1997 to 42.55% in 2015 (Figure 3; Supplementary Table 2). For early PC consultation, the proportion of patients meeting this criterion rose from 1.81% in 2003 to 20.63% by 2015. Likewise, the percentage of patients who received late PC also increased from 3.45% in 2003 to 21.92% in 2015 (Supplementary Table 2).
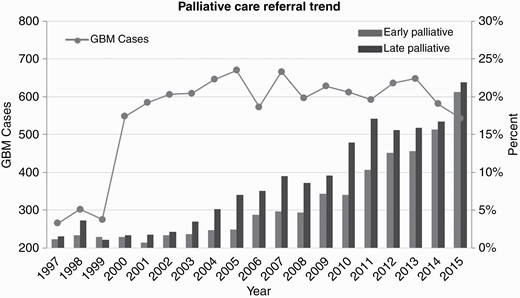
Trends in palliative care referral over time for glioblastoma (GBM) patients.
Discussion
Our retrospective study investigated early versus late PC use for 1648 adult patients with GBM from a cohort of 10 812 patients. Existing studies on PC for patients with primary brain malignancies are already rare, with those focusing on GBM even more so. A minority of GBM patients received PC consultations (34–40%) from a recent systematic review, while our cohort has a 15.24% rate of PC consultation overall.32 This study offers two unique features as it is the first study examining the landscape of PC use and effects of early versus late PC consultation as well as the first utilizing a national claims database to study PC specifically for GBM patients.
Our analysis yielded no significant differences in patient or tumor characteristics among the three subgroups (no PC, early PC, and late PC). Understanding prognosis is a key component—and benefit—of promoting timely PC implementation.33,34 We would have assumed that certain patient or disease characteristics could influence providers’ decision-making in consulting PC early or at all. Several large-scale retrospective studies and predictive models have identified various factors, such as gender, functional status, and tumor location, as significant in prognosticating GBM.35–37 However, no factor available in the national database utilized was necessarily correlated with PC use in our analysis. There were also no differences in biopsy versus surgery rates among the subgroups in the analysis after IPTW weighting. Prior to IPTW weighting, it appeared that there were statistically significant differences in surgery and biopsy rates among the groups of patients with no PC, early PC, and late PC. For example, in the cohorts undergoing unweighted analysis, the early PC group had the highest proportion of lesion biopsy (46.3%). However, although it could be likely that patients with early PC consultation may be considered to have worse clinical conditions and therefore have different treatment patterns than the other groups, it is difficult to determine the validity of such a statement due to the impact of potential confounding variables within the SEER-Medicare database without performing the IPTW technique. Furthermore, in both unweighted and weighted analyses, the use of chemotherapy was low across all groups. Noone et al. determined low sensitivity for the SEER database capturing chemotherapy administration when compared to Medicare claims.38 Furthermore, there may be discrepancies in recording intravenous versus oral chemotherapy prescriptions, and classic GBM treatment protocol is management with oral temozolomide.38
A few published studies examined differences in GBM treatments and PC intervention. Patients with brain metastases who underwent neurosurgery had significantly lower rates of PC consultation.39 Another study on patients with primary brain malignancies indicated that those who received inpatient PC were less likely to undergo treatments, including surgery.40 There was no analysis on timing of PC with regards to procedures for our study due to database limitations.
Patients with late PC consultation had the longest median survival time, whereas the early PC group had the shortest. While difficult to ascertain true contributing factors, such as metrics of poor clinical status prior to PC consultation, from the database, the survival data highlight statistically significant differences that could hint at the early PC group of patients diagnosed with GBM as considered fundamentally different by providers who initiated PC consultations. Other published literature, including randomized controlled trials as well as retrospective cohort studies, on early PC and survival time for patients with advanced cancer, showed variable results. Currently, no randomized clinical trials investigating the influence of early PC for GBM patients have yet been published, though one group designed a proposal for PC integration within 4 weeks of primary or recurrent GBM diagnosis.41 One retrospective cohort study found that patients with primary malignant brain tumor diagnoses had late hospice referral (22.5% enrolled within 7 days of death), although the results did not encompass rates of PC consultation.42 A cohort of NSCLC patients who had PC within 8 weeks of diagnosis experienced better quality of life, received aggressive end-of-life care less often, and ultimately had longer survival in a well-known randomized controlled trial.8 Early PC was also found to positively influence quality-of-life and increased reported scores across a synthesis of seven randomized control trials on patients with incurable cancers.43 However, the four studies that reported survival data did not reveal differences in efficacy. Quality-of-life was higher among patients with incurable solid tumor cancers who received PC consultation within 12 weeks of diagnosis.20 But, no significant difference in survival time between the early PC and standard oncologic care groups was identified.20
Some studies provide contradictory findings regarding PC timing and healthcare resource utilization. A large retrospective study of over 23 000 patients with advanced lung cancer determined that PC involvement resulted in lower healthcare resource utilization; however, no distinction regarding timing of consultation was made.44 Similarly, there was no significant difference found in healthcare utilization between groups of patients with early versus late PC consultation for metastatic NSCLC.45 Our study’s results are corroborated with a Swedish study on patients with various cancers, which found that those who received specialized palliative home care had significantly higher numbers of unplanned admissions (OR 4.35; 95% CI [3.22–5.91], P < .001) and unplanned re-admissions within 30 days (OR 5.8; 95% CI [4.12–8.19], P < .001).46 Another group found that early PC led to increased utilization of community-based and palliative-related resources but also resulted in higher numbers of unplanned ED visits (1.47 [95% CI 1.32–1.64]).47 Potentially, these admissions are due to worsening of the patients’ disease condition and other complications and symptoms that require acute care.
Results from healthcare cost analyses have also been variable. In our study, greater utilization of expensive services, such as ICU admissions and ER visits, was reflected by higher healthcare costs for the late PC group in the last six months of life. Temel et al.’s trial underwent cost analysis that showed no significant differences in total costs among patient groups.48 However, in general, earlier PC implementation had an overall greater cost-reducing effect for several different patient cohorts.49 One study on general long-term trends of Medicare payments demonstrated that both “aggressive”, such as ICU admissions, and “nonaggressive”, like hospice, care have increased over time.50
Early PC involvement may depend on opinions about optimal timing for PC referral, which vary greatly among both providers and patients. A focus group study involving patients with various cancers indicated that the best timing of PC implementation was not necessarily soon after diagnosis but after failure of curative treatment, disease recurrence, and other signs of progressive poor prognosis.51 While impossible to glean from a claims database, perhaps, our study’s early-PC patients were already deemed among the most likely to have poor survival by their providers, despite no significant differences in patient characteristics.
In general, there was a positive trend in PC consultation over our study period. A separate study on patients with primary brain malignancies, which include GBM, found that rates of inpatient PC also rose from 2.3% in 2007 to 11.9% in 2011.40 The rise in PC use reflects a general trend of greater adoption in cancer care.52,53 However, it is worth noting that, while historically regarded as end-of-life care, PC has been formally defined as applicable earlier in a patient’s disease course. Indeed, ASCO has issued recommendations for timely integration of PC into oncologic care, as early as within 8 weeks of diagnosis for advanced cancer.9 And, just as GBM management has also transformed over time to investigate and incorporate novel treatments, palliative and supportive care for this primary brain cancer have also changed.54,55
While some results from our study on PC use in the GBM patient population differ from other studies, GBM itself is a different disease from other advanced cancers. With short overall survival times, malignant gliomas present an especially challenging course for patients and caregivers due to early and significant functional and neurocognitive decline.56 In comparison to other oncologic patients, brain tumor patients also present to hospitals more frequently for social issues and neurological and cognitive complications.57 The European Association for Neuro-Oncology acknowledged that glioma patients were mostly referred to PC services in late stages of disease.57 Our study emphasizes the need for future studies focused on the GBM patient population.
Limitations
The retrospective nature of our study presents several limitations. First, we used Medicare claims to create our patient cohort. The SEER-Medicare database is restricted to patients age 65 or older due to Medicare claims and also limited by each hospital’s coding practices, which may affect the sensitivity and specificity of patients identified in our study. We would not be able to include patients who received PC but did not have the associated ICD codes (V66.7 or Z51.5) cited in our manuscript. Furthermore, the limitations of the database prevent additional analysis, such as subtypes of more complex PC interventions. Some studies have examined the validity of using ICD codes; ICD-9 V66.7 in particular has a sensitivity of 49.9–84% and a specificity of 98–99% for PC consultation.18,19 Selection bias is inherent to retrospective studies, although we utilized the IPTW-weighted technique to control for covariates. We were also limited by the lack of standardization of PC. Furthermore, the database does not include data related to location of death, symptoms, or any patient-reported outcomes, which are also important outcomes to consider in PC studies.8 Functional status and frailty metrics, in addition to other potentially salient information that could influence providers’ rationale regarding early PC implementation, are also missing from the database.
The strengths of our study lie in the large sampling of GBM patients from a comprehensive, well-utilized national database, which allows for investigation of PC effects on a rare but deadly cancer. Our study does not comment on causality of any factors, including PC, on patient outcomes and healthcare resource utilization. Therefore, prospective studies, such as randomized controlled trials, are required for further understanding.
Conclusions
We present the first investigation of palliative care (PC) consultation, stratified by no PC and early versus late PC timing, for adult patients with GBM. Despite an overall increase in PC consultations over time, only a minority of patients in our cohort derived from a nationwide claims database received PC despite the poor prognosis. When accounting for the last six months and the last month of life, patients with PC generally had more healthcare resource utilization, although patients with late PC involvement also had significantly greater hospice use among the subgroups. Patients with PC consultation after ten weeks from diagnosis had the longest survival times when compared to both patients with early PC and without PC integration. Prospective studies and randomized controlled trials are required to provide valuable information about the impact of PC for the unique population of patients with GBM.
Funding
A.W. is supported by an individual postdoctoral fellowship from Agency of Healthcare Research and Quality (1 F32 HS028747-01).
Data Availability
The authors will provide data upon request.
Conflict of interest statement. The authors have no conflicts to report.
Authorship statement. A.W. and S.S. conceived project idea and parameters of interest. B.U. and D.W. performed data analysis and constructed figures and tables. A.W. wrote the manuscript with support from S.S., G.H., M.B. S.S. and G.H. supervised the project. All authors discussed the results and contributed to the final manuscript.
