


Abstract
Between 2011 and 2016, O-6-methylguanine-DNA methyltransferase (MGMT) promoter methylation testing at University of California Los Angeles (UCLA) was performed through LabCorp, using a threshold of 2 to distinguish MGMT methylated from unmethylated tumors. In this study, we sought to determine whether the magnitude of the methylation score correlated with outcome.
We identified 165 newly diagnosed glioblastoma (GBM) isocitrate dehydrogenase (IDH) wild-type and temozolomide-treated upfront patients at UCLA and Kaiser Permanente Los Angeles with LabCorp-derived quantitative MGMT scores obtained on pretreatment tissue samples. Using LabCorp’s threshold, we found 102 unmethylated and 63 methylated patients. We then further substratified each group based on the magnitude of the score, and performed Kaplan-Meier and Cox regression analyses of overall survival (OS) and progression-free survival (PFS).
We validated that the standard LabCorp threshold of 2 could separate our cohort by survival, showing longer OS and PFS for MGMT methylated patients vs unmethylated patients. Cox regression analysis confirmed that MGMT (<1) patients had worse outcome, with OS and PFS hazard ratios of 2.375 (P = .053) and 2.463 (P = .023), respectively, when compared to the MGMT (1-1.99) patients. Contrary to our expectation, when we substratified the ≥2 (methylated) group, we did not find a dose-dependent relationship between the magnitude of MGMT methylation and improved survival.
The MGMT unmethylated group contains a partially methylated group (greater than 1) that shares survival benefits similar to the methylated group. However, we did not demonstrate an association of very high methylation scores with increased survival. These findings will require validation in additional independent clinical data sets.
Glioblastoma (GBM) is the most common and aggressive form of brain cancer. The standard treatment for GBM patients includes maximal resection, temozolomide (TMZ) chemotherapy with concomitant radiation (RT) followed by adjuvant TMZ.1 One of the most robust biomarkers available for GBM is O-6-methylguanine-DNA methyltransferase (MGMT) promoter methylation, a clinically obtained molecular biomarker predicting improved outcome with current standard of care.2MGMT encodes a DNA repair enzyme that can remove DNA lesions generated by TMZ-induced alkylation. Consequently, the beneficial effect of MGMT promoter methylation appears to result from epigenetic silencing of MGMT transcription and activity. MGMT promoter methylation has been previously associated with improved overall survival (OS) in GBM patients undergoing standard treatment; as a result, MGMT methylation testing is commonly recommended in a clinical setting for GBM patients.
Several testing methods for MGMT methylation are established, including those that are commercially available. Current commercial MGMT testing vendors, such as LabCorp, use quantitative methylation-specific-polymerase chain reaction with a single threshold value to distinguish MGMT methylation (PredictMDx assay). The PredictMDx assay was originally developed by the molecular diagnostics company MDxHealth (formerly known as OncoMethylome Sciences).3 In 2008, LabCorp gained the exclusive commercial license granting it access in North America.3
Because of the importance of MGMT status for predicting treatment outcome and the lack of definite evidence in determining whether quantitative reporting of MGMT methylation has predictive ramifications beyond a simple binary output (ie, methylated vs unmethylated), it remains to be determined whether additional cutoff values within methylated and unmethylated groups can be identified to better predict patients’ outcome and response to treatment. In this retrospective study, we sought to examine whether the magnitude of MGMT methylation as determined by LabCorp4 testing (versus a single stratification based on a cutoff of 2) better correlates with outcome in our GBM patients from 2011 to 2016.
Materials and Methods
Patients
We retrospectively identified 237 newly diagnosed GBM patients with LabCorp-derived quantitative MGMT scores performed on pretreatment tissue samples; patients in this cohort were enrolled between 2011 and 2016 at the University of California Los Angeles (UCLA) and Kaiser Permanente Los Angeles (KPLA). The examination and collection of patient data were approved by the UCLA Institutional Review Board; informed consent was obtained from all patients. If there were multiple scores from pretreatment tissue samples, the highest value was taken. This rule is relevant to 1 particular patient who had methylation values both of 388.10 and 97.38, each of which is from a different tissue sample harvested during the same surgery.
Eligible patients’ tissue samples were categorized as isocitrate dehydrogenase (IDH) wild-type in which patients under the age of 55 at diagnosis had IDH1 status confirmed by sequencing with some having IDH2 sequencing as well. As for patients over the age of 55, IDH1 immunohistochemistry (IHC) testing was considered sufficient based on World Health Organization criteria.5 All patients over the age of 65 at diagnosis without IDH1 testing were assumed to be wild type. Seventeen patients were excluded for having a positive IDH1 mutation and 1 patient had a positive IDH2 mutation. Three patients were excluded because of failure to meet the previously defined guidelines despite showing negative results for their IHC tests. Three more patients had not received IDH testing and were not old enough to be assumed as wild-type.
We then verified that all patients received TMZ upfront. Forty-eight patients were removed with this additional parameter: 4 who were planned to receive TMZ but were lost to follow-up, and the remainder who did not receive TMZ upfront in conjunction with other forms of treatment. Additionally, 35 of the patients who received upfront TMZ and upfront bevacizumab, which can affect progression-free survival (PFS),6,7 were excluded. The Karnofsky Performance Status (KPS) was obtained closest to the initiation of treatment. Our selection process resulted in a final cohort of 165 patients who were eligible for inclusion in this study. Of note, this group includes 5 patients who did not receive upfront RT.
Determination of Progression
Dates of progression were determined at the time of imaging by the treating neuro-oncologist, based on Response Assessment in Neuro-oncology criteria.8 If the patient was deceased less than 2 months after the last available stable scans, the date of death was recorded as the date of progression. If the patient expired more than 2 months after the last available stable scans, PFS was censored at the last available scan date. Alive patients with last stable scans before the freeze date of February 6, 2017, were censored using the last stable scan dates.
Statistical Analyses
The primary focus of this study was to evaluate patient OS and PFS. Both OS and PFS were analyzed using Kaplan-Meier analysis and Cox proportional hazard regression model in the R package. All tests were two sided with significance level assigned at P < .05.
The initial analysis was accomplished using LabCorp’s standard threshold of 2 to compare MGMT promoter methylation status. Within these methylated and unmethylated groups, tree regression was later utilized to derive thresholds for MGMT scores in the unmethylated group at a value of 1.11 and methylated group at a value of 7.705 in terms of both OS and PFS. The tree regression value of 1.11 was close to our arbitrarily chosen value of 1 to split the unmethylated group. Furthermore, we attempted to dichotomize at the median, as well as to use a bookend approach by comparing the upper third to the bottom third of the methylated group.
Results
Patient Characteristics
As described in Methods, we derived a final cohort of 165 primary GBM patients who were IDH1 wild type and received upfront TMZ. Patients who received bevacizumab at initial treatment were excluded. Patient characteristics are shown in Table 1. Despite minor variations among patients’ treatment protocol, all patients received TMZ at the start of upfront RT treatment. Five patients received only TMZ upfront without receiving RT. A total of 103 patients (62.4%) received salvage treatments postprogression. At first recurrence, 54.4% of these patients received bevacizumab, 35.0% CCNU (lomustine), 19.4% continuing with TMZ, 7.8% DCVax-L,9 4.9% Optune, 4.9% carboplatin, 3.9% nivolumab, 3.9% pembrolizumab, 1.0% etoposide, 1.0% neratinib, 1.0% vorinostat, 1.0% onartuzumab, and 1.0% ipilimumab. Ten patients were enrolled in recurrent clinical trials. In some cases, these agents were used in combination.
Patient Characteristics
| Characteristics | Current Study | |
|---|---|---|
| (n = 165) | ||
| No. of Patients | % | |
| Enrollment by site | ||
| UCLA | 162 | 98.2 |
| KPLA | 3 | 1.8 |
| Age, years | ||
| Median | 60.9 | |
| Range | 22.1-84.3 | |
| <50 | 35 | 21.2 |
| ≥50 | 130 | 78.8 |
| Gender | ||
| Male | 99 | 60.0 |
| Female | 66 | 40.0 |
| Karnofsky Performance Status | ||
| 100 | 4 | 2.4 |
| 90 | 83 | 50.3 |
| 80 | 51 | 30.9 |
| 70 | 17 | 10.3 |
| ≤60 | 10 | 6.1 |
| Extent of Surgery | ||
| Biopsy | 15 | 9.1 |
| Subtotal resection | 62 | 37.6 |
| Gross total resection | 88 | 53.3 |
| Upfront Treatment | ||
| TMZ+Radiation | 160 | 97.0 |
| TMZ | 5 | 3.0 |
| Additional upfront treatmentsa | 65 | 39.4 |
| Recurrent treatment | ||
| Progressed | 115 | 69.7 |
| Received treatment post-progression | 103 | 62.4 |
| Deaths | 86 | 52.1 |
Abbreviations: KPLA, Kaiser Permanente Los Angeles; TMZ, temozolomide; UCLA, University of California Los Angeles.
aNo patients received bevacizumab.
Histogram of MGMT Methylation Demonstrates a Wide Range of Values
A histogram of the entire initial cohort of 237 newly diagnosed primary GBM patients is shown in Fig. 1A (right). The patients have been categorized by IDH status: definite, presumed wild-type, mutant, and not determined. This cohort consisted of MGMT methylation values from 0 to 656.62, with a median of 0.39 and an average at 30.66. A total of 146 of the patients (61.6%) are considered MGMT unmethylated with values ranging from 0 to 1.99, a median of 0.035, and an average of 0.24. The remaining 91 patients (38.4%) are MGMT methylated with values ranging from 2 to 656.62, a median of 27.81, and an average of 79.46. This distribution includes 17 IDH1 mutant patients, 11 of whom are MGMT methylated patients (64.7%). These 11 patients’ MGMT values range from 2 to 656.62, with a median of 27.27, and 80.47 for average. Of the 237 initial patients, 18 patients had values greater than 100 ranging from 100.72 to 656.62.
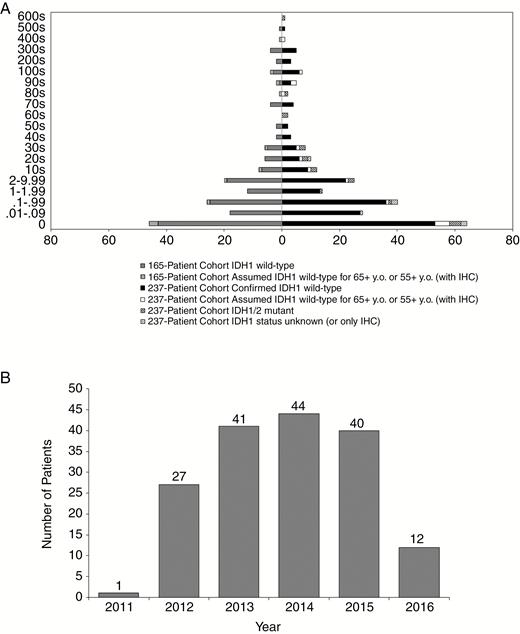
Histogram Representations of Cohort Used for Analysis.
A, Histogram representation of the entire initial cohort’s MGMT value range of 237 newly diagnosed GBM is on the right half of the histogram. The left portion of the histogram represents the MGMT methylation distribution of our final cohort of 165 patients. B, Histogram depicting the years in which the 165-patient cohort (consisting of newly diagnosed GBM patients, IDH wild-type who were temozolomide-treated without bevacizumab) was initially diagnosed as well as when MGMT status was obtained. GBM indicates glioblastoma; IDH, isocitrate dehydrogenase; IHC, immunohistochemistry; MGMT, O-6-methylguanine-DNA methyltransferase; y.o., years old.
The histogram of MGMT values of the final 165-patient cohort, consisting of IDH wild-type newly diagnosed GBM patients who had been treated with TMZ, is displayed in Fig. 1A (left). The values of MGMT methylation range from 0 to 564.52 with a median value of 0.48 and a mean of 29.26. Out of 165 patients, 102 (61.8%) were MGMT unmethylated and ranged from 0 to 1.99 with a median of 0.035, and an average of 0.26. The other 63 patients (38.2%) were MGMT methylated and ranged from 2 to 564.52, with a median of 26.72, and an average at 76.21. More than one-quarter of the values (27.9%) were determined to have a score of 0 while a total of 61.8% were within the original guidelines of MGMT unmethylated values. About 63.5% of the methylated group was between the values of 2 and 40. The majority of the patients were diagnosed between the years 2012 and 2015, with 2011 and 2016 showing the least number of patients (Fig. 1B).
Confirmation of Prognostic Value of MGMT Methylation Using the Predesignated Threshold of 2 for PFS and OS
To assess OS and PFS of our 165-patient cohort, we performed Kaplan-Meier survival analysis, which revealed a median OS of 22.6 months (95% confidence interval (CI) 19.7-32.1) and a median PFS of 10.3 months (95% CI 8.7-11.6) (Supplementary Figure 1A, B). Next, we evaluated whether the established LabCorp MGMT methylation threshold of 2 can stratify survival in our cohort. Through Kaplan-Meier analysis, MGMT methylated patients displayed a median OS of 38.8 months while unmethylated patients showed a median OS of 18.2 months (P = .008, Log-rank test; Supplementary Figure 1A). Similarly, MGMT methylated patients displayed higher median PFS of 18.0 months vs unmethylated patients with a median PFS of 8.0 months (P < .0001, Log-rank test; Supplementary Figure 1B). These results were again validated by multivariate Cox regression analysis including standard clinical variables; we found that MGMT unmethylated patients had an OS hazard ratio of 2.040 (P = .003; Supplementary Table 1) and PFS hazard ratio of 2.733 (P < .001; Supplementary Table 1) relative to methylated patients. Thus, the data confirm that the predesignated threshold of 2 could stratify our cohort.
Identification of a Partially Methylated Subset Within the MGMT Unmethylated Patients (<2) of the Cohort in Terms of PFS and OS
To investigate whether unmethylated patients (MGMT score <2) in our cohort contain unrecognized clinically relevant subgroups based on the magnitude of methylation, we attempted to substratify the unmethylated patient group. Starting with the separation of 102 unmethylated patients into 2 subgroups based on an MGMT median value of 0.035 (<0.035 vs ≥0.035) and performing Kaplan-Meier and Cox multivariate analyses, we observed no significant difference in OS or PFS between the 2 groups (Supplementary Figure 2A, B and Supplementary Table 2).
To expand our analyses, we derived a value of 1.11 for both OS and PFS after applying tree regression to fit a threshold within the unmethylated group. Kaplan-Meier analysis demonstrated a trend toward improved OS among MGMT (1.11-1.99) patients vs MGMT (<1.11) patients. Median OS for the MGMT (1.11-1.99) group was not reached; however, the MGMT (<1.11) group’s median OS was observed at 17.3 months (P = .074, Log-rank test, Fig. 2A). Median PFS was 14.5 months for MGMT (1.11-1.99) patients and 7.9 months for MGMT (<1.11) patients (P = .007, Log-rank test) (Fig. 2B). With the MGMT (1.11-1.99) group as reference, Cox regression analysis generated an OS hazard ratio of 2.509 for the MGMT (<1.11) group that also trended toward significance (P = .082; Table 2), whereas the PFS hazard ratio was 3.132 (P = .011; Table 2).
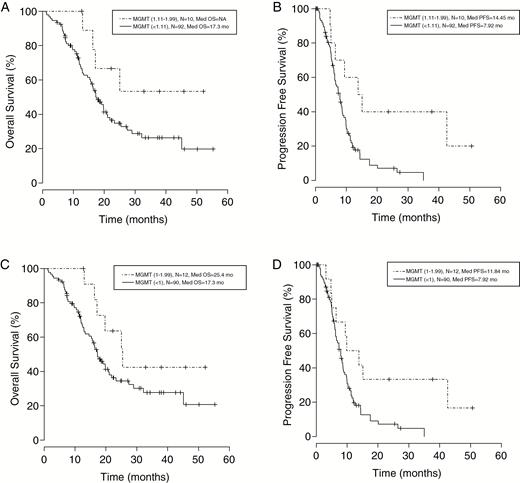
Kaplan-Meier Analysis Evaluating Overall Survival and Progression-Free Survival of Patients Using Different Thresholds as Cutoff Points.
A, The prognostic value of partially methylated vs unmethylated based on value determined through tree regression (1.11). Survival among the MGMT (1.11-1.99) group trended toward improved OS compared to the MGMT (<1.11) group. While the MGMT (1.11-1.99) group had not reached median OS, the MGMT (<1.11) group had a median OS at 17.3 months (Log-rank P = .074). B, The same value (1.11) was calculated for PFS where the median PFS was 14.5 months for MGMT (1.11-1.99) patients and 7.9 months for MGMT (<1.11) patients (Log-rank P = .007). C, The closest whole number to the tree regression value was used to split into 2 groups: (1-1.99) and (<1). Median OS was 25.4 months for the MGMT (1-1.99) group and 17.3 months for the MGMT (<1) group (Log-rank P = .112). D, Median PFS was 11.8 months for the MGMT (1-1.99) group and 7.9 months for the MGMT (<1) group (Log-rank P = .018), which are analogous to the value found using the tree regression method. MGMT indicates O-6-methylguanine-DNA methyltransferase; mo, months; NA, not available; OS, overall survival; PFS, progression-free survival.
Cox Regression Analysis of Overall Survival and Progression-Free Survival of 102 Primary Glioblastoma MGMT Unmethylated Patients With Substratification by MGMT Values
| OS MGMT (<1.11 vs 1.11-1.99) Hazard Ratio (95% CI), P Value | PFS MGMT (<1.11 vs 1.11-1.99) Hazard Ratio (95% CI), P Value | OS MGMT (<1 vs 1-1.99) Hazard Ratio (95% CI), P Value | PFS MGMT (<1 vs 1-1.99) Hazard Ratio (95% CI), P Value | |
|---|---|---|---|---|
| Age at Diagnosis | 1.021 (0.997-1.046), P = .087 | 1.016 (0.995-1.038), P = .145 | 1.026 (1.001-1.052), P = .043 | 1.017 (0.996-1.039), P = .119 |
| KPS | 1.009 (0.982-1.037), P = .510 | 0.996 (0.972-1.021), P = .749 | 1.013 (0.985-1.041), P = .372 | 0.997 (0.973-1.022), P = .835 |
| Gender Male vs female | 1.831 (1.036-3.235), P = .037 | 1.644 (0.995-2.716), P = .052 | 1.925 (1.084-3.416), P = .025 | 1.653 (0.999-2.734), P = .051 |
| Resection STR and Bx vs GTR | 0.983 (0.587-1.645), P = .948 | 1.116 (0.709-1.757), P = .635 | 0.911 (0.540-1.537), P = .727 | 1.109 (0.703-1.750), P = .657 |
| MGMT Lower vs higher | 2.509 (0.891-7.068), P = .082 | 3.132 (1.298-7.558), P = .011 | 2.375 (0.989-5.699), P = .053 | 2.463 (1.133-5.356), P = .023 |
Abbreviations: Bx, biopsy; CI, confidence interval; GTR, gross total resection; KPS, Karnofsky Performance Status; MGMT: O6-methylguanine-DNA methyltransferase; OS, overall survival; PFS, progression-free survival; STR, subtotal resection.
Next, we substratified MGMT unmethylated patients based on an arbitrarily chosen whole number value of 1, relatively close to the tree regression value of 1.11, and split them into 2 groups: MGMT (1-1.99) and MGMT (<1). This resulted in 2 patients shifting from the lower to higher group. We observed similar results using Kaplan-Meier analysis when unmethylated patients (MGMT score <2) were subdivided with a cutoff at 1. Median OS was 25.4 months for the MGMT (1-1.99) group and 17.3 months for the MGMT (<1) group (P = .112, Log-rank test; Fig. 2C). Median PFS was 11.8 months for the MGMT (1-1.99) group and 7.9 months for the MGMT (<1) group (P = .018, Log-rank test; Fig. 2D). Cox regression analysis confirmed that MGMT (<1) patients showed worse outcomes with OS and PFS hazard ratios of 2.375 (P = .053; Table 2) and 2.463 (P = .023; Table 2), respectively, when compared to the MGMT (1-1.99) patients.
No Evidence for Survival Benefit in MGMT Methylated Patients (≥2) With Extremely High Methylation Scores
To determine the correlation between magnitude of methylation and survival in the methylated group (MGMT values of ≥2), we initially substratified this group based on a median of 26.72. With Kaplan-Meier and Cox regression analyses, we did not detect any significant differences in OS or PFS among the MGMT (2-26.72) and MGMT (>26.72) groups (Supplementary Figure 3A, B and Supplementary Table 3A, B).
To examine alternate thresholds within the MGMT (≥2) group by using tree regression, we established a cutoff for MGMT values at 7.705. The cutoff was originally generated based on PFS data. The OS median of MGMT (2-7.705) patients and MGMT (>7.705) groups were 30.1 months and 46.5 months (P = .373, Log-rank test; Supplementary Figure 4A), whereas median PFS were 18.0 months and 17.4 months (P = .401, Log-rank test; Supplementary Figure 4B), respectively. Together with Kaplan-Meier results, Cox regression analysis also showed an insignificant OS hazard ratio of 1.552 (P = .337; Supplementary Table 3A) and a PFS hazard ratio of 0.784 (P = .609; Supplementary Table 3B) for MGMT (>7.705) vs MGMT (2-7.705).
In a final attempt to identify a relationship between increased methylation and survival within the methylated group, we utilized a bookend approach by taking the bottom third of MGMT values and compared them to the top third. The OS median of the lower third of the MGMT (2-14.2) group and upper third of the MGMT (39.04-564.52) group were 29.6 months and 46.5 months (P = 0.103, Log-rank test; Supplementary Figure 5A), whereas median PFS were 17.4 and 17.3 months, respectively (P = .768, Log-rank test; Supplementary Figure 5B). Similar to Kaplan-Meier results, Cox regression analysis showed a OS hazard ratio of 2.473 (P = .085; Supplementary Table 3A) and a PFS hazard ratio of 1.267 (P = .548; Supplementary Table 3B). Despite the trend in OS, the lack of PFS difference strongly suggests that the overall effect might not be relevant.
Overall, these results did not provide evidence for increased survival in methylated patients with higher MGMT values vs lower ones.
Patients Within the Partially Methylated Group (1-1.99) Have Survival Nearly Indistinguishable from Methylated Patients (≥2).
To understand the effect of partial methylation on OS and PFS, we divided our 165-patient cohort into the following groups: MGMT (<1), MGMT (1-1.99), and MGMT (≥2). Using Kaplan-Meier analysis, the MGMT (1-1.99) group showed longer OS than the MGMT (<1) group but shorter compared to the MGMT (≥2) group with median OS at 25.4 months for MGMT (1-1.99), 17.3 months for MGMT (<1), and 38.8 months for MGMT (≥2) (P = .001, Log-rank test; Fig. 3A). Consistent with OS observations, the MGMT (1-1.99) group generated higher median PFS compared to the MGMT (<1) group and lower than the MGMT (≥2) group, yielding 11.8 months vs 7.9 months and 18.0 months, respectively (P < .0001, Log-rank test; Fig. 3B). To confirm the Kaplan-Meier results, Cox regression analysis showed the trend of OS advantage for the MGMT (1-1.99) group over that of the MGMT (<1) group, with an OS hazard ratio of 0.442 (P = .064) and a highly significant difference in PFS with a hazard ratio of 0.360 (P = .008). To evaluate whether the MGMT (1-1.99) and MGMT (≥2) groups shared consistent correlation in survival, Cox regression was determined to compare the MGMT (1-1.99) group with the MGMT (≥2) group, yielding 1.031 (P = .948; Table 3) for OS hazard ratio and 1.189 (P = 0.661; Table 3) for PFS hazard ratio. The findings derived from this comparison revealed no difference in OS and PFS between the MGMT (1-1.99) and MGMT (≥2) groups, indicating that the MGMT (1-1.99) group is comparable to the MGMT (≥2) group. These results suggest that the threshold of 2 is too stringent and excludes partially methylated patients who also share improved survival with ‘methylated’ patients.
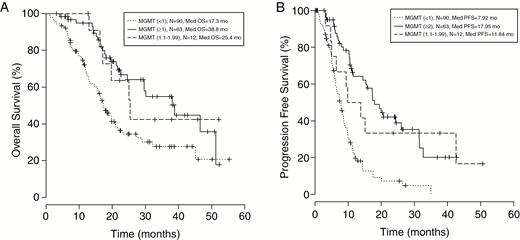
Kaplan-Meier analysis is used to A, compare the MGMT (1-1.99) vs MGMT (<1) and MGMT (≥2) patients. The MGMT (1-1.99) group’s median OS (25.4 months) falls in between the MGMT (≥2) (38.8 months) and MGMT (<1) (17.3 months) median OS values (Log-rank P = .001). B, PFS showed the same trend, namely the MGMT (1-1.99) group generated a higher median OS of 11.8 months compared to the MGMT (<1) group but lower than the MGMT (≥ 2) group, yielding 11.8 months vs 7.92 months and 18.0 months (Log-rank P < .0001), respectively. MGMT indicates O-6-methylguanine-DNA methyltransferase; mo, months; OS, overall survival; PFS, progression-free survival.
Cox Regression Analysis of Overall Survival and Progression-Free Survival of 165 Primary Glioblastoma Patients With Substratification by MGMT Values
| OS MGMT (<2 vs ≥2 vs 1.11-1.99) Hazard Ratio (95% CI), P Value | PFS MGMT(<2 vs ≥2 vs 1.11-1.99) Hazard Ratio (95% CI), P Value | OS MGMT(<2 vs ≥2 vs 1.11-1.99) Hazard Ratio (95% CI), P Value | PFS MGMT(<2 vs ≥2 vs 1.11-1.99) Hazard Ratio (95% CI), P Value | ||
|---|---|---|---|---|---|
| Age at Diagnosis | 1.020 (0.999-1.042), P = .059 | 1.020 (1.001-1.039), P = .040 | 1.020 (0.999-1.042), P = .059 | 1.020 (1.001-1.039), P = .040 | |
| KPS | 1.002 (0.979-1.024), P = .892 | 0.988 (0.969-1.008), P = .234 | 1.002 (0.979-1.024), P = .892 | 0.988 (0.969-1.008), P = .234 | |
| Gender Male vs female | 1.714 (1.069-2.746), P = .025 | 1.479 (0.991-2.206), P = .055 | 1.714 (1.069 - 2.746), P = .025 | 1.479 (0.991-2.206), P = .055 | |
| Resection STR and Bx vs GTR | 1.025 (0.657-1.599), P = .913 | 1.063 (0.729-1.549), P = .751 | 1.025 (0.657-1.599), P = .913 | 1.063 (0.729-1.549), P = .751 | |
| MGMT | ≥2 | 0.429 (0.262-0.702), P = .001 | 0.303 (0.197-0.465), P < .001 | Reference | Reference |
| <2 | Reference | Reference | 2.333 (1.424-3.822), P = .001 | 3.305 (2.151-5.077), P < .001 | |
| 1-1.99 | 0.442 (0.186-1.050), P = .064 | 0.360 (0.169-0.765), P = .008 | 1.031 (0.418-2.539), P = .948 | 1.189 (0.549-2.574), P = .661 | |
Abbreviations: Bx, biopsy; CI, confidence interval; GTR, gross total resection; KPS, Karnofsky Performance Status; MGMT: O6-methylguanine-DNA methyltransferase; OS, overall survival; PFS, progression-free survival; STR, subtotal resection.
Discussion
MGMT promoter methylation is a prognostic biomarker for GBM patients and predicts improved outcome when treated with TMZ or standard care of alkylating chemotherapy. Current commercial MGMT testing applies a single threshold to differentiate between patients categorized as methylated vs unmethylated. In our retrospectively study, we attempted to further stratify the previously established MGMT methylation cutoff, while remaining predictive of patient outcome. Moreover, we sought to investigate whether MGMT methylation score had a dose-dependent relationship with increased survival in patients receiving upfront TMZ. Of note, all included patients received RT in combination with TMZ except for 5 patients.
Our patient cohort was derived retrospectively and consisted of newly diagnosed GBM patients seen at UCLA and KPLA between 2011 and 2016 with accessible LabCorp quantitative MGMT methylation values. Because of tumor heterogeneity, careful selection of testing samples is highly crucial in determining MGMT expression and promoter methylation status.10 To avoid the possibilities of false-positive results, tissue blocks with sufficient number of viable tumor cells are required to detect MGMT methylation per protocol.10 Despite doing this, there is an inherent risk of generating dissimilar MGMT scores when using different tumor blocks of the same surgery. To validate our data, we stratified patients into MGMT methylated and unmethylated groups using LabCorp’s single threshold value of 2. As expected, the MGMT methylated group was associated with better OS and PFS than the unmethylated group. The results support our data to be representative and consistent with historical norms,2 confirming the use of an original threshold of 2 in splitting our data into 2 groups as a basic predictor of survival and prognostic in terms of OS and PFS.
As we attempted to further stratify the unmethylated category by using the median (0.035) as a cutoff, the results failed to provide any significance for OS and PFS. Tree regression was utilized to find the most significant threshold fitting our data and rendered a value of 1.11; we later rounded to 1 as the nearest whole number. Both of these thresholds reveal a stronger signal in term of PFS than OS in Kaplan-Meier and Cox regression analyses. The non-uniformity of salvage treatments is a likely explanation for stronger signals observed for PFS.
This MGMT (1-1.99) group was then compared to MGMT (≥2) and was shown to share similar survival rates as seen in the MGMT (≥2) group, suggesting that patients with a partial methylation value between the values of 1 and 1.99 have the potential for similar treatment outcomes as those originally categorized as methylated. Furthermore, we observed that any level of methylation above 2.0 to have similar OS. This suggests that once a level of methylation is reached, further improved outcome is not anticipated. For this reason, improved expected outcome is anticipated regardless of magnitude once surpassing the threshold.
Vlassenbroeck et al4 suggested the use of a ‘conservative’ threshold and also lack of a gold standard with true values for correlation. They later encountered a high uncertainty for classification in some cases (in regards to methylated vs unmethylated). This might be due to their small sample size and unavoidable contamination with normal brain tissue in their measurements. Because of this discrepancy, they proposed the use of a “gray area” that allows the designated threshold to vary depending on the clinical questions being asked. This could also be applied to our data by introducing the partially methylated group to act as this form of “gray area” for which alkylating therapies may or may not improve patients’ survival. While this limits the utilization of a clear-cut methylated vs unmethylated division, it allows a wider window for clinical decisions. As a consequence, there is a tangible need to identify additional cutoff values within methylated and unmethylated groups to better predict patient outcome and response to treatments.11 It had been previously reported that the use of TMZ on unmethylated patients could have limited potential to help a patient’s outcome.12
Our study has several limitations. While our retrospective analysis would benefit from additional patients, our institution began using a different vendor as of 2016. The use of the threshold of 1.11 within the unmethylated group was derived based on tree regression and is highly dependent on our dataset, and these results require validation in an independent dataset. In addition, OS analysis is likely to be influenced by differing salvage therapies, and PFS analysis is influenced by inclusion of 5 patients who received TMZ without RT. Lastly, the assay used by LabCorp interrogates only the MGMT target sequence on chromosome 10 between positions 131155505 and 131155619 (RefSeq, NM_002412).4 Thus, it would not be possible to compare our results to other studies in which different methods are developed to evaluate either the same or differing CpG sites.
In conclusion, our results indicated that the MGMT unmethylated group contains a partially methylated group (values between 1 and 1.99) that shares promising survival rates with the methylated group. Furthermore, we did not demonstrate an association of very high methylation scores with increased survival. These findings will require validation in additional independent clinical datasets.
Funding
This work was supported by Art of the Brain.
Conflict of interest statement. None declared.
References
Author notes
These authors contributed equally to this work.
