


Abstract
The Central Brain Tumor Registry of the United States (CBTRUS), in collaboration with the Centers for Disease Control and Prevention (CDC) and National Cancer Institute (NCI), is the largest aggregation of histopathology-specific population-based data for primary brain and other central nervous system (CNS) in the US. CBTRUS publishes an annual statistical report which provides critical reference data for the broad neuro-oncology community. Here, we summarize the key findings from the 2022 CBTRUS annual statistical report for healthcare providers.
Incidence data were obtained from the CDC’s National Program of Cancer Registries (NPCR) and NCI’s Surveillance, Epidemiology, and End Results Program for 52 central cancer registries (CCRs). Survival data were obtained from 42 NPCR CCRs. All rates are per 100 000 and age-adjusted using the 2000 US standard population. Overall median survival was estimated using Kaplan–Meier models. Survival data for selected molecularly defined histopathologies are from the National Cancer Database. Mortality data are from the National Vital Statistics System.
The average annual age-adjusted incidence rate of all primary brain and other CNS tumors was 24.25/100 000. Incidence was higher in females and non-Hispanics. The most commonly occurring malignant and predominately non-malignant tumors was glioblastoma (14% of all primary brain tumors) and meningioma (39% of all primary brain tumors), respectively. Mortality rates and overall median survival varied by age, sex, and histopathology.
This summary describes the most up-to-date population-based incidence, mortality, and survival, of primary brain and other CNS tumors in the US and aims to serve as a concise resource for neuro-oncology providers.
The Central Brain Tumor Registry of the United States (CBTRUS), in collaboration with the Centers for Disease Control and Prevention’s (CDC) National Program of Cancer Registries (NPCR), and the National Cancer Institute’s (NCI) Surveillance, Epidemiology, and End Results (SEER) Program annually publishes a comprehensive statistical report on the primary brain and other central nervous system (CNS) tumors reported in the United States.1,2 In this report we summarize, for clinical utility, the key findings of the CBTRUS 2022 annual report, focusing on the age-adjusted incidence rates for diagnosis years 2015–2019, mortality due to malignant brain and other CNS tumors for years 2015–2019, and survival rates of cases with CNS tumors for years 2001–2018.1 As found in the CBTRUS 2022 Annual Report, this report includes both malignant and non-malignant brain and other CNS tumors. CNS metastases are not included in CBTRUS reports as these tumors are not included in US cancer collection practices, although some registries collect information on CNS metastasis at time of diagnosis with other primary cancers (synchronous metastasis).3 We also summarize selected findings from the 2022 special report focused on brain and other CNS tumors in children and adolescents.4 This represents the second summary of the CBTRUS annual statistical report for clinicians and practicing healthcare providers in neuro-oncology, and the first report for clinicians to include incidence rates for selected molecularly defined brain and other CNS tumor histopathologies (tumor types) diagnosed in 2018–2019.
Materials and Methods
All studies described below were approved by the Duke University School of Medicine Institutional Review Board.
CBTRUS Data and Classification
CBTRUS is the largest population-based registry containing primary malignant and non-malignant brain and other CNS tumors, with coverage of the entire US population.1 See Ostrom et al. for an overview of data processing procedures.1 Using the combined data from 48 central cancer registries (CCRs) obtained from NPCR and four CCRs obtained from SEER, the CBTRUS analytic dataset is able to capture incidence data from 52 CCRs (50 states plus Puerto Rico and the District of Columbia, excluding incidence data from Nevada for diagnosis years 2018 and 2019 and Puerto Rico for all years). The NPCR survival analytic dataset contains data from 42 CCRs and enables CBTRUS to provide survival analyses for the years 2001–2018 (See Supplementary Table S1 for an overview of included CCRs). Overall survival for selected adult-type diffuse gliomas, pediatric-type diffuse gliomas, and molecularly profiled medulloblastomas for cases diagnosed in 2018 were estimated in a previous CBTRUS publication that used the National Cancer Database (NCDB).5
Every attempt is made to update the International Classification of Diseases for Oncology, third edition (ICD-O-3) codes and incorporate coding changes and assignments of histopathologies from updated WHO Classifications for all cancer sites.6 The 2016 World Health Organization (WHO) Classification of Tumours of the CNS (2016 WHO-CNS)1,6,7 was incorporated into cancer collection rules starting in diagnosis year 2018. Since some biomarker histopathologies shared the same codes, a variable, the Brain Molecular Marker (BMM) Site-Specific Data Item (SSDI), was created to allow for their individual identification in cancer registration data. However, this variable has not been extended to allow discernment when necessary for the collection and subsequent reporting of all histopathologies with shared ICD-O-3 codes found in the 2021 WHO-CNS.7 CBTRUS is currently working with standard setters to achieve this.6 The authors have made every effort to incorporate the 2021 WHO-CNS updates to make the report relevant to currently working clinicians while still representing the data, which were collected prior to these changes. When possible, 2016 WHO-CNS histopathologies or WHO grades are followed by 2021 WHO-CNS tumor types or WHO grade in parenthesis, (i.e., diffuse astrocytoma, IDH-mutant and astrocytoma, IDH-mutant, grade 2). Refer to Supplementary Table S2, where we have included a table comparing the CBTRUS histopathology groupings used in this report with the 2016 and 2021 WHO-CNS classifications by ICD-O-3 codes.
The neuroanatomical sites used by CBTRUS are based on ICD-O-3 topography codes.8 See Supplementary Table S3 for the CBTRUS primary site groupings. Cases were abstracted by cancer registrars using morphology/behavior ICD-O-3 coding that was likely based on the fourth edition of the WHO Classification of CNS Tumours (e.g., 2007 and 2016 WHO-CNS). As a result, the CBTRUS categorizes histopathologies (tumor types) using the largely histomorphology-based 2016 WHO-CNS (Supplementary Table S4).1,9,10 For clinical relevance, when possible, histopathologies were mapped to their corresponding 2021 WHO-CNS classification tumor types.
CBTRUS defines glioma as ICD-O-3 histopathology codes 9380-9384, and 9391-9460, including astrocytoma and glioblastoma, oligodendroglioma, and ependymoma. Statistics produced by CBTRUS for lymphomas and hematopoietic neoplasms refer only to those with brain or other CNS sites reported at the primary site. Some analyses limited to children and adolescents use histopathology (tumor type) categorization as described in the CBTRUS Childhood and Adolescent Statistical Report (see Supplementary Table S2 for a summary of this scheme).9
Terminology used to describe tumor behavior varies between standard clinical practice and cancer registration. Broadly, tumors are classified as “malignant” (corresponding roughly to WHO grades II–IV (2–4)) or “non-malignant” (including both benign and borderline tumor types, roughly corresponding to ungraded or grade I (1)). ICD-O-3 codes are used to define behavior. Malignant tumors are assigned a code of /3 for malignant, while codes /0 benign and /1 uncertain correspond to non-malignant tumors. These behaviors are assigned based on histopathology and may not coincide with clinical assessments of standard tumor behavior. The terms “malignant” and “non-malignant” are used throughout this manuscript. For some tumor types, the difference between how the histopathology is classified in cancer registration as opposed to clinical practice can be quite large. Pilocytic astrocytoma is assigned a WHO grade of I (1) and an ICD-O-3 code of/1 (corresponding to uncertain or borderline behavior). Historically, these tumors have been reported as malignant by tumor registries. In order to be consistent with other reporting groups, CBTRUS includes pilocytic astrocytoma in its pooled incidence and survival statistics for tumors with malignant behavior.11 This has the effect of increasing incidence and survival times of malignant tumors and decreasing incidence of non-malignant tumors as opposed to if pilocytic astrocytoma was classified in accordance with its clinical behavior. This effect is particularly significant in children.4,11 Pilocytic astrocytoma continues to be described as having a WHO grade 1 in the 2021 WHO-CNS.12
The changes made to grading nomenclature and criteria in the 2021 WHO-CNS fifth edition have not yet been incorporated into cancer collection practices and, therefore, are not reflected in the characterization of all tumors included in this report (2015–2019). In the 2021 WHO-CNS classification, grade is noted using Arabic numerals, but, because this classification has not been implemented in cancer registration, grade is reported by CCRs using the 2007 and 2016 WHO-CNS grading criteria and Roman numerals. As of diagnosis year 2018, cancer collection includes the new BMM SSDI, which records data on IDH status for adult-type diffuse gliomas, 1p/19q codeletion status for oligodendrogliomas, SHH-activated, and TP53-wildtype status for medulloblastomas, and embryonal tumor with multilayered rosettes, C19MC-altered.5,13,14 Using the BMM variable, we were able to provide initial epidemiology and survival estimates for histopathologies in a manner consistent with 2021 WHO-CNS (e.g., molecularly defined adult type diffuse gliomas, Table 2).
Statistics are presented by age group at diagnosis: pediatric (ages 0–14 years), adolescent and young adult (AYA, ages 15–39 years), and older adults (ages 40+ years). CBTRUS classifies race categories using the standard racial groups reported by US cancer registration (White, Black, American Indian/Alaskan Native [AIAN], and Asian/Pacific Islander [API]). Individuals categorized as “other race, unspecified” or “unknown race” are included in statistics that are not race-specific. Hispanic ethnicity is defined using the North American Association of Central Cancer Registries Hispanic Identification Algorithm, version 2, data element, which integrates a combination of cancer registry data fields (Spanish/Hispanic Origin data element, birthplace, race, and surnames) to directly and indirectly classify ethnicity as Hispanic or non-Hispanic.15
Incidence and Mortality Rates
Average annual age-adjusted incidence rates (AAAIR), average annual age-adjusted mortality rates (AAAMR), and 95% confidence intervals (95%CI) were estimated per 100 000 population based on 5-year age groups and were standardized to the 2000 US standard population.16 Population data for each geographic region were obtained from the SEER program website for the purpose of rate calculation.17
The mortality data used in this report are from the National Center for Health Statistics’ (NCHS) National Vital Statistics System (NVSS) that includes death certification data for the entire US population (all 50 states and the District of Columbia).13 These data were obtained from NVSS for malignant brain and other CNS tumors and comparison via SEER*Stat (for malignant brain tumors only, including deaths due to the following ICD-10 codes: C70-C72, C793-C794, D32-D33, D42-D43). NVSS data are not collected through the cancer registration system. Counts, rates, ratios, proportions, and other relevant statistics were calculated using R 4.1.3 statistical software18 and/or SEER*Stat 8.4.0.19 Tables and figures were created in R using the following packages: flextable, officer, orca, plotly, SEER2R, survminer, and tidyverse.20–27 According to the CBTRUS agreement with NPCR, rates are suppressed when counts are fewer than 16 within a cell but included in totals, except when data are suppressed from only one cell, to prevent identification of the number in the suppressed cell.
Calculation of Relative and Median Overall Survival
Survival calculations were measured using relative survival (RS) rates and median overall survival time. SEER*Stat was used to estimate 1-, 5-, and 10-year RS for primary malignant and non-malignant brain and other CNS tumor cases. Median survival times were calculated using the Kaplan–Meier method for all malignant CNS tumors diagnosed between 2004 and 2018 in R. Second or later primary tumors, cases diagnosed at autopsy, cases in which race or sex is coded as “other” or “unknown,” and cases known to be alive but for whom follow-up time could not be calculated, were excluded from all survival data analyses.
Estimation of Incidence Time Trends
Time trends allows for the assessment of changes to cancer incidence or mortality over time. Joinpoint 4.10.0.0 was used to estimate incidence time trends and generate annual percentage changes (APC) and 95% CI. To know more about how this method estimates trends, please see the CBTRUS Statistical Report, 2022.1 APC was considered statistically significant at alpha 0.05.
Results and Discussion
Overall Epidemiology of Primary Brain and Other CNS Tumors in the United States
In the United States between 2015 and 2019, there were 89 158 new cases of primary brain and other CNS tumors per year, of which non-malignant tumors represented 63 889 cases per year, and malignant tumors represented 25 269 cases per year (Table 1). The incidence of non-malignant brain tumors was higher in females compared to males, while the incidence of malignant brain tumors was higher in males compared to females. White people, more commonly, had malignant brain tumors compared to other races, while Black people, more commonly, had non-malignant brain tumors compared to other races. The incidence of non-malignant brain tumors was higher in non-Hispanic persons than Hispanic persons. The incidence of malignant and non-malignant brain tumors overall increased with age.
Annual average totala, average annual age-adjusted incidence rates,b average annual age-adjusted mortality ratesb, and 5-year relative survival with 95% confidence intervals for all primary brain and other CNS tumors by behavior, sex, age group at diagnosis, race, and Hispanic ethnicity (CBTRUS: Data provided by CDC’s NPCR and NCI’s SEER Program, 2015–2019; NCHS’s NVSS Program, 2015–2019; CDC’s NPCR, 2001–2018, varying)
| Characteristic | Incidence (new diagnoses) | Mortality (deaths) | 5-year relative survival (RS) | |||||||
|---|---|---|---|---|---|---|---|---|---|---|
| Total | Malignantc,d | Non-malignante | Malignant onlyf | Malignantc,d | Non-malignantg | |||||
| Annual average cases | Incidence rate (95% CI) | Annual average cases | Incidence rate (95% CI) | Annual average cases | Incidence rate (95% CI) | Annual average deaths | Mortality rate (95% CI) | RS (95% CI) | RS (95% CI) | |
| Total | 89 158 | 24.71 (24.63–24.78) | 25 269 | 7.02 (6.98–7.06) | 63 889 | 17.69 (17.62–17.75) | 16 853 | 4.41 (4.38–4.44) | 35.9 (35.7–36.1) | 91.8 (91.7–91.9) |
| Sex | ||||||||||
| Male | 36 834 | 21.60 (21.50–21.70) | 14 092 | 8.24 (8.18–8.30) | 22 742 | 13.36 (13.28–13.44) | 9510 | 5.38 (5.33–5.43) | 34.9 (34.6–35.2) | 91.0 (90.9–91.2) |
| Female | 52 325 | 27.62 (27.51–27.73) | 11 177 | 5.94 (5.89–5.99) | 41 148 | 21.68 (21.58–21.78) | 7343 | 3.58 (3.54–3.61) | 37.1 (36.8–37.4) | 92.2 (92.1–92.3) |
| Race | ||||||||||
| White | 72 248 | 24.65 (24.56–24.73) | 21 937 | 7.51 (7.47–7.56) | 50 311 | 17.13 (17.06–17.20) | 15 188 | 4.82 (4.78–4.85) | 34.5 (34.3–34.8) | 91.9 (91.7–92.0) |
| Black | 10 741 | 25.18 (24.96–25.40) | 1952 | 4.43 (4.34–4.52) | 8789 | 20.75 (20.55–20.95) | 1141 | 2.66 (2.59–2.73) | 42.3 (41.6–43.1) | 90.0 (89.7–90.3) |
| American Indian/Alaska Native | 607 | 15.15 (14.59–15.72) | 151 | 3.63 (3.36–3.91) | 456 | 11.52 (11.03–12.03) | 68 | 1.74 (1.55–1.95) | 46.7 (43.8–49.5) | 94.8 (93.6–95.8) |
| Asian or Pacific Islander | 3249 | 15.86 (15.61–16.11) | 680 | 3.34 (3.23–3.46) | 2570 | 12.51 (12.29–12.74) | 456 | 2.26 (2.16–2.35) | 46.5 (45.3–47.7) | 93.0 (92.5–93.4) |
| Hispanic ethnicity | ||||||||||
| Non-Hispanic | 78 602 | 25.09 (25.01–25.17) | 22 481 | 7.25 (7.21–7.30) | 56 121 | 17.84 (17.77–17.90) | 15 529 | 4.59 (4.56–4.62) | 34.3 (34.1–34.5) | 91.6 (91.5–91.7) |
| Hispanic | 10 556 | 22.95 (22.74–23.16) | 2788 | 5.85 (5.75–5.96) | 7768 | 17.09 (16.92–17.27) | 1299 | 3.08 (3.00–3.16) | 49.0 (48.3–49.6) | 93.6 (93.3–93.8) |
| Age group | ||||||||||
| 0–14 | 3512 | 5.79 (5.70–5.88) | 2312 | 3.81 (3.74–3.88) | 1200 | 1.98 (1.93–2.03) | 417 | 0.69 (0.66–0.72) | 75.8 (75.3–76.3) | 97.6 (97.3–97.8) |
| 15–39 | 12 762 | 11.96 (11.87–12.06) | 3487 | 3.25 (3.20–3.29) | 9275 | 8.72 (8.64–8.80) | 1017 | 0.97 (0.94–0.99) | 72.6 (72.1–73.0) | 98.3 (98.2–98.4) |
| 40–64 | 34 737 | 31.27 (31.12–31.42) | 9078 | 7.92 (7.85–8.00) | 25 659 | 23.35 (23.21–23.48) | 6282 | 5.25 (5.19–5.31) | 29.8 (29.5–30.1) | 95.5 (95.4–95.6) |
| 65+ | 38 147 | 76.85 (76.50–77.20) | 10 392 | 20.91 (20.73–21.09) | 27 755 | 55.94 (55.64–56.24) | 9136 | 18.39 (18.22–18.56) | 10.5 (10.3–10.8) | 84.2 (84.0–84.5) |
aAnnual average cases are calculated by dividing the 5-year total by five.
bRates are per 100 000 and are age-adjusted to the 2000 US standard population.
cAssigned behavior code of /3.
dIncludes pilocytic astrocytoma.
eAssigned behavior code of /0 or /1.
fIncludes the following ICD-10 codes: C70-C72, C79.3-C79.4, D32-33, and D42-D43.
gSurvival estimates based on diagnosis years 2004–2018 only.
Abbreviations: CBTRUS: Central Brain Tumor Registry of the United States; CNS: Central Nervous System; NCHS: National Center for Health Statistics; NPCR: National Program of Cancer Registries; NVSS: National Vital Statistics System; RS: relative survival; SEER: Surveillance, Epidemiology, and End Results.
Between 2015 and 2019, there were 16 853 deaths per year on average due to malignant brain tumors (Table 1). The mortality rate was higher in males than females. With respect to race, White persons had the highest mortality rate, while AIAN persons had the lowest mortality rate. The mortality rate was higher in non-Hispanic persons than Hispanic persons. Increased mortality was also associated with increasing age.
Incidence of Brain and Other CNS Tumors in Pediatric and AYA Populations
There were 3512 brain and CNS tumors diagnosed in children ages 0–14 years and 12 762 diagnosed in AYA ages 15–39 years, in contrast to 34 737 and 38 147 brain and CNS tumors diagnosed in adults ages 40–64 years and older adults ages 65+ years, respectively (Table 1). When assessed as a proportion of all new cancer diagnoses, however, brain and CNS tumors represented a larger percentage in children ages 0–14 years (30%) compared to adults ages 40+ years, where brain and CNS tumors only represented 4% of all cancer diagnoses (Figure 1B).
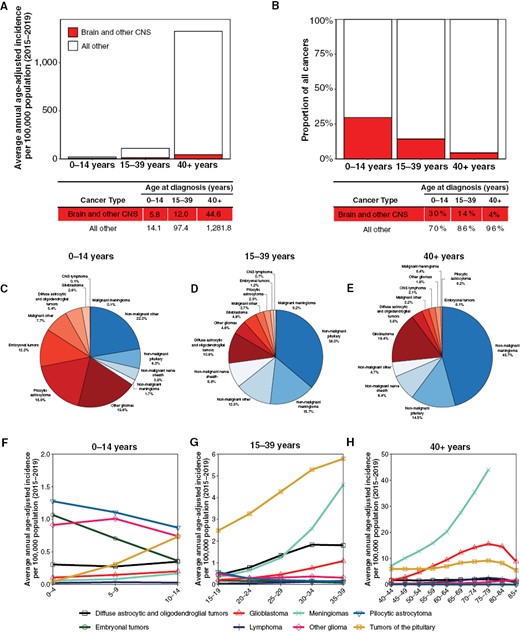
(A) Average annual age-adjusted incidence of brain and other CNS tumors and all other cancers by age group at diagnosis, (B) proportion of total cancers occurring in brain and other CNS by age group at diagnosis; distribution of all primary brain and other CNS tumors by behavior for (C) children ages 0–14 years, (D) adolescents and young adults ages 15–39 years, and (E) adults ages 40 + years; age-adjusted incidence rates of brain and other CNS tumors by selected histopathologies (tumor types) within age group at diagnosis for (F) children ages 0–14 years, (G) adolescents and young adults ages 15–39 years, and (H) adults ages 40 + years. (Data from CBTRUS Annual Statistical Report: US Cancer Statistics—NPCR and SEER, 2015–2019).
From 2014 to 2018, brain and other CNS tumors were the most common type of tumor in children and adolescents 5–19 years (Figure 2A–2D). They were also the most common tumor type among infants <1 year, but leukemia occurred more frequently among children 1–4 years.4 As compared to other malignancies in children that have decreased in incidence over time, there have been no substantial changes in the incidence of these tumors in children and adolescents (Figure 2E–2H).

Average annual age-specific incidence rates with 95% confidence intervals and average annual cases for all primary brain andother CNS tumors in children ages A) 0–4 years, B) 5–9 years, C) 10–14 years, and D) 15–19 years (Data from CBTRUS Childhood and Adolescent Report: US Cancer Statistics—NPCR and SEER, 2014–2018, and the annual age-specific incidence rates and annual percent change (APC) with 95% confidence intervals of selected primary malignant and non-malignant brain and other CNS tumors and incidence trends by the five most common histopathologies (tumor types) by age group in children ages E) 0–4 years, F) 5–9 years, G) 10–14 years, and H) 15–19 years (Data from CBTRUS Childhood and Adolescent Report: US Cancer Statistics—NPCR and SEER, 2004–2018.)
The most commonly diagnosed tumor types in children were other gliomas (19.6%), pilocytic astrocytoma (18.0%), and embryonal tumors (12.2%) with the majority being malignant (Figure 1C). In AYA, the most commonly diagnosed tumor types included tumors of the pituitary (36.0%) and meningioma (15.7%). Meningioma (45.7%), tumors of the pituitary (14.5%), and cranial and paraspinal nerve tumors (8.4%) were the most common diagnoses in adults older than 40 years (Figure 1D–1E). In children, more tumors tended to be malignant. In contrast, the majority of tumors diagnosed in older age groups tended to be non-malignant.
Epidemiology of Gliomas
Gliomas are a heterogenous group of histopathologies that make up the majority of malignant primary brain tumors. Classification of these tumors have change substantially with recent revisions to the WHO-CNS. Cases used in generating this report were diagnosed from 2015–2019 and as a result were largely diagnosed using 2016 WHO-CNS criteria. Under this classification scheme, diffuse astrocytic and oligodendrogliomas include glioblastoma (glioblastoma, IDH-wildtype and astrocytoma, IDH-mutant, WHO-CNS grade IV (4)); diffuse and anaplastic astrocytoma (astrocytoma, IDH-mutant, WHO-CNS grades II–III (2–3)); and oligodendroglial tumors (oligodendroglioma, IDH-mutant and 1p/19q-codeleted WHO grades II–III (2–3)). However, because molecular data were not collected until diagnosis year 2018, CBTRUS analyses continue to use the histopathologic classifications and grading criteria in place at the time of diagnosis (i.e., 2007 and 2016 WHO-CNS; Supplementary Table S2). We provide additional analyses for cases diagnosed in 2018 and 2019 only which use molecularly defined tumor types.
Infiltrating Astrocytomas and Oligodendrogliomas
Based on the 2016 WHO-CNS criteria, between 2015 and 2019 for diffuse astrocytoma (grade II (2)), anaplastic astrocytoma (grade III (4)), and glioblastoma (grade IV (4)), there were 896, 1382, and 12 652 newly diagnosed cases per year on average, respectively (Table 2). All glioma histopathologies (tumor types) had a male predominance and were more common in White persons compared to other races. Incidence tended to increase with age as tumor grade increased, as seen with glioblastoma, a high-grade tumor, which was more common in older adults (Table 2).
Annual average total casesa and average annual age-adjusted incidence ratesb with 95% confidence intervals for selected histopathologies (tumor types) for brain and other central nervous system tumors by grade, sex, age group at diagnosis, race, and hispanic ethnicity. (CBTRUS: Data provided by CDC’s NPCR and NCI’s SEER Program, 2015–2019)
| Histopathology (tumor type) | Total | Sex | Age at diagnosis | |||||||||
|---|---|---|---|---|---|---|---|---|---|---|---|---|
| Male | Female | 0–14 years | 15–39 years | 40+ Years | ||||||||
| Annual average | AAAIR (95% CI) | Annual average | AAAIR (95% CI) | Annual average | AAAIR (95% CI) | Annual average | AAAIR (95% CI) | Annual average | AAAIR 95% CI) | Annual average | AAAIR (95% CI) | |
| All gliomasc | 21 362 | 5.94 (5.91–5.98) | 12 104 | 7.05 (6.99–7.10) | 9258 | 4.97 (4.92–5.02) | 1795 | 2.96 (2.90–3.02) | 3170 | 2.95 (2.91–3.00) | 16 397 | 9.90 (9.83–9.97) |
| Glioblastoma | 12 652 | 3.26 (3.24–3.29) | 7365 | 4.08 (4.04–4.12) | 5286 | 2.55 (2.52–2.59) | 93 | 0.15 (0.14–0.17) | 608 | 0.58 (0.56–0.60) | 11 951 | 7.03 (6.97–7.09) |
| Diffuse and anaplastic astrocytoma | 2936 | 0.87 (0.85–0.88) | 1623 | 0.98 (0.96–1.01) | 1313 | 0.75 (0.74–0.77) | 170 | 0.28 (0.26–0.30) | 932 | 0.86 (0.83–0.88) | 1834 | 1.16 (1.14–1.19) |
| WHO grade II(2)d | 896 | 0.28 (0.27–0.28) | 510 | 0.32 (0.31–0.33) | 386 | 0.23 (0.22–0.25) | 49 | 0.08 (0.07–0.09) | 388 | 0.36 (0.34–0.37) | 459 | 0.30 (0.29–0.32) |
| WHO grade III(3)d | 1382 | 0.40 (0.39–0.41) | 764 | 0.46 (0.44–0.47) | 618 | 0.35 (0.33–0.36) | 38 | 0.06 (0.05–0.07) | 406 | 0.37 (0.36–0.39) | 939 | 0.59 (0.57–0.61) |
Oligodendroglial tumorse | 1112 | 0.34 (0.33–0.35) | 615 | 0.39 (0.37–0.40) | 497 | 0.30 (0.29–0.31) | 15 | 0.02 (0.02–0.03) | 389 | 0.37 (0.35–0.38) | 708 | 0.48 (0.47–0.50) |
| WHO grade II(2)d | 608 | 0.19 (0.19–0.20) | 333 | 0.21 (0.20–0.22) | 276 | 0.17 (0.16–0.18) | 7 | 0.01 (0.01–0.02) | 244 | 0.23 (0.22–0.24) | 357 | 0.25 (0.24–0.27) |
| WHO grade III(3)d | 369 | 0.11 (0.11–0.12) | 204 | 0.13 (0.12–0.13) | 164 | 0.10 (0.09–0.10) | — | — | 104 | 0.10 (0.09–0.11) | 263 | 0.18 (0.17–0.19) |
| Pilocytic astrocytoma | 1068 | 0.36 (0.35–0.37) | 561 | 0.38 (0.36–0.39) | 507 | 0.35 (0.34–0.36) | 657 | 1.08 (1.04–1.12) | 293 | 0.27 (0.26–0.28) | 119 | 0.08 (0.07–0.09) |
| Molecularly-defined adult-type diffuse gliomaf | 12 674 | 3.34 (3.30–3.38) | 7400 | 4.11 (4.04–4.18) | 5273 | 2.66 (2.60–2.71) | 136 | 0.23 (0.20–0.26) | 1643 | 1.53 (1.47–1.58) | 10 894 | 6.39 (6.31–6.48) |
| Astrocytoma, IDH-mutant | 1421 | 0.44 (0.43–0.46) | 814 | 0.51 (0.49–0.54) | 608 | 0.38 (0.35–0.40) | 33 | 0.05 (0.04–0.07) | 740 | 0.68 (0.64–0.71) | 648 | 0.45 (0.42–0.47) |
| WHO grade II(2) d | 422 | 0.14 (0.13–0.15) | 248 | 0.16 (0.15–0.17) | 175 | 0.11 (0.10–0.13) | 8 | 0.01 (0.01–0.02) | 265 | 0.24 (0.22–0.26) | 149 | 0.11 (0.10–0.12) |
| WHO grade III(3) d | 474 | 0.15 (0.14–0.16) | 270 | 0.17 (0.16–0.19) | 203 | 0.13 (0.12–0.14) | 8 | 0.01 (0.01–0.02) | 265 | 0.24 (0.22–0.26) | 200 | 0.14 (0.13–0.16) |
| WHO grade IV(4) d | 282 | 0.09 (0.08–0.09) | 163 | 0.10 (0.09–0.11) | 120 | 0.07 (0.06–0.08) | — | — | 118 | 0.11 (0.10–0.13) | 162 | 0.11 (0.09–0.12) |
| Astrocytoma, IDH-wildtype (glioblastoma, IDH-wildtype) | 10 312 | 2.61 (2.57–2.64) | 6070 | 3.27 (3.21–3.33) | 4243 | 2.02 (1.98–2.07) | 96 | 0.16 (0.14–0.18) | 562 | 0.53 (0.50–0.56) | 9654 | 5.54 (5.46–5.62) |
| WHO grade II(2) d | 197 | 0.06 (0.05–0.06) | 106 | 0.06 (0.05–0.07) | 92 | 0.05 (0.04–0.06) | 17 | 0.03 (0.02–0.04) | 46 | 0.04 (0.03–0.05) | 134 | 0.08 (0.07–0.09) |
| WHO grade III(3) d | 381 | 0.10 (0.10–0.11) | 206 | 0.12 (0.11–0.13) | 176 | 0.09 (0.08–0.10) | 10 | 0.02 (0.01–0.02) | 64 | 0.06 (0.05–0.07) | 307 | 0.18 (0.17–0.20) |
| WHO grade IV(4) d | 7386 | 1.85 (1.82–1.88) | 4416 | 2.36 (2.31–2.41) | 2970 | 1.40 (1.37–1.44) | 44 | 0.07 (0.06–0.09) | 334 | 0.32 (0.29–0.34) | 7009 | 4.01 (3.94–4.08) |
| Oligodendroglioma, IDH-mutant and 1p/19q-codeleted | 940 | 0.29 (0.28–0.31) | 518 | 0.33 (0.31–0.35) | 422 | 0.26 (0.24–0.28) | — | — | 342 | 0.32 (0.30–0.35) | 591 | 0.41 (0.38–0.43) |
| WHO grade II(2) d | 470 | 0.15 (0.14–0.16) | 257 | 0.17 (0.15–0.18) | 213 | 0.13 (0.12–0.15) | — | — | 199 | 0.19 (0.17–0.20) | 265 | 0.19 (0.17–0.21) |
| WHO grade III(3) d | 320 | 0.10 (0.09–0.10) | 180 | 0.11 (0.10–0.12) | 140 | 0.08 (0.07–0.09) | — | — | 100 | 0.09 (0.08–0.11) | 220 | 0.15 (0.13–0.16) |
| Ependymal tumors | 1382 | 0.42 (0.41–0.43) | 793 | 0.49 (0.47–0.50) | 589 | 0.35 (0.34–0.37) | 185 | 0.30 (0.28–0.32) | 385 | 0.36 (0.34–0.38) | 812 | 0.53 (0.51–0.54) |
| Spinal ependymomag | 654 | 0.20 (0.19–0.21) | 352 | 0.22 (0.21–0.23) | 302 | 0.18 (0.17–0.19) | 28 | 0.05 (0.04–0.05) | 226 | 0.21 (0.20–0.22) | 400 | 0.26 (0.25–0.28) |
| Supratentorial ependymomah | 112 | 0.04 (0.03–0.04) | 57 | 0.04 (0.03–0.04) | 55 | 0.03 (0.03–0.04) | 36 | 0.06 (0.05–0.07) | 30 | 0.03 (0.02–0.03) | 45 | 0.03 (0.03–0.03) |
| Infratentorial (posterior fossa) ependymomai | 468 | 0.14 (0.13–0.15) | 295 | 0.18 (0.17–0.19) | 173 | 0.10 (0.10–0.11) | 78 | 0.13 (0.12–0.14) | 96 | 0.09 (0.08–0.10) | 294 | 0.19 (0.18–0.20) |
| Diffuse midline glioma, H3 K27M-mutantf | 166 | 0.06 (0.05–0.06) | 75 | 0.05 (0.04–0.06) | 90 | 0.06 (0.05–0.07) | 84 | 0.14 (0.12–0.16) | 53 | 0.05 (0.04–0.06) | 29 | 0.02 (0.02–0.03) |
| High-grade glioma of the brainstemj | 547 | 0.18 (0.17–0.18) | 278 | 0.18 (0.17–0.19) | 269 | 0.18 (0.17–0.19) | 232 | 0.38 (0.36–0.41) | 141 | 0.13 (0.12–0.14) | 173 | 0.11 (0.10–0.12) |
| Meningiomas | 35 689 | 9.51 (9.46–9.55) | 9667 | 5.64 (5.59–5.69) | 26 022 | 12.95 (12.87–13.02) | 64 | 0.10 (0.09–0.12) | 2025 | 1.97 (1.93–2.01) | 33 600 | 20.41 (20.31–20.51) |
| WHO grade I(1) d | 11 934 | 3.22 (3.20–3.25) | 3224 | 1.85 (1.82–1.88) | 8710 | 4.49 (4.44–4.53) | 22 | 0.04 (0.03–0.04) | 915 | 0.90 (0.87–0.92) | 10 997 | 6.73 (6.67–6.79) |
| WHO grade II(2) d | 1975 | 0.54 (0.53–0.55) | 827 | 0.47 (0.46–0.49) | 1148 | 0.61 (0.59–0.62) | 16 | 0.03 (0.02–0.03) | 216 | 0.21 (0.19–0.22) | 1743 | 1.07 (1.05–1.09) |
| WHO grade III(3) d | 165 | 0.04 (0.04–0.05) | 84 | 0.05 (0.04–0.05) | 81 | 0.04 (0.04–0.05) | — | — | 13 | 0.01 (0.01–0.02) | 150 | 0.09 (0.08–0.10) |
| CNS lymphoma | 1696 | 0.45 (0.44–0.46) | 866 | 0.49 (0.48–0.51) | 831 | 0.41 (0.39–0.42) | 18 | 0.03 (0.02–0.04) | 106 | 0.10 (0.09–0.11) | 1572 | 0.94 (0.92–0.96) |
| Embryonal tumors | 634 | 0.22 (0.21–0.22) | 382 | 0.26 (0.25–0.27) | 252 | 0.18 (0.17–0.19) | 429 | 0.71 (0.68–0.74) | 151 | 0.14 (0.13–0.15) | 54 | 0.04 (0.03–0.04) |
| Medulloblastomak | 450 | 0.15 (0.15–0.16) | 287 | 0.19 (0.18–0.20) | 163 | 0.11 (0.11–0.12) | 293 | 0.48 (0.46–0.51) | 127 | 0.11 (0.11–0.12) | 31 | 0.02 (0.02–0.03) |
| SHH-activated and TP53-wildtype f | 80 | 0.03 (0.02–0.03) | 52 | 0.03 (0.03–0.04) | 29 | 0.02 (0.01–0.03) | 36 | 0.06 (0.05–0.08) | 38 | 0.03 (0.03–0.04) | — | — |
| SHH-activated and TP53-mutant f | — | — | — | — | — | — | — | — | — | — | — | — |
| WNT-activatedf | 14 | 0.01 (0.00–0.01) | — | — | 10 | 0.01 (0.00–0.01) | 12 | 0.02 (0.01–0.03) | — | — | — | — |
| Non-WNT/non-SHHf | 67 | 0.02 (0.02–0.03) | 44 | 0.03 (0.02–0.04) | 22 | 0.02 (0.01–0.02) | 55 | 0.09 (0.08–0.11) | 10 | 0.01 (0.01–0.01) | — | — |
| AT/RTl | 82 | 0.03 (0.03–0.03) | 42 | 0.03 (0.02–0.03) | 41 | 0.03 (0.02–0.03) | 73 | 0.12 (0.11–0.13) | 6 | 0.01 (0.00–0.01) | 3 | 0.00 (0.00–0.00) |
| Germ cell tumors | 256 | 0.09 (0.08–0.09) | 188 | 0.12 (0.12–0.13) | 68 | 0.05 (0.04–0.05) | 116 | 0.19 (0.18–0.21) | 125 | 0.11 (0.10–0.12) | 15 | 0.01 (0.01–0.01) |
| Cranial and paraspinal nerve tumors | 7403 | 2.05 (2.03–2.07) | 3553 | 2.05 (2.02–2.08) | 3850 | 2.06 (2.03–2.09) | 137 | 0.23 (0.21–0.24) | 1102 | 1.04 (1.02–1.07) | 6164 | 3.79 (3.74–3.83) |
| Tumors of the pituitary | 15 373 | 4.50 (4.47–4.53) | 6796 | 3.98 (3.94–4.03) | 8576 | 5.10 (5.05–5.15) | 223 | 0.37 (0.35–0.39) | 4596 | 4.26 (4.21–4.32) | 10 554 | 6.75 (6.69–6.81) |
| Histopathology (tumor type) | Race | Hispanic Ethnicity | ||||||||||
| White | Black | AIAN | API | Non-Hispanic | Hispanic | |||||||
| Annual average | AAAIR (95% CI) | Annual average | AAAIR (95% CI) | Annual average | AAAIR (95% CI) | Annual average | AAAIR (95% CI) | Annual average | AAAIR (95% CI) | Annual average | AAAIR (95% CI) | |
| All gliomasc | 18 735 | 6.45 (6.40–6.49) | 1569 | 3.53 (3.45–3.61) | 125 | 2.92 (2.69–3.17) | 481 | 2.33 (2.24–2.43) | 19 130 | 6.20 (6.16–6.24) | 2232 | 4.63 (4.54–4.72) |
| Glioblastoma | 11 354 | 3.55 (3.52–3.58) | 796 | 1.82 (1.76–1.88) | 59 | 1.50 (1.33–1.70) | 248 | 1.20 (1.13–1.27) | 11 566 | 3.36 (3.33–3.39) | 1086 | 2.59 (2.52–2.66) |
| Diffuse and anaplastic astrocytoma | 2565 | 0.95 (0.94–0.97) | 211 | 0.47 (0.45–0.50) | 17 | 0.37 (0.29–0.46) | 77 | 0.36 (0.33–0.40) | 2623 | 0.92 (0.91–0.94) | 313 | 0.60 (0.57–0.63) |
| WHO grade II(2) d | 775 | 0.31 (0.30–0.32) | 67 | 0.15 (0.13–0.17) | 5 | 0.11 (0.07–0.16) | 25 | 0.12 (0.10–0.14) | 794 | 0.30 (0.29–0.31) | 102 | 0.19 (0.17–0.21) |
| WHO grade III(3) d | 1224 | 0.45 (0.43–0.46) | 91 | 0.21 (0.19–0.23) | 7 | 0.17 (0.12–0.24) | 33 | 0.15 (0.13–0.18) | 1245 | 0.43 (0.41–0.44) | 137 | 0.26 (0.24–0.28) |
| Oligodendroglial tumorse | 975 | 0.39 (0.37–0.40) | 62 | 0.14 (0.13–0.16) | 12 | 0.27 (0.20–0.35) | 31 | 0.14 (0.12–0.17) | 965 | 0.36 (0.35–0.37) | 146 | 0.27 (0.25–0.30) |
| WHO grade II(2) d | 538 | 0.22 (0.21–0.23) | 32 | 0.07 (0.06–0.09) | 7 | 0.16 (0.12–0.23) | 15 | 0.07 (0.05–0.08) | 529 | 0.20 (0.20–0.21) | 79 | 0.15 (0.13–0.16) |
| WHO grade III(3) d | 326 | 0.12 (0.12–0.13) | 19 | 0.04 (0.04–0.05) | — | — | 12 | 0.06 (0.04–0.07) | 321 | 0.11 (0.11–0.12) | 48 | 0.09 (0.08–0.11) |
| Pilocytic astrocytoma | 854 | 0.38 (0.37–0.40) | 132 | 0.28 (0.26–0.30) | 10 | 0.19 (0.14–0.25) | 26 | 0.14 (0.11–0.16) | 899 | 0.40 (0.39–0.41) | 169 | 0.25 (0.23–0.26) |
| Molecularly defined adult-type diffuse glioma f | 11 278 | 3.67 (3.62–3.72) | 804 | 1.79 (1.70–1.88) | 74 | 1.72 (1.45–2.03) | 266 | 1.20 (1.10–1.31) | 11 513 | 3.50 (3.45–3.55) | 1160 | 2.44 (2.34–2.55) |
| Astrocytoma, IDH-mutant | 1250 | 0.51 (0.49–0.53) | 96 | 0.21 (0.18–0.25) | — | — | 30 | 0.13 (0.10–0.17) | 1268 | 0.49 (0.47–0.51) | 153 | 0.27 (0.24–0.30) |
| WHO grade II(2) d | 368 | 0.15 (0.14–0.17) | 27 | 0.06 (0.05–0.08) | — | — | 14 | 0.06 (0.04–0.09) | 378 | 0.15 (0.14–0.16) | 44 | 0.08 (0.06–0.10) |
| WHO grade III(3) d | 425 | 0.18 (0.16–0.19) | 28 | 0.06 (0.05–0.08) | — | — | — | — | 421 | 0.17 (0.15–0.18) | 52 | 0.09 (0.07–0.11) |
| WHO grade IV(4)d | 242 | 0.09 (0.09–0.10) | 23 | 0.05 (0.04–0.07) | — | — | — | — | 256 | 0.09 (0.09–0.10) | 26 | 0.05 (0.04–0.06) |
| Astrocytoma, IDH-wildtype (glioblastoma, IDH-wildtype) | 9205 | 2.84 (2.79–2.88) | 662 | 1.46 (1.38–1.55) | 55 | 1.32 (1.08–1.60) | 208 | 0.94 (0.85–1.04) | 9434 | 2.71 (2.67–2.75) | 879 | 1.94 (1.84–2.03) |
| WHO grade II(2)d | 167 | 0.06 (0.05–0.07) | 18 | 0.04 (0.03–0.05) | — | — | — | — | 178 | 0.06 (0.05–0.07) | 19 | 0.04 (0.03–0.05) |
| WHO grade III(3)d | 330 | 0.11 (0.10–0.12) | 29 | 0.07 (0.05–0.09) | — | — | 10 | 0.05 (0.03–0.07) | 350 | 0.11 (0.10–0.12) | 30 | 0.06 (0.04–0.08) |
| WHO grade IV(4)d | 6609 | 2.02 (1.98–2.05) | 472 | 1.04 (0.97–1.11) | 37 | 0.90 (0.70–1.14) | 144 | 0.65 (0.58–0.74) | 6760 | 1.92 (1.89–1.95) | 626 | 1.39 (1.31–1.47) |
| Oligodendroglioma, IDH-mutant and 1p/19q-codeleleted | 823 | 0.33 (0.31–0.34) | 47 | 0.11 (0.09–0.13) | 12 | 0.26 (0.17–0.39) | 29 | 0.13 (0.10–0.16) | 812 | 0.31 (0.29–0.32) | 128 | 0.24 (0.21–0.27) |
| WHO grade II(2)d | 406 | 0.17 (0.16–0.18) | 25 | 0.06 (0.04–0.08) | — | — | 14 | 0.06 (0.04–0.09) | 402 | 0.16 (0.15–0.17) | 68 | 0.12 (0.10–0.15) |
| WHO grade III(3)d | 284 | 0.11 (0.10–0.12) | 16 | 0.04 (0.02–0.05) | — | — | 11 | 0.05 (0.03–0.07) | 278 | 0.10 (0.09–0.11) | 42 | 0.08 (0.06–0.10) |
| Ependymal tumors | 1170 | 0.45 (0.44–0.46) | 123 | 0.27 (0.25–0.30) | 11 | 0.24 (0.18–0.31) | 36 | 0.17 (0.15–0.20) | 1179 | 0.43 (0.42–0.44) | 204 | 0.36 (0.34–0.39) |
| Spinal ependymoma g | 564 | 0.22 (0.21–0.23) | 47 | 0.11 (0.09–0.12) | 5 | 0.11 (0.07–0.17) | 17 | 0.08 (0.06–0.09) | 562 | 0.21 (0.20–0.21) | 92 | 0.17 (0.15–0.18) |
| Supratentorial ependymoma | 87 | 0.04 (0.03–0.04) | 15 | 0.03 (0.03–0.04) | — | — | 5 | 0.03 (0.02–0.04) | 93 | 0.04 (0.03–0.04) | 18 | 0.03 (0.02–0.04) |
| Infratentorial ependymomai | 397 | 0.15 (0.14–0.16) | 46 | 0.10 (0.09–0.12) | — | — | 10 | 0.05 (0.04–0.07) | 401 | 0.14 (0.14–0.15) | 68 | 0.12 (0.11–0.14) |
| Diffuse midline glioma, H3 K27M-mutantf | 122 | 0.05 (0.05–0.06) | 24 | 0.05 (0.04–0.07) | — | 8 | 0.04 (0.03–0.07) | 126 | 0.06 (0.05–0.06) | 39 | 0.06 (0.05–0.07) | |
| High-grade glioma of the brainstem j | 427 | 0.18 (0.17–0.19) | 81 | 0.17 (0.16–0.19) | 6 | 0.12 (0.08–0.18) | 17 | 0.09 (0.07–0.11) | 454 | 0.18 (0.18–0.19) | 92 | 0.15 (0.13–0.16) |
| Meningiomas | 28 753 | 9.27 (9.22–9.32) | 4592 | 11.12 (10.97–11.27) | 219 | 5.98 (5.61–6.37) | 1359 | 6.81 (6.65–6.98) | 32 046 | 9.62 (9.57–9.66) | 3643 | 9.02 (8.88–9.15) |
| WHO grade I(1)d | 9572 | 3.16 (3.13–3.19) | 1538 | 3.62 (3.54–3.71) | 83 | 2.14 (1.93–2.37) | 466 | 2.23 (2.14–2.32) | 10 714 | 3.29 (3.26–3.32) | 1220 | 2.79 (2.71–2.86) |
| WHO grade II(2) d | 1496 | 0.50 (0.49–0.52) | 316 | 0.73 (0.69–0.77) | 12 | 0.31 (0.23–0.40) | 103 | 0.50 (0.45–0.54) | 1777 | 0.56 (0.55–0.57) | 199 | 0.44 (0.42–0.47) |
| WHO grade III(3) d | 129 | 0.04 (0.04–0.05) | 24 | 0.05 (0.04–0.07) | — | — | 10 | 0.05 (0.04–0.06) | 145 | 0.04 (0.04–0.05) | 20 | 0.05 (0.04–0.06) |
| CNS lymphoma | 1417 | 0.45 (0.43–0.46) | 135 | 0.31 (0.29–0.34) | 11 | 0.30 (0.23–0.40) | 95 | 0.47 (0.43–0.51) | 1485 | 0.44 (0.43–0.45) | 211 | 0.51 (0.48–0.54) |
| Embryonal tumors | 503 | 0.23 (0.22–0.24) | 74 | 0.15 (0.14–0.17) | 7 | 0.14 (0.10–0.20) | 24 | 0.13 (0.11–0.16) | 491 | 0.22 (0.21–0.23) | 143 | 0.21 (0.19–0.23) |
| Medulloblastoma k | 359 | 0.16 (0.16–0.17) | 49 | 0.10 (0.09–0.12) | 6 | 0.12 (0.08–0.18) | 17 | 0.09 (0.07–0.11) | 347 | 0.16 (0.15–0.16) | 104 | 0.15 (0.14–0.17) |
| SHH-activated and TP53-wildtypef | 60 | 0.03 (0.02–0.03) | 10 | 0.02 (0.01–0.03) | — | — | — | — | 62 | 0.03 (0.02–0.03) | 18 | 0.03 (0.02–0.04) |
| SHH-activated and TP53-mutantf | — | — | — | — | — | — | — | — | — | — | — | — |
| WNT-activatedf | 11 | 0.01 (0.00–0.01) | — | — | — | — | — | — | 12 | 0.01 (0.00–0.01) | — | — |
| Non-WNT/non-SHHf | 58 | 0.03 (0.02–0.03) | — | — | — | — | — | — | 48 | 0.02 (0.02–0.03) | 18 | 0.03 (0.02–0.04) |
| AT/RTl | 63 | 0.03 (0.03–0.03) | 12 | 0.02 (0.02–0.03) | — | — | 4 | 0.02 (0.02–0.04) | 64 | 0.03 (0.03–0.03) | 18 | 0.03 (0.02–0.03) |
| Germ cell tumors | 192 | 0.09 (0.08–0.09) | 30 | 0.06 (0.05–0.07) | — | — | 22 | 0.11 (0.09–0.14) | 199 | 0.09 (0.08–0.09) | 57 | 0.08 (0.07–0.09) |
| Cranial and paraspinal nerve tumors | 6253 | 2.15 (2.12–2.17) | 463 | 1.05 (1.01–1.09) | 48 | 1.14 (1.00–1.30) | 383 | 1.78 (1.70–1.87) | 6699 | 2.15 (2.13–2.18) | 704 | 1.45 (1.40–1.50) |
| Tumors of the pituitary | 10 941 | 4.05 (4.01–4.09) | 3079 | 7.10 (6.98–7.21) | 143 | 3.37 (3.11–3.63) | 648 | 3.04 (2.93–3.15) | 12 755 | 4.39 (4.35–4.43) | 2618 | 5.15 (5.06–5.24) |
aAnnual average cases are calculated by dividing the 5-year total by five.
bRates are per 100 000 and are age-adjusted to the 2000 US standard population.
cICD-O-3 histopathology codes 9380-9384, 9391-9460.
dMay not sum to total of all cases in histopathology (tumor type) due to missing grade information.
eIncludes “diffuse” oligodendroglioma and “anaplastic” oligodendroglioma.
fHistopathologies collected beginning in 2018 and onward, average annual totals and incidence rates are based on two years of cases only. Limited to cases with histopathologic confirmation only.
gIncludes ependymal tumors occurring in sites spine and cauda equina.
hIncludes ependymal tumors occurring in sites cerebellum, frontal lobe, occipital lobe, temporal love, and parietal lobe.
iIncludes ependymal tumors occurring in sites cerebrum, ventricle, and brain stem.
jDefined as high grade glioma (ICD-O-3 histopathology codes: 9380, 9381, 9400, 9401, 9440, 9441, 9442/3, 9451, and 9460) occurring in the brain stem (ICD-O-3 site code: C71.7). See Ostrom, et al.(1) Ostrom QT, Price M, Ryan K, Edelson J, Neff C, Cioffi G, Waite KA, Kruchko C, Barnholtz-Sloan JS (2022) CBTRUS Statistical Report: pediatric brain tumor foundation childhood and adolescent primary brain and other central nervous system tumors diagnosed in the United States in 2014–2018. Neuro Oncol. 24: iii1–iii38. doi: 10.1093/neuonc/noac161 for more information.
kICD-O-3 code 9470–9472, 9474–9477.
lICD-O-3 code 9508/3.
—Counts and rates are not presented when fewer than 16 cases were reported for the specific category for the 5-year period. The suppressed cases are included in the counts and rates for totals.
Abbreviations: AIAN, American Indian/Alaska Native; API, Asian or Pacific Islander; ATRT, Atypical teratoid/rhabdoid tumors; CBTRUS, Central Brain Tumor Registry of the United States; CI, confidence interval; NPCR, National Program of Cancer Registries; SEER, Surveillance, Epidemiology, and End Results Program; SHH: Sonic Hedgehog; WNT: Wingless.
Oligodendroglial tumors are infiltrating tumors arising from oligodendrocytes within the CNS and are defined molecularly by the presence of IDH mutation and 1p/19q codeletion. There were 1112 newly diagnosed cases of oligodendroglial tumors per year on average. These tumors occurred more frequently in males compared to females irrespective of tumor grade. Oligodendroglial tumors were rare in children but more common in AYA and older adults (Table 2). White and AIAN persons were more commonly affected irrespective of tumor grade compared to other races (Table 2).
The prognosis for lower grade infiltrating astrocytoma histopathologies worsened with increasing tumor grade. Specifically, the 1-year, 5-year, and 10-year RS rates for WHO grade II (2) tumors were 89.2%, 66.4%, and rate not presented, respectively; for WHO grade III (3) tumors were 69.1%, 33.6%, and rate not presented, respectively; and for glioblastoma were 42.7%, 6.9%, and 4.3%, respectively (Table 3). Oligodendrogliomas carried better prognosis compared to similar histologichistopathologic grade astrocytomas, with 1-year, 5-year, and 10-year RS of 93.2%, 78.6%, and 65.1%, respectively (Table 3). Improved RS rates were associated with both lower grade and younger age.
One-, 5-, and 10-year relative survival ratesa (RS) with 95% confidence intervals (CI) for Primary Brain and Other Central Nervous System Tumors by selected histopathologies (tumor types) and behavior, overall and by age group at diagnosis. (Data from CBTRUS Annual Statistical Report: NPCR, 2004–2018)
| Histopathology (tumor type) | Age group | Median survival in months (95% CI) | N | 1-year RS (95% CI) | 5-year RS (95% CI) | 10-year RS (95% CI) |
|---|---|---|---|---|---|---|
| All gliomasb | 0–14 yearsc | ** (**–**) | 23 484 | 90.5 (90.1–90.9) | 80.8 (80.3–81.4) | 78.4 (77.8–79.0) |
| 15–39 yearsd | ** (**–**) | 39 775 | 93.1 (92.8–93.3) | 74.8 (74.3–75.2) | 64.3 (63.7–64.9) | |
| 40–64 years | 19 (18–19) | 96 169 | 66.1 (65.8–66.4) | 28.9 (28.6–29.2) | 23.4 (23.1–23.8) | |
| 65 + years | 5 (5–5) | 74 474 | 30.4 (30.1–30.7) | 8.2 (8.0–8.5) | 6.4 (6.1–6.7) | |
| All ages | 19 (19–19) | 233 902 | 62.0 (61.8–62.3) | 35.9 (35.7–36.1) | 31.0 (30.8–31.3) | |
| Glioblastoma | 0–14 years | 13 (13–15) | 1102 | 57.1 (54.1–60.0) | 19.9 (17.4–22.5) | 16.6 (14.1–19.2) |
| 15–39 years | 24 (23–25) | 6467 | 76.8 (75.7–77.8) | 26.6 (25.4–27.8) | 18.6 (17.4–19.8) | |
| 40–64 years | 13 (13–13) | 59 190 | 54.8 (54.3–55.2) | 8.1 (7.9–8.4) | 4.7 (4.4–4.9) | |
| 65 + years | 4 (4–5) | 57 886 | 25.8 (25.5–26.2) | 2.9 (2.7–3.1) | 2.0 (1.8–2.2) | |
| All ages | 9 (9–9) | 124 645 | 42.7 (42.4–43.0) | 6.9 (6.7–7.1) | 4.3 (4.2–4.5) | |
| Diffuse and anaplastic astrocytoma | 0–14 years | 16 (15–18) | 2753 | 86.2 (84.8–87.4) | 68.8 (66.9–70.5) | 65.7 (63.7–67.6) |
| 15–39 years | 98 (91–107) | 10 655 | 94.4 (93.9–94.8) | 72.4 (71.4–73.4) | 55.5 (54.2–56.7) | |
| 40–64 years | 22 (21–23) | 14 244 | 73.5 (72.8–74.3) | 36.5 (35.6–37.4) | 27.3 (26.4–28.3) | |
| 65 + years | 6 (5–6) | 7915 | 35.4 (34.3–36.5) | 9.7 (8.9–10.6) | 5.9 (5.1–6.8) | |
| All ages | 22 (21–22) | 35 567 | 72.4 (71.9–72.9) | 44.1 (43.5–44.7) | 34.5 (33.8–35.1) | |
| WHO grade II(2)e | 0–14 years | — | 403 | 94.3 (91.6–96.2) | 83.3 (79.1–86.8) | — |
| 15–39 years | ** (**–**) | 2032 | 98.3 (97.6–98.8) | 84.2 (82.0–86.1) | — | |
| 40–64 years | 36 (22–**) | 1664 | 88.1 (86.4–89.6) | 54.8 (51.8–57.8) | — | |
| 65 + years | — | 624 | 58.1 (54.0–62.0) | 24.7 (20.2–29.4) | — | |
| All ages | 69 (42–**) | 4723 | 89.2 (88.2–90.0) | 66.4 (64.7–68.0) | — | |
| WHO grade III(3)e | 0–14 years | 17 (15–21) | 283 | 67.9 (62.1–73.0) | 25.3 (19.8–31.0) | — |
| 15–39 years | 91 (86–**) | 2171 | 92.8 (91.7–93.9) | 64.6 (62.0–67.0) | — | |
| 40–64 years | 24 (23–25) | 3375 | 72.4 (70.8–73.9) | 28.9 (27.1–30.7) | — | |
| 65 + years | 6 (6–7) | 1837 | 34.0 (31.8–36.3) | 6.0 (4.7–7.6) | — | |
| All ages | 25 (24–27) | 7666 | 69.1 (68.0–70.1) | 33.6 (32.3–34.8) | — | |
| Oligodendroglial tumors | 0–14 years | ** (**–**) | 308 | 95.4 (92.4–97.3) | 90.4 (86.4–93.3) | 87.4 (82.5–91.0) |
| 15–39 years | ** (**–**) | 5203 | 98.0 (97.5–98.3) | 89.4 (88.4–90.3) | 74.9 (73.3–76.5) | |
| 40–64 years | 155 (146–161) | 7078 | 93.8 (93.2–94.4) | 76.8 (75.7–77.9) | 62.9 (61.3–64.4) | |
| 65 + years | 31 (27–34) | 1365 | 70.9 (68.2–73.3) | 41.2 (37.9–44.5) | 29.1 (25.0–33.3) | |
| All ages | 174 (163–**) | 13 954 | 93.2 (92.7–93.6) | 78.6 (77.8–79.4) | 65.1 (64.0–66.2) | |
| WHO grade II(2)e | 0–14 years | ** (**–**) | 72 | 100.0 (–) | 100.0 (–) | — |
| 15–39 years | ** (**–**) | 1484 | 99.2 (98.5–99.6) | 95.0 (93.3–96.2) | — | |
| 40–64 years | ** (**–**) | 1650 | 98.0 (97.1–98.6) | 90.0 (87.8–91.8) | — | |
| 65 + years | 85 (61–**) | 226 | 89.7 (84.3–93.3) | 65.9 (56.2–73.9) | — | |
| All ages | ** (**–**) | 3432 | 98.0 (97.4–98.5) | 91.0 (89.6–92.2) | — | |
| WHO grade III(3)e | 0–14 years | — | — | — | — | — |
| 15–39 years | — | — | — | — | — | |
| 40–64 years | ** (**–**) | 1105 | 93.2 (91.4–94.6) | 67.4 (63.8–70.8) | — | |
| 65 + years | 30 (26–42) | 251 | 74.9 (68.7–80.0) | 43.1 (34.8–51.0) | — | |
| All ages | ** (**–**) | 1947 | 92.1 (90.7–93.2) | 69.3 (66.7–71.8) | — | |
| Pilocytic astrocytoma | 0–14 years | ** (**–**) | 8156 | 99.0 (98.7–99.2) | 97.3 (96.8–97.6) | 95.9 (95.3–96.4) |
| 15–39 years | ** (**–**) | 3973 | 98.5 (98.1–98.9) | 94.9 (94.0–95.6) | 93.0 (91.9–94.0) | |
| 40–64 years | ** (**–**) | 1096 | 94.4 (92.8–95.7) | 83.8 (81.0–86.2) | 79.8 (76.2–82.9) | |
| 65 + years | 68 (49–106) | 252 | 81.7 (75.7–86.3) | 61.5 (52.9–68.9) | 58.1 (48.2–66.8) | |
| All ages | ** (**–**) | 13 477 | 98.2 (97.9–98.4) | 94.8 (94.4–95.2) | 93.1 (92.5–93.7) | |
| Ependymal tumors | 0–14 years | ** (**–**) | 2456 | 95.6 (94.7–96.3) | 80.4 (78.6–82.1) | 72.0 (69.7–74.2) |
| 15–39 years | ** (**–**) | 5002 | 98.3 (97.8–98.6) | 94.7 (93.9–95.4) | 91.7 (90.6–92.7) | |
| 40–64 years | ** (**–**) | 7167 | 96.6 (96.1–97.0) | 93.0 (92.2–93.7) | 90.8 (89.6–91.9) | |
| 65 + years | 123 (113–130) | 2303 | 89.9 (88.3–91.2) | 84.3 (81.7–86.6) | 76.6 (71.7–80.7) | |
| All ages | ** (**–**) | 16 928 | 96.0 (95.7–96.4) | 90.5 (89.9–91.1) | 86.7 (85.8–87.5) | |
| Spinal ependymomaf | 0–14 years | ** (**–**) | 346 | 98.5 (96.5–99.4) | 94.8 (91.5–96.8) | 91.9 (87.3–94.9) |
| 15–39 years | ** (**–**) | 3005 | 99.3 (98.8–99.5) | 97.8 (97.0–98.3) | 96.1 (94.9–97.0) | |
| 40–64 years | ** (**–**) | 3995 | 99.3 (98.9–99.6) | 97.9 (97.0–98.5) | 97.4 (95.8–98.4) | |
| 65 + years | 137 (128–154) | 1059 | 97.1 (95.2–98.2) | 95.7 (91.3–97.9) | 86.7 (78.6–91.9) | |
| All ages | ** (**–**) | 8405 | 99.0 (98.7–99.2) | 97.5 (96.8–98.0) | 95.7 (94.6–96.6) | |
| Supratentorial ependymomag | 0–14 years | ** (**–**) | 483 | 94.5 (92.0–96.2) | 82.1 (78.0–85.5) | 73.6 (68.1–78.4) |
| 15–39 years | ** (**–**) | 412 | 95.3 (92.7–97.0) | 80.9 (76.2–84.8) | 75.1 (69.7–79.7) | |
| 40–64 years | ** (136–**) | 373 | 89.1 (85.3–92.0) | 69.5 (63.7–74.6) | 64.2 (57.7–70.0) | |
| 65 + years | 34 (25–77) | 140 | 76.8 (68.1–83.5) | 51.7 (40.0–62.2) | 45.6 (26.3–62.9) | |
| All ages | ** (**–**) | 1408 | 91.6 (90.0–93.0) | 75.6 (72.9–78.1) | 69.6 (66.4–72.7) | |
| Infratentorial (posterior fossa) ependymomah | 0–14 years | ** (**–**) | 1052 | 95.7 (94.2–96.8) | 77.4 (74.4–80.0) | 67.7 (64.0–71.0) |
| 15–39 years | ** (**–**) | 1182 | 97.1 (95.9–98.0) | 92.8 (91.0–94.3) | 88.6 (85.9–90.8) | |
| 40–64 years | ** (**–**) | 2215 | 94.1 (92.9–95.0) | 90.0 (88.3–91.5) | 84.9 (82.3–87.2) | |
| 65 + years | 115 (97–129) | 895 | 85.4 (82.6–87.8) | 79.9 (75.8–83.3) | 72.2 (64.8–78.2) | |
| All ages | ** (**–**) | 5344 | 93.7 (92.9–94.3) | 86.4 (85.2–87.5) | 80.4 (78.7–82.0) | |
| High-grade glioma of the brainstemi | 0–14 years | 15 (14–16) | 3254 | 61.6 (59.9–63.3) | 37.2 (35.4–38.9) | 35.6 (33.8–37.4) |
| 15–39 years | 103 (88–124) | 1616 | 81.4 (79.3–83.2) | 57.9 (55.3–60.5) | 48.6 (45.5–51.7) | |
| 40–64 years | 20 (18–25) | 1469 | 63.8 (61.3–66.3) | 37.1 (34.4–39.8) | 29.0 (26.1–32.1) | |
| 65 + years | 4 (3–6) | 539 | 33.7 (29.6–37.9) | 19.2 (15.2–23.6) | 13.7 (8.7–19.8) | |
| All ages | 19 (18–21) | 6878 | 64.6 (63.4–65.7) | 40.7 (39.4–41.9) | 35.7 (34.4–37.1) | |
| Meningiomas | 0–14 years | ** (**–**) | 683 | 97.8 (96.3–98.7) | 95.6 (93.6–97.0) | 91.7 (88.6–94.0) |
| 15–39 years | ** (**–**) | 23 524 | 98.8 (98.6–98.9) | 97.0 (96.7–97.2) | 94.7 (94.3–95.1) | |
| 40–64 years | ** (**–**) | 154 336 | 97.0 (96.9–97.1) | 93.9 (93.7–94.0) | 91.1 (90.8–91.3) | |
| 65 + years | 92 (91–92) | 202 735 | 89.4 (89.2–89.6) | 81.6 (81.3–81.9) | 73.6 (73.1–74.2) | |
| All ages | ** (**–**) | 381 278 | 93.2 (93.1–93.3) | 87.9 (87.7–88.1) | 83.1 (82.8–83.4) | |
| WHO grade I(1)e | 0–14 years | ** (**–**) | 128 | 100.0 (--) | 96.6 (89.3–99.0) | — |
| 15–39 years | ** (**–**) | 5510 | 99.2 (98.9–99.4) | 98.0 (97.3–98.4) | — | |
| 40–64 years | ** (**–**) | 32 880 | 98.3 (98.2–98.5) | 97.3 (96.9–97.6) | — | |
| 65 + years | ** (**–**) | 25 187 | 93.7 (93.3–94.1) | 92.5 (91.6–93.3) | — | |
| All ages | ** (**–**) | 63 705 | 96.7 (96.5–96.9) | 95.6 (95.2–95.9) | — | |
| WHO grade II(2)e | 0–14 years | ** (**–**) | 88 | 100.0 (--) | 97.8 (84.2–99.7) | — |
| 15–39 years | ** (**–**) | 1368 | 98.6 (97.7–99.1) | 95.6 (93.8–96.9) | — | |
| 40–64 years | ** (**–**) | 5850 | 97.3 (96.8–97.8) | 91.9 (90.7–92.9) | — | |
| 65 + years | ** (**–**) | 4822 | 91.9 (90.9–92.8) | 78.8 (76.6–80.9) | — | |
| All ages | ** (**–**) | 12 128 | 95.4 (94.9–95.8) | 87.5 (86.4–88.4) | — | |
| WHO grade III(3)e | 0–14 years | — | — | — | — | — |
| 15–39 years | — | — | — | — | — | |
| 40–64 years | 61 (49–**) | 391 | 84.0 (79.8–87.5) | 52.5 (46.0–58.6) | — | |
| 65 + years | 29 (25–36) | 438 | 74.8 (70.0–79.0) | 38.0 (31.5–44.4) | — | |
| All ages | 46 (41–57) | 928 | 80.6 (77.7–83.2) | 49.1 (44.7–53.3) | — | |
| CNS lymphoma | 0–14 years | ** (**–**) | 171 | 91.0 (85.4–94.5) | 84.8 (78.1–89.6) | 79.2 (70.3–85.7) |
| 15–39 years | ** (147–**) | 1528 | 67.3 (64.8–69.6) | 59.2 (56.6–61.8) | 54.9 (51.9–57.7) | |
| 40–64 years | 41 (37–45) | 6971 | 64.5 (63.3–65.6) | 46.1 (44.8–47.4) | 36.4 (34.8–37.9) | |
| 65 + years | 7 (6–7) | 8225 | 44.7 (43.5–45.8) | 26.4 (25.2–27.5) | 19.1 (17.5–20.6) | |
| All ages | 17 (16–19) | 16 895 | 55.5 (54.7–56.3) | 38.5 (37.7–39.4) | 30.8 (29.8–31.8) | |
| Embryonal tumors | 0–14 years | ** (**–**) | 6037 | 81.9 (80.9–82.9) | 64.0 (62.7–65.2) | 59.1 (57.7–60.5) |
| 15–39 years | ** (**–**) | 2139 | 91.2 (89.9–92.4) | 71.4 (69.3–73.5) | 61.3 (58.8–63.8) | |
| 40–64 years | 58 (49–75) | 658 | 75.3 (71.8–78.5) | 50.8 (46.5–54.8) | 41.0 (36.3–45.6) | |
| 65 + years | 6 (5–9) | 125 | 39.3 (30.5–48.1) | 14.9 (8.3–23.3) | 13.7 (5.7–25.4) | |
| All ages | ** (**–**) | 8959 | 83.1 (82.3–83.9) | 64.1 (63.0–65.2) | 57.7 (56.5–58.9) | |
| Medulloblastomaj | 0–14 years | ** (**–**) | 3906 | 90.1 (89.1–91.0) | 73.8 (72.3–75.3) | 68.1 (66.3–69.8) |
| 15–39 years | ** (**–**) | 1681 | 94.0 (92.8–95.1) | 80.7 (78.5–82.7) | 70.3 (67.4–73.0) | |
| 40–64 years | 141 (113–**) | 379 | 85.9 (81.9–89.1) | 70.1 (64.6–74.9) | 57.1 (50.0–63.6) | |
| 65 + years | — | <50 | — | — | — | |
| All ages | ** (**–**) | 5992 | 90.8 (90.1–91.5) | 75.4 (74.2–76.5) | 68.0 (66.5–69.4) | |
| AT/RTk | 0–14 years | 15 (13–18) | 939 | 55.7 (52.4–58.8) | 35.5 (32.2–38.8) | 32.8 (29.4–36.3) |
| 15–39 years | — | <50 | — | — | — | |
| 40–64 years | — | <50 | — | — | — | |
| 65 + years | — | <50 | — | — | — | |
| All ages | 15 (13–18) | 999 | 56.3 (53.1–59.3) | 35.8 (32.6–39.1) | 32.8 (29.5–36.2) | |
| Germ cell tumors | 0–14 years | ** (**–**) | 1398 | 93.2 (91.7–94.5) | 89.2 (87.4–90.8) | 86.2 (83.9–88.2) |
| 15–39 years | ** (**–**) | 1500 | 95.3 (94.0–96.3) | 89.4 (87.6–91.0) | 87.3 (85.1–89.2) | |
| 40–64 years | ** (**–**) | 156 | 93.3 (87.7–96.4) | 87.3 (79.6–92.2) | 83.3 (74.4–89.3) | |
| 65 + years | — | <50 | — | — | — | |
| All ages | ** (**–**) | 3092 | 94.1 (93.2–94.9) | 89.0 (87.7–90.1) | 86.3 (84.8–87.8) | |
| Cranial and paraspinal nerve tumors | 0–14 years | ** (**–**) | 2253 | 99.8 (99.4–99.9) | 98.7 (98.1–99.2) | 97.9 (96.9–98.5) |
| 15–39 years | ** (**–**) | 13 341 | 99.3 (99.1–99.4) | 98.5 (98.2–98.7) | 97.7 (97.2–98.1) | |
| 40–64 years | ** (**–**) | 46 984 | 99.4 (99.3–99.5) | 99.4 (99.3–99.5) | 99.4 (99.3–99.5) | |
| 65 + years | 174 (167–**) | 24 647 | 98.7 (98.4–98.9) | 98.7 (98.4–98.9) | 98.7 (98.4–98.9) | |
| All ages | ** (**–**) | 87 225 | 99.2 (99.1–99.3) | 99.2 (99.1–99.3) | 99.2 (99.1–99.3) | |
| Tumors of the pituitary | 0–14 years | ** (**–**) | 2430 | 99.8 (99.5–99.9) | 99.4 (98.9–99.7) | 99.2 (98.5–99.5) |
| 15–39 years | ** (**–**) | 53 372 | 99.7 (99.7–99.8) | 99.4 (99.3–99.5) | 98.8 (98.6–99.0) | |
| 40–64 years | ** (**–**) | 74 270 | 98.7 (98.6–98.8) | 97.7 (97.5–97.9) | 96.5 (96.2–96.8) | |
| 65 + years | 125 (123–127) | 42 407 | 95.4 (95.1–95.7) | 92.1 (91.5–92.7) | 86.2 (85.0–87.4) | |
| All ages | ** (**–**) | 172 479 | 98.2 (98.2–98.3) | 97.0 (96.8–97.1) | 95.2 (94.9–95.5) |
aThe cohort analysis of survival rates was utilized for calculating the survival estimates presented in this table. Long-term cohort-based survival estimates reflect the survival experience of individuals diagnosed over the time period, and they may not necessarily reflect the long-term survival outlook of newly diagnosed cases.
bICD-O-3 histopathology codes 9380-9384, 9391-9460.
cChildren as defined by the National Cancer Institute, see: https://www.cancer.gov/types/childhood-cancers.
dAdolescents and Young Adults (AYA), as defined by the National Cancer Institute, see: http://www.cancer.gov/cancertopics/aya.
eGrade variable available for diagnosis years 2011–2018 only.
fIncludes ependymal tumors occurring in sites spine and cauda equina.
gIncludes ependymal tumors occurring in sites cerebellum, frontal lobe, occipital lobe, temporal love, and parietal lobe.
hIncludes ependymal tumors occurring in sites cerebrum, ventricle, and brain stem.
iDefined as high-grade glioma (ICD-O-3 histopathology codes: 9380, 9381, 9400, 9401, 9440, 9441, 9442/3, 9451, and 9460) occurring in the brain stem (ICD-O-3 site code: C71.7). See “CBTRUS Statistical Report: pediatric brain tumor foundation childhood and adolescent primary brain and other central nervous system tumors diagnosed in the United States in 2014-2018.” by Ostrom, et al. (doi :10.1093/neuonc/noac161) for more information.
jICD-O-3 codes 9470-9472, 9474-9477.
kICD-O-3 code 9508/3.
—Rates were not presented for categories with 50 or fewer cases and were suppressed for rates where fewer than 16 cases were surviving within a category.
**Could not be calculated.
Abbreviations: CBTRUS: Central Brain Tumor Registry of the United States; NPCR: National Program of Cancer Registries; WHO: World Health Organization; CNS: central nervous system; AT/RT: Atypical Teratoid/Rhabdoid Tumor.
Molecularly-Defined Adult-Type Diffuse Glioma
For cases diagnosed starting in 2018, the BMM variable enabled analysis of major brain tumor types according to their integrated diagnosis. Glioblastoma, IDH-wildtype was more common than astrocytoma, IDH-mutant and oligodendroglioma, IDH-mutant and 1p/19q-codeleted cases combined (Table 2). Overall, astrocytoma, IDH-mutant had a slightly higher incidence among AYA, compared to adults and children; whereas glioblastoma, IDH-wildtype was more common in adults compared to AYA and children (Table 2). Oligodendroglioma, IDH-mutant and 1p/19q-codeleted, WHO grade II (2) tumors were observed at similar rates in AYA and older adults, while WHO grade III (3) tumors were more common in adults. A predominance among male and White persons was observed irrespective of IDH status or tumor grade.
Although survival data were not available for integrated diagnoses in the currently released version of the NPCR dataset for malignant brain and CNS tumors, we previously estimated overall survival for selected adult-type diffuse gliomas, pediatric-type high-grade diffuse gliomas, and molecularly profiled medulloblastomas for cases diagnosed in 2018 using the National Cancer Database.5 Although not population-based, this dataset includes >85% of newly diagnosed malignant brain and other CNS tumor cases in the United States from the Commission on Cancer (CoC) accredited hospitals. One-year overall survival for glioblastoma, IDH-wildtype was 53.7%, while 1-year survival for astrocytoma, IDH-mutant was 98.0% for WHO grade II (2); 92.4% for WHO grade 3; and 76.3% for WHO grade IV (4) tumors.5 For oligodendroglioma, IDH-mutant and 1p/19q-codeleted tumors overall, 1-year survival was 97.9% for WHO grade II (2) and 94.4% for WHO grade III (3).5
Circumscribed Astrocytic Gliomas
Pilocytic astrocytomas were more commonly diagnosed among the youngest age group, with an age-adjusted incidence rate of 1.08 in children and 0.08 in older adults (Table 2). These tumors have a high survival rate, with 10-year RS exceeding 90% for children and young adults, and 75% for older adults. The median survival for pilocytic astrocytoma could not be calculated due to its overall high survival rate (Table 3 and Figure 3).
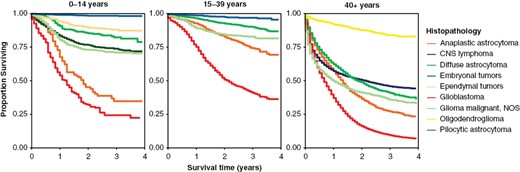
Kaplan–Meier survival curves for the five most common malignant histopathologies (tumor types) within age groups at diagnosis (ages 0–14 years, 15–39 years, and ages 40 + years). (Data from CBTRUS Annual Statistical Report: NPCR, 2001–2018.)
Ependymal Tumors
There were over 1300 ependymal tumors diagnosed annually on average between 2015 and 2019. The 2021 WHO-CNS classification revision further divides ependymal tumors into nine subgroups based on anatomical, histopathological, and molecular markers. These subtypes have different age preferences and clinical behaviors. Ependymal tumors can be found in the supratentorial, infratentorial (posterior fossa), and spinal regions. Spinal ependymomas are most common in young adults while supratentorial and infratentorial (posterior fossa) ependymomas occur mostly in children. Ependymal tumors have 1-year RS over 95%, but survival decreases over time, especially in young cases. The 10-year RS for children is 72.0%, for AYA is 91.7%, and for older adults is 76.6%. Spinal ependymomas have the best prognosis with a 10-year RS rate of 95.7% (Table 3). Supratentorial ependymomas have 1-, 5-, and 10-year RS rates of 91.6%, 75.6%, and 69.6%, respectively. Infratentorial (posterior fossa) ependymomas have 1-, 5-, and 10-year RS of 93.7%, 86.4%, and 80.4%, respectively. Although a unique ICD-O-3 code was introduced in 2018 for RELA fusion-positive ependymoma (i.e., Supratentorial ependymoma, ZFTA fusion-positive), <10 cases were reported in the NCDB data from 2018; therefore, survival statistics could not be calculated.5
Diffuse Midline Glioma
The 2021 WHO-CNS introduced a new schema for organizing high-grade and low-grade pediatric-type diffuse gliomas, which do not yet have distinct ICD-O-3 codes. In 2018, a unique ICD-O-3 code, 9385/3, was implemented for reporting diffuse midline gliomas, H3 K27M-mutant (now included among diffuse midline gliomas, H3 K27-altered). High-grade gliomas of the brainstem are most common in children less than 15 years with 232 average annual cases. For diffuse midline glioma, H3 K27M-mutant, there were 84 cases diagnosed annually, 2018–2019, in children 0–14 years (Table 2).
Survival after diagnosis for high-grade glioma of the brainstem is poor. Among all ages, 1-, 5-, and 10-year RS was 64.6%, 40.7%, and 35.7%, respectively. We previously estimated the survival for diffuse midline gliomas, H3 K27M-mutant cases diagnosed in 2018 using the National Cancer Database.5 Overall, 1-year survival for individuals diagnosed with these tumors was 55.9%.
Epidemiology of Meningiomas
Meningiomas are extra-axial tumors arising from the meninges and are the most common primary intracranial tumor with an incidence of 35 689 cases per year. Slow-growing WHO grade I (1) tumors were most common, while malignant WHO grade III (3) meningiomas were least common (Table 2). Of note, the incidence of WHO grade I (1) tumors specifically may be underestimated given that a subset are diagnosed by imaging alone, without pathology evaluation. Regardless of grade, these tumors more commonly affected older adults, but were rare in children. There was a strong female predominance, while the incidence was highest in Black persons compared to other races. However, when assessing WHO grade III (3) tumors specifically, there were no sex or race differences observed. RS rates were inversely correlated with WHO grade (5-year RS = 95.9% for grade I [1]; 5-year RS = 87.5% for grade II [2]; 5-year RS = 49.1% for WHO grade III [3]), as well as increasing age regardless of WHO grade (Table 3).
Epidemiology of Hematolymphoid Malignancies Involving the CNS (Previously, Primary CNS Lymphoma)
Hematolymphoid malignancies involving the CNS or primary CNS lymphoma (PCNSL) are a rare form of extra nodal non-Hodgkin lymphoma involving the CNS without evidence of systemic involvement. Most commonly affecting older adults, there were 1696 newly diagnosed cases per year among all ages (Table 2). PCSNL had a higher incidence in cases that were API persons and White persons compared to other races and had a slight male predominance. PCNSL can have an aggressive course with 1-, 5-, and 10-year RS of 55.5%, 38.5%, and 30.8%, respectively (Table 3).
Epidemiology of Embryonal Tumors
Embryonal tumors are aggressive WHO grade IV (4) tumors that frequently arise in the posterior fossa and primarily affect young children, with a median age at diagnosis of 8 years.4 Embryonal tumors are also the most common type of primary CNS tumor in children ages 0–4 years. They are the fourth most common type of tumor overall in children and adolescents ages 0–19 years.4 Approximately, 634 embryonal tumors were diagnosed annually in the United States (Table 2). Embryonal tumors include medulloblastoma, atypical teratoid/rhabdoid tumor (AT/RT), and the exceedingly rare, embryonal tumor with multilayered rosettes (ETMR) (Table 2). In the 2016 and 2021 WHO-CNS classification schema, medulloblastoma is classified into four molecular subtypes: wingless (WNT), activated, sonic hedgehog (SHH), activated and TP53-wildtype or TP53-mutant, and non-WNT/non-SHH. These subtypes are associated with specific age groups, with SHH-activated being most common in infants and young adults,28,29 and all other subtypes being more common in childhood. Medulloblastoma is slightly more common in males. Children with medulloblastoma of any subtype had 1-, 5-, and 10-year survival rates of 90.1%, 73.8%, and 68.1%, respectively (Table 3). In 2018, unique ICD-O-3 codes were introduced for the molecular subgroups of medulloblastomas; however, we previously showed that the uptake in utilization of the molecular-based codes was low in comparison to the conventional histopathology-based codes.13 Consequently, there remained insufficient numbers of medulloblastomas with molecular subtype reported to enable detailed analysis (Table 2). Children with AT/RT had worse prognosis, with 1-, 5-, and 10-year RS of 55.7%, 35.5%, and 32.8%, respectively. AT/RT did not show a sex predilection. C19MC-altered EMTR had extremely low incidence and a median age at diagnosis of 2 years.
Epidemiology of Germ Cell Tumors
CNS germ cell tumors (GCTs) are categorized into germinomas and non-germinomatous subtypes (embryonal carcinoma, yolk sac tumor, choriocarcinoma, teratomas, and mixed GCTs). GCTs are most common in younger people, with a bimodal distribution in which there is a peak incidence in early adolescence and a smaller peak in young children under 3 years. There were 256 new cases diagnosed annually on average in the United States between 2015 and 2019. Males remain more commonly affected than females (Table 2). All age groups diagnosed with CNS GCT had 1-, 5-, and 10-year RS of 94.1%, 89%, and 86.3%, respectively (Table 3).
Epidemiology of Cranial and Paraspinal Nerve Tumors
Cranial and paraspinal nerve tumors include schwannomas and neurofibromas. Both are typically slow-growing WHO grade I (1) tumors, although large plexiform neurofibromas—particularly in the context of Neurofibromatosis type 1—carry a small risk of transformation to malignant peripheral nerve sheath tumors (MPNST). While neurofibromas are associated with NF1, schwannomas are associated with NF2. The annual incidence of all cranial and paraspinal nerve tumors was 7403 cases per year on average (Table 2). These tumors were more common in older adults and equally affected males and females. Cranial and paraspinal nerve tumors were most common in White persons and least common in Black persons. Outcomes were excellent with a 10-year RS of 99.2% (Table 3).
Epidemiology of Tumors of the Sellar Region
Tumors of the pituitary had an incidence of 15 373 cases per year on average (Table 2). These tumors were more common in females compared to males and Black persons compared to other races. The incidence of tumors of the pituitary corresponded with increasing age. Prognosis was favorable with a 10-year RS of 95.2% (Table 3). We previously reported the epidemiology of tumors of the sellar region according to the 2017 WHO Classification of Tumours of Endocrine Organs.30,31
CBTRUS and Brain Tumor Surveillance Efforts in the United States
CBTRUS is a nonprofit 501(c)(3) professional research organization that provides high-quality statistical data on the population-based incidence of primary brain and other CNS tumors in the United States. In 1992, US Public Law 102-515, the Cancer Registries Amendment Act, mandated that all primary malignant cancer be reported to CCRs.32 This mandate was expanded to include non-malignant CNS tumors with the 2002 passage of Public Law 107–260 starting January 1, 2004.33 De-identified data on cancer diagnoses and mortality are reported from medical facilities to state-level CCRs, which then curates and transmits these data to NPCR and a special subset to SEER. CBTRUS works in a unique partnership with the CDC’s NPCR under a special agreement to directly receive data through the NPCR Cancer Surveillance System (NPCR-CSS) Submission Specifications mechanism.34 Under the guidance of four neuropathologists, the CBTRUS histopathology (tumor type) groupings were reorganized according to the 2016 WHO Classification.6 With the release of the 2021 WHO-CNS classification, we have further attempted to link these groupings to the updated schema when possible. This report summarizes the incidence, mortality, and survival for the major types of all primary brain and other CNS tumors, which were collected as mandated by law for all US cancer registries. Therefore, the CBTRUS dataset used in this summary is a complete record of all malignant and non-malignant brain and other CNS tumors reported in the years 2015–2019 according to the cancer collection data standards in the United States. Incidence, mortality, and survival statistics vary by histopathology (tumor type), age, sex, and race/ethnicity for brain and CNS tumors.
Limitations
It is not possible for all cases transmitted to CCRs to undergo central pathology review, and histopathology code assignment at case registration is based on histopathology information contained in the patient’s medical record. The WHO Classification of Tumours of the CNS was revised in 1993, 2000, 2007, 2016, and 2021.7,9,35–37 As of 2018, the US cancer registration continues to use the 2016 classification for data abstraction, but tumors included in this report may have been diagnosed using any of the available classifications prior to 2018 due to the variation in implementation of new standards, including the implementation of new ICD-O-3 codes. Histopathological classification in these data reflect the prevailing criteria at the time of diagnosis and subsequent case registration. This means that despite changes to histopathologic classification that have occurred over time, it is not possible to reclassify tumors based on new criteria but only to revise assignment of histopathology (tumor type) groupings (Supplementary Table S4) as CBTRUS has done with the data in its report covering 2015–2019. Only the data collected in diagnosis years 2018 and 2019 have been collected according to the 2016 WHO-CNS criteria and includes integrated histomolecular records for several brain tumors, including gliomas and medulloblastomas. In addition to changes in histopathologic criteria, there has historically been significant inter-rater variability in histopathological diagnosis of glioma.38,39 However, as molecular marker testing is increasingly ordered in clinical practices, the accuracy of integrated diagnosis will improve.
While all cases included in this report were diagnosed prior to the implementation of the 2021 WHO-CNS, we attempted to present specific histopathologies (e.g., adult type diffuse glioma) in a manner congruent with changing classifications. The majority of included histopathologies in this abbreviated report are largely unchanged in their classification by the 2021 WHO-CNS. Implementation of the 2021 WHO classification further expands the role of molecular pathology in defining CNS tumors,7 and it is important that all stakeholders work together to ensure that WHO classifications are implemented in a meaningful and timely way.
The majority of survival analyses presented in this report are from NPCR and US Cancer Statistics for 42 of the 52 CCRs in the United States, primarily through linkage with death certificate and other administrative records, including health care provider or social security records. These methods have been shown to produce reliable and robust estimates of cancer survival,40,41 although survival may be overestimated in some populations, such as those that are more likely to leave the state or country.
Conclusions
This report summarizes the incidence, mortality, and survival statistics for brain and CNS tumors in the United States in order to provide data that are useful for clinicians, researchers, and practicing healthcare providers in neuro oncology.
Acknowledgements
The CBTRUS data were provided through an agreement with the Centers for Disease Control’s National Program of Cancer Registries. In addition, CBTRUS used data from the research data files of the National Cancer Institute’s Surveillance, Epidemiology, and End Results Program, the National Center for Health Statistics National Vital Statistics System, and the American College of Surgeons Commission on Cancer’s National Cancer Database. CBTRUS acknowledges and appreciates these contributions to this report and to cancer surveillance in general. Contents are solely the responsibility of the authors and do not necessarily represent the official views of the CDC or the NCI.
Conflict of interest statement
Jill S. Barnholtz-Sloan, PhD, is a full-time paid employee of the NIH/NCI. Gino Cioffi, MPH, and Kristin A. Waite, PhD, are full-time contractors of the NIH/NCI.
Funding
CBTRUS is honored to be included among the research awardees of the following organizations which have contributed to the analyses resulting from the CBTRUS database: the Centers for Disease Control and Prevention (CDC) under Contract No. 75D30119C06056 Amendment/Modification No:00003, the American Brain Tumor Association, Novocure, the Musella Foundation for Brain Tumor Research & Information, Inc., The Sontag Foundation, National Brain Tumor Society, the Uncle Kory Foundation, the Pediatric Brain Tumor Foundation, and the Zelda Dorin Tetenbaum Memorial Fund, as well as private and in-kind donations.
References
Author notes
Mackenzie Price, Katherine Ryan, and Madison L. Shoaf contributed equally and should be considered co-first authors.
Jill S. Barnholtz-Sloan and Quinn T. Ostrom jointly supervised this work and should be considered co-senior authors.
