


Abstract
Glioblastoma (GBM) is associated with fatal outcomes and devastating neurological presentations especially impacting the elderly. Management remains controversial and representation in clinical trials poor. We generated 2 nomograms and a clinical decision making web tool using real-world data.
Patients ≥60 years of age with histologically confirmed GBM (ICD-O-3 histology codes 9440/3, 9441/3, and 9442/3) diagnosed 2005–2015 were identified from the BC Cancer Registry (n = 822). Seven hundred and twenty-nine patients for which performance status was captured were included in the analysis. Age, performance and resection status, administration of radiation therapy (RT), and chemotherapy were reviewed. Nomograms predicting 6- and 12-month overall survival (OS) probability were developed using Cox proportional hazards regression internally validated by c-index. A web tool powered by JavaScript was developed to calculate the survival probability.
Median OS was 6.6 months (95% confidence interval [CI] 6–7.2 months). Management involved concurrent chemoradiation (34%), RT alone (42%), and chemo alone (2.3%). Twenty-one percent of patients did not receive treatment beyond surgical intervention. Age, performance status, extent of resection, chemotherapy, and RT administration were all significant independent predictors of OS. Patients <80 years old who received RT had a significant survival advantage, regardless of extent of resection (hazard ratio range from 0.22 to 0.60, CI 0.15–0.95). A nomogram was constructed from all 729 patients (Harrell’s Concordance Index = 0.78 [CI 0.71–0.84]) with a second nomogram based on subgroup analysis of the 452 patients who underwent RT (Harrell’s Concordance Index = 0.81 [CI 0.70–0.90]). An online calculator based on both nomograms was generated for clinical use.
Two nomograms and accompanying web tool incorporating commonly captured clinical features were generated based on real-world data to optimize decision making in the clinic.
Glioblastoma is the most common primary brain tumor, associated with fatal outcomes and devastating neurological presentations, especially impacting the elderly.
Management remains heterogeneous due in part to frequent inability of patients to receive standard of care management secondary to impaired neurological and/or poor performance status and presence of comorbidities.
Recognizing the lack of consistent molecular and clinical biomarkers in the community and the difficulty for both patients and clinicians in estimating and discussing prognosis, we generated 2 nomograms and a web tool that may be employed to guide discussion and help optimize management of the elderly with glioblastoma.
Glioblastoma (GBM) is the most common primary brain tumor, associated with fatal outcomes and devastating neurological presentations, especially impacting the elderly, with a median age of diagnosis of 60–65. Prognosis in this age group is particularly poor with a reported median overall survival (OS) of 6–7 months. Management remains heterogeneous due in part to frequent inability of patients to receive standard of care management secondary to impaired neurological and/or poor performance status and presence of comorbidities. These clinical challenges are in part reflected in the poor representation in clinical trials and the lack of consensus on best management practices. Recognizing the lack of consistent molecular and clinical biomarkers in the community and the difficulty for both patients and clinicians in estimating and discussing prognosis, we generated 2 nomograms and a web tool that may be employed by clinicians to enable more consistent decisions in the clinic to optimize management of the elderly with GBM.
Glioblastoma (GBM) is the most common primary brain tumor, associated with fatal outcomes and devastating neurological presentations, especially impacting the elderly, with a median age of diagnosis of 60–65.1–4 Although a poor prognosis is expected for all GBM patients, the elderly have a particularly dismal outlook, with a reported median overall survival (OS) of 6–7 months in those aged 65 and older.1–6 Unfortunately, the management of elderly patients remains heterogeneous due in part to the potential inability to receive aggressive resection, more prolonged radiation courses, chemotherapy, or chemoirradiation (CRT) often due to a combination of impaired neurological and/or poor performance status and frequent presence of comorbidities. These clinical challenges are in part reflected in the poor representation in clinical trials and the lack of consensus on best management practices.1–5,7,8
In the elderly population, there have been no randomized control trials as impactful as the landmark European Organization for Research and Treatment of Cancer (EORTC)/National Cancer Institute of Canada (NCIC) trial,9 which demonstrated the improved survival of patients receiving concurrent and adjuvant temozolomide with radiation therapy (RT). This trial did not include any patients over the age of 70, a population that represents 25%–30% of all GBM cases.10,11 However, there have still been meaningful findings for the elderly GBM population in the past 20 years. In 2004, Roa et al. demonstrated the noninferiority of a short-course RT regimen of 40 Gy in 15 fractions (shorthand 40/15) over 3 weeks compared to the standard 60 Gy in 30 fractions (shorthand 60/30) over 6 weeks in patients 60 years or older.11 In 2012, The Neuro-Oncology Working Group (NOA)-08 trial showed that temozolomide alone was noninferior to RT in elderly patients (hazard ratio [HR] 1.09, confidence interval [CI] 0.84–1.42, Pnoninferiority = .033), with particular benefit in those with O6-methylguanine DNA methyltransferase (MGMT) promoter methylation.12 The Nordic trial with 2 treatment arms, temozolomide alone (HR 0.35, CI 0.21–0.56, P < .0001), versus a hypofractionated RT regimen of 34 Gy in 10 fractions (HR 0.59, CI 0.37–0.93, P = .02), revealed a survival advantage to the hypofractionated regimen as compared to the standard 60 Gy over 30 fractions dosage.13 Similarly, in 2017, Perry et al. demonstrated that 40 Gy in 15 fractions with concurrent and adjuvant temozolomide offered a survival advantage of 1.7 months (HR 0.67, CI 0.56–0.80, P < .001) compared to RT alone.14 More recent studies are increasingly exploring the use of iso-effective dose-escalated accelerated hypofractionated regimens emphasizing the importance of quality of life over late effects in view of limited life expectancy.15–17 However, the harsh reality of the management of GBM in the elderly lies in the fact that a considerable proportion of patients receive no treatment following biopsy or resection beyond best supportive care. According to a recent SEER data analysis, 29% of patients receive no treatment and untreated patients had a median survival of 2 months (range, 0–89 months).5 This mirrors the very real experience of patients and clinicians in the clinic with patients, who for multiple reasons are unable or unwilling to undergo active treatment and either choose or are left with, best supportive care as the only option of management. Understanding prognosis in this population, especially in the context of the very elderly, was as important to us as leveraging real-world data to help optimize management of the elderly who do go on to receive active treatment. Based on real-world data comprised of commonly captured clinical features, originating in 6 large publicly funded centers, we present 2 nomograms, 1 for all patients over the age of 60 and 1 for patients who go on to receive RT with an accompanying web tool that may allow for more consistent management and help communicate prognosis to patients and optimize patient outcomes.
Materials and Methods
Following ethics board approval, patients ≥60 years of age with histologically confirmed GBM (ICD-O-3 histology codes 9440/3, 9441/3, and 9442/3) diagnosed 2005–2015 were identified from the BC Cancer Registry (n = 822). Seven hundred and twenty-nine patients for which performance status was captured were included in the analysis. The BC Cancer Registry, in existence since 1969, certified by the North American Association of Central Cancer Registries (NAACCR), is a database of all new cancers diagnosed in British Columbia (BC) residents and contains personal and demographic information as well as diagnosis and death information on all cases of cancer diagnosed in BC residents.18 As part of cancer registry certification criteria, NAACCR annually reviews data from member registries for quality, accuracy, and completeness of cancer incidence data. The BC Cancer Registry incidence data have been reviewed by the NAACCR since 1996 diagnosis year, with access to registry information for research allowed only with approval by an accredited research ethics review board (obtained and noted above), only with BC Cancer oversight.18 The data provided by the registry included patient characteristics and treatment details, including RT and chemotherapy administration. Performance status, MGMT promoter methylation results, and extent of surgical resection were attained through review of patient charts. The performance status employed represents the most recently recorded performance status following surgical intervention but prior to initial treatment. Performance status was recorded in patient charts as either Karnofsky Performance Scale (KPS) or European Cooperative Oncology Group (ECOG) scores. To enable statistical analysis, ECOG scores were converted to KPS19 and performance status was assigned a score of 1–3 (1: KPS <60 or ECOG 3, 4; 2: KPS ≥60, <80 or ECOG 2; 3: KPS ≥80 or ECOG 0, 1). Chemotherapy administration data were obtained from pharmacy dispensing records in the BC Cancer Registry.
Statistical Analysis
The primary outcome was OS defined as date of diagnosis until date of death from any cause. Consults to BC Cancer reflected very similar patient referral numbers between age 60–64 and 65–69 (Supplementary Figure 3A). The number of patients with intermediate or poor performance status in these younger age groups was similar to older age groups. While age was statistically significant for OS, this significance was driven by the younger patients (60–69) versus older patients (70+) (Supplementary Figure 3B). Performance status had a significant effect on age as a feature, with age decreasing and losing significance as performance status declined (Supplementary Figure 3C). Kaplan–Meier method was used to estimate OS for univariate analysis, with the log-rank test being used to compare survival distributions between groups. Variables examined included patients’ age at diagnosis (60–69, 70–79, and 80+), performance status, RT (dose/fractionation) (60/30 or 59.4/33, 40/15, 30/10), use of chemotherapy (often including but not limited to temozolomide), and surgical intervention (biopsy, subtotal resection [STR], or gross total resection [GTR]).20MGMT promoter methylation status was analyzed separately as only 96 (11.7%) patients received testing. Cox proportional hazards regression modeling was used for multivariate analysis to assess patient and treatment factors associated with OS. Covariates were selected for inclusion based on both clinical and statistical significance and included age at diagnosis, performance status, use of chemotherapy, surgical extent, use of RT, or RT dose. Patients with incomplete or unavailable information were excluded from the models. Since the use of RT may be influenced by other factors, we tested for interactions between age, performance status, extent of resection, and RT to determine if differential management by age, performance status, and extent of resection affected survival outcome. Additionally, a second multivariate model was built to examine the subgroup of patients who received RT. Two nomograms predicting 6- and 12-month OS probability were developed using the rms package in R based on Cox proportional hazards regression multivariate analysis. The first nomogram was developed based on the full cohort of patients (n = 729) while the second was constructed based on the patients who went on to receive RT (n = 452). The nomograms were internally validated by calculating Harrell’s Concordance Index which quantifies the level of concordance between predicted probability and empirical probability of death. The relationship between the nomogram-predicted probability and the actual survival probability at 6 and 12 months was explored graphically in a calibration plot.
Statistical analysis was performed using SAS Version 9.4 (SAS Institute Inc.) and R software version 3.6.0 (R Development Core Team; http://www.r-project.org). P values of <.05 were considered statistically significant and all tests were 2 sided.
Web Tool Development
A web tool powered by JavaScript was developed to calculate the survival probability based on the nomograms including patient age, performance status, extend of surgical resection, chemotherapy status, and RT fractionation. Source code for this web tool can be found at https://github.com/gbm-nomogram/gbm-nomogram.github.io.
Results
Patient and Treatment Characteristics
Of the 729 patients included in the analysis, 60% were male and 40% female. Mean age at diagnosis was 70 (range 60–90) with age groups60–64 (26%), 65–69 (27%), 70–74 (20%), and 75 (27%). Sixty-five percent of the cohort was diagnosed between 2011 and 2015 and 35% between 2005 and 2010. ECOG scores were 0–1 (34%), 2 (33%), and 3–4 (33%) (Table 1). One hundred and ninety-nine (27%) underwent biopsy only and 530 (72%) had a gross total or STR (GTR/STR) with 574 (79%) patients receiving further treatment (308 [42%] RT alone, 17 [2.3%] chemo alone, 249 [34% CRT]) (Figure 1). Twenty-one percent of patients did not receive treatment beyond surgical intervention. MGMT promoter methylation status testing in elderly patients (≥65) was implemented in BC in November 2014 hence only carried out in 106 (12.9%) patients, and only available for 96 (11.7%) patients, the small discrepancy due to test failures or equivocal results. Since November 2014, 99/125(79%) of test eligible elderly patients diagnosed with GBM in BC were tested. Of the 96 total patients with available MGMT results, 45 patients were negative for MGMT promoter methylation, 46 were positive, and 5 had very low levels of methylation. When analyzing only those patients on temozolomide, resection status was GTR/STR (72%), biopsy (28%). 50/96 (52%) patients received chemotherapy.
Baseline characteristics of the elderly glioblastoma patient population in British Columbia from 2005 to 2015
| Parameter | Patients, n = 729 | Patients, % |
|---|---|---|
| Sex | ||
| Female | 291 | 39.9 |
| Male | 438 | 60.1 |
| Mean age at diagnosis (range) | 69.7 (60–90) | |
| Age at diagnosis | ||
| 60–64 | 197 | 27.0 |
| 65–69 | 199 | 27.3 |
| 70–74 | 145 | 19.9 |
| 75–79 | 130 | 17.8 |
| 80–84 | 43 | 5.9 |
| 85+ | 15 | 2.1 |
| Performance score | ||
| ECOG 0, 1 | 249 | 34.2 |
| ECOG 2 | 237 | 32.5 |
| ECOG 3, 4 | 243 | 33.3 |
| Diagnosis year, range | ||
| 2005–2010 | 263 | 36.1 |
| 2011–2015 | 466 | 63.9 |
| Location of lesion | ||
| Temporal | 213 | 29.2 |
| Frontal | 212 | 29.1 |
| Parietal | 147 | 20.2 |
| Occipital | 33 | 4.5 |
| Multifocala | 24 | 3.3 |
| Frontotemporal | 22 | 3.0 |
| Frontoparietal | 21 | 2.9 |
| Parietooccipital | 16 | 2.2 |
| Temporoparietal | 10 | 1.4 |
| Temporooccipital | 6 | 0.8 |
| Otherb | 25 | 3.4 |
ECOG, European Cooperative Oncology Group.
aIncludes involvement of more than 2 lobes.
bIncludes lesions in the cerebellum, ventricles, posterior fossa, basal ganglia, brainstem, thalami, insula, and corpus callosum.
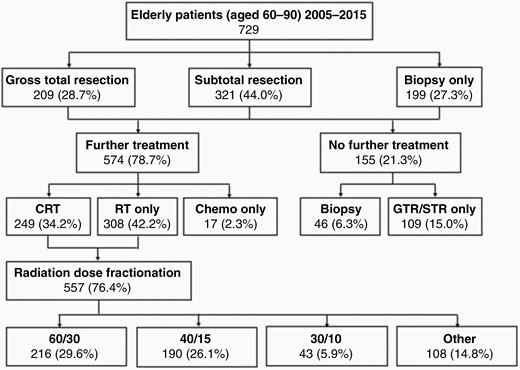
Initial treatment schematic. CRT, chemoradiation therapy; RT, radiation therapy.
Overall Survival
All patients were deceased by the time of analysis. The range of follow-up time was 0.46–99.9 months. Median OS was 6.6 months (CI 6–7.2 months). OS was 53.4% (CI 49.9%–56.7%) at 6 months and 24% (CI 21.1%–26.9%) at 12 months. In univariate Kaplan–Meier analysis (Figure 2), younger age, superior performance status, extent of resection, chemotherapy administration, and RT dose/fractionation were all associated with improved OS (all P < .0001). Patients ages 60–69 had significantly longer median survival (7.8 months, CI 6.9–8.7) than patients ages 70–79 (5.4 months, CI 4.6–6.2) or 80+ (4.8 months, CI 4–5.9) (P < .0001) (Figure 2B). Patients with superior performance status had the longest median survival time (11.4 months, CI 10–12.6) followed by those with average performance status (6.2 months, CI 5.4–7.2) and the lowest performance status (3.2 months, CI 2.9–3.6) (P < .0001) (Figure 2C). Patients who underwent GTR (8.9 months, CI 7.9–10) and STR (6.4 months, CI 5.5–7.4) had significantly longer median survival than those receiving biopsy alone (4 months, CI 3.3–4.8) (P < .0001) (Figure 2D). Median survival time was significantly longer among those who received chemotherapy (12.1 months, CI 11.3–13.6) than those who did not (3.9 months, CI 3.5–4.3) (P < .0001) (Figure 2E). Patients receiving the 60 Gy in 30 fractions (60/30) fractionation scheme had the longest median survival (12.8 months, CI 11.5–14.3) followed by those receiving 40 Gy in 15 fractions (40/15) (7.4 months, CI 6.6–8.3) and 30 Gy in 10 fractions (30/10) (5.7 months, CI 4.4–6.7), whereas those without RT or receiving a nonstandard dose had the shortest survival (2.9 months, CI 2.4–3.6) (P < .0001) (Figure 2F). OS was not significantly different between the methylated and unmethylated patients including for those patients who received vs those who did not receive temozolomide (n = 91, P = .60) or when analyzing only those patients on temozolomide (n = 50, P = .27).
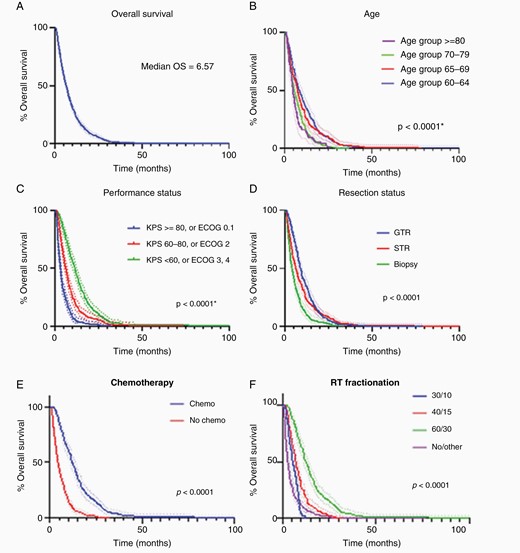
Univariate analysis, dotted lines = 95% CI. (A) OS of our population, n = 729. (B) OS by age group. (C) OS by performance status. (D) OS by extent of resection where 1 = biopsy, 2 = subtotal resection, 3 = gross total resection. (E) OS by use of temozolomide. (F) OS by dose fractionation. CI, confidence interval; OS, overall survival.
Regression Models
In multivariate Cox proportional hazards regression analysis, age, performance status, extent of resection, use of chemotherapy, and the use of RT were all significant independent predictors of OS (Table 2). Noting that the subgroup of patients who did not receive RT shared a set of characteristics that distinguished them from those who did (Supplementary Tables 1–4), a separate multivariate subgroup analysis of the patients who underwent RT was carried out (Table 2). The extent of resection, chemotherapy administration, and RT fractionation were statistically significant predictors of OS after adjusting for age at diagnosis and performance status. Patients with superior performance status had improved OS compared with patients with lower performance status, but this survival advantage was only statistically significant in those with the highest score for performance status (P = .0461). Both GTR (HR 0.73, CI 0.56–0.94) and STR (HR 0.65, CI 0.51–0.83) predicted improved OS versus biopsy alone (P = .0022). Patients who received chemotherapy at any point in their management had an OS advantage (HR 0.25, CI 0.18–0.36, P < .0001). RT fractionation was a significant predictor of OS (P = .02216) with both 60/30 (HR 0.73, CI 0.46–1.18) and 40/15 (HR 0.62, CI 0.44–0.88) fractionation schedules offering a survival advantage as compared with 30/10; however, this survival benefit was only statistically significant for 40/15 (vs 30/10) (P = .007). Patients who received 60/30 were more likely to be younger, have superior performance status and have received chemotherapy.
Multivariate Cox regression models
| Parameter | Overall P | P | Hazard ratio | 95% hazard ratio confidence limits | ||
|---|---|---|---|---|---|---|
| Multivariate Cox regression model including all patients, n = 729 | ||||||
| Age | 70–79 vs 60–69 | .0011 | .9128 | . | . | . |
| 80+ vs 60–69 | .0008 | . | . | . | ||
| Performance score | 2 vs 1 | .0006 | .0158 | 0.783 | 0.642 | 0.955 |
| 3 vs 1 | .0001 | 0.644 | 0.515 | 0.805 | ||
| Resection | STR vs biopsy | <.0001 | <.0001 | . | . | . |
| GTR vs biopsy | <.0001 | . | . | . | ||
| Chemo | Yes vs No | <.0001 | <.0001 | 0.319 | 0.256 | 0.397 |
| RT | Yes vs No | <.0001 | <.0001 | . | . | . |
| Age × RT | .0069 | .8061 | . | . | . | |
| .0040 | . | . | . | |||
| Resection × RT | .0006 | .0599 | . | . | . | |
| .0001 | . | . | . | |||
| Model including only patients who completed RT, n = 452 | ||||||
| Age | 70–79 vs 60–69 | .6731 | .6344 | 1.060 | 0.833 | 1.351 |
| 80+ vs 60–69 | .3817 | 1.240 | 0.766 | 2.008 | ||
| Performance score | 2 vs 1 | .0641 | .6024 | 0.926 | 0.695 | 1.235 |
| 3 vs 1 | .0461 | 0.736 | 0.544 | 0.995 | ||
| Resection | STR vs biopsy | .0022 | .0005 | 0.653 | 0.514 | 0.830 |
| GTR vs biopsy | .0152 | 0.728 | 0.563 | 0.941 | ||
| Chemo | Yes vs No | <.0001 | <.0001 | 0.253 | 0.180 | 0.355 |
| RT fractions | 40/15 vs 30/10 | .0216 | .0073 | 0.623 | 0.440 | 0.880 |
| 60/30 vs 30/10 | .1973 | 0.733 | 0.458 | 1.175 |
GTR, gross total resection; RT, radiation therapy; STR, subtotal resection.
Nomogram Generation
The first nomogram was generated based on the entire cohort of patients (n = 729) (Figure 3A). The strength of this nomogram is the inclusion of all patients, including those who did not go on to receive any further active management beyond supportive care following resection or biopsy, an important clinical need. However, secondarily this resulted in inclusion of the extreme elderly (>80 years of age), patients with poor performance status and a larger proportion of patients who did not receive chemotherapy, which may not be representative of most patients seen in the clinic. It demonstrated strong agreement for 6-month survival probability, however, the actual survival probability was higher than predicted at 12 months (Harrell’s Concordance Index = 0.78 [CI 0.71–0.84]) (calibration plot, Supplementary Figure 1).
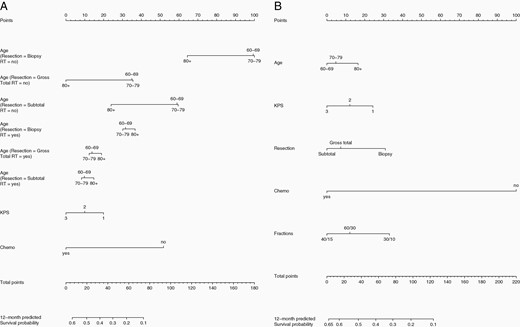
(A) Nomogram predicting 6- and 12-month survival probability based on Cox proportional hazards multivariate analysis including all patients (n = 729); Harrell’s Concordance Index = 0.78 (CI 0.71–0.84). (B) Nomogram predicting 6- and 12-month survival probability based on Cox proportional hazards multivariate analysis including only patients who received RT (n = 452); Harrell’s Concordance Index = 0.81 (CI 0.70–0.90). CI, confidence interval; RT, radiation therapy.
Noting interactions between age and RT administration and extent of resection and RT administration (Supplementary Tables 1–4), a second nomogram was generated based on the patient cohort who received RT only (n = 452) (Figure 3B). The strength of this nomogram is the focus on those patients who receive RT, a more homogenous population allowing for robust stratification by RT dose and fractionation (60/30, 40/15, and 30/10). However, the weakness of this nomogram is the focus on a patient subset that is younger, has superior performance status, a greater proportion with GTR and chemotherapy administration. The nomogram derived from this subgroup analysis predicted fairly good agreement between the nomogram-predicted and actual 12-month survival probability; however, the actual 6-month survival probability was lower than predicted by the nomogram (Harrell’s Concordance Index = 0.81, CI 0.70–0.90) (calibration plot, Supplementary Figure 2).
An online calculator based on the nomograms was generated and is available via gbm-nomogram.github.io (Figure 4). The calculator offers 2 options: 1 for all patients and 1 for patients who go on to receive RT. Both allow for the user to select age, KPS, resection type, the administration of chemotherapy, and the administration of RT, hence allowing for either RT or chemotherapy management in isolation or concurrent CRT (selecting yes to both chemotherapy and RT). The second nomogram aimed at patients who have decided to pursue RT allows for selection of RT dose/fractionation (60/30, 40/15, and 30/10). The first nomogram may be more indicated for older patients with poor performance status to illicit a predicted survival in the shorter term, while the second nomogram may lend itself better to estimating survival probability in younger patients with superior performance status where more aggressive RT regimens and the administration of chemotherapy are contemplated.
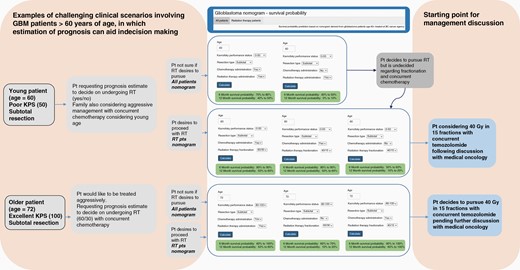
Examples of challenging clinical scenarios and potential utility of online calculator based on the nomograms for predicting 6- and 12-month survival probability. Two options are provided: 1 for all patients and 1 for patients undergoing RT. Scenario 1: younger patient (age = 60) with poor performance status uncertain regarding pursuing radiation and chemotherapy. Scenario 2: older patient (age = 72) with excellent performance status wishing to pursue aggressive management. This web-based tool is available via gbm-nomogram.github.io. RT, radiation therapy.
The interactions between age and RT administration and extent of resection and RT administration are provided in Supplementary Tables 1–4.
Discussion
It has been established that age is a strong predictor of GBM patient survival.21 Moreover, Shu et al. found that different age subgroups can have different independent determinants of mortality and response to treatments.22 Given that older GBM patients have the worst survival outcomes,22 it was crucial to analyze the factors affecting survival in this age group in order to optimize individualized treatment and more accurately estimate prognosis.23 Liu et al. developed a nomogram using data from 4975 patients with age above 65 originating from the SEER database to determine prognostic factors including age, race, tumor size, tumor site, resection status, chemotherapy, and RT administration. This study similar to others, identified RT alone or in combination with chemotherapy to be associated with survival benefit.7,24 Senders et al.25 captured a wider GBM population ranging in age from <50 to >70 years of age, with 59% of patients belonging to the category definition of 50–70 years of age. Our study was directed specifically at the >60 years of age demographic based on discussions in clinic and tumor boards where management in this patient population was often deemed controversial and unlike other nomograms our nomogram captures the impact of radiation fractionation and concurrent temozolomide administration.
In the clinic the most challenging discussions surrounding management occur in clinical scenarios that function outside of the “norm,” ie, younger patients with poor performance status or older patients with excellent performance status. This is the reasoning behind our study being as inclusive as possible to analyze patients up to the age of 60 as well as the very elderly in order to capture survival prediction in these challenging clinical scenarios. Too often survival prediction is predicated on known factors (age, performance status, and resection). In this cohort age lost in importance when performance status declined and the proportion of patients with poor KPS was similar across age groups 60–64, 65–69, and 70–74, again reflecting the clinical need to address survival prediction in this demographic. Using data originating from one of the largest cohorts of elderly GBM patients in Canada, our study provides a realistic overview on the effect of management in a real-world environment and further insight into the survival benefit of chemotherapy and RT as well as best supportive care which is an important consideration in treatment decisions for patients and clinicians. The patient characteristics of the BC elderly GBM cohort are similar to existing published retrospective data, with comparable median age at diagnosis and OS.2,7,15,26 Dose fractionation, 60/30 and in particular in the multivariate analysis, 40/15 versus 30/10, were found to result in superior OS augmented by the administration of chemotherapy. Patients receiving 60/30 were however more likely to receive concurrent and adjuvant chemotherapy in part due to superior performance status and younger age with patients receiving 40/15 less likely to receive chemotherapy and more likely to have inferior performance status and advanced age. In those patients who received 40/15, those who also received chemotherapy had a significantly increased OS compared to those who did not, similar to published data.7,14 The noninferiority of the 40/15 fractionation scheme as compared to the 60/30 fractionation reflects the findings of Roa et al.11 With respect to the extent of resection, this was statistically significant when dichotomized into biopsy versus maximally safe resection although there was no statistically significant difference between GTR and STR contrary to existing literature8,27 likely attributable to inconsistent coding distinguishing GTR and STR in the registry which may reflect inconsistent initial capture in the operative reports used as source documentation and the lack of capture of comorbidities and postoperative complications both of which have bearing on this aspect.8 We also not surprisingly identified interactions between age and RT administration and extent of resection and RT administration. We recognize an important conversation here regarding the presentation of available or recommended treatment options on the part of the clinician with some patients not being encouraged to pursue more aggressive management due to their advanced age or may reflect patients declining RT for a multitude of reasons including age, mobility. Recognition of the multiple factors that may be operating here is challenging to capture but may merit further analysis. Reflecting practical considerations for decision making and prognosis discussion in the clinic, we generated a separate nomogram for those patients who undergo RT.
Our nomogram for the RT subgroup achieved superior internal validation performance measured by c-index in comparison to previously developed nomogram for patients above age 50 who were assigned temozolomide and RT using data from the European Organization for Research and Treatment of Cancer-National Cancer Institute of Canada clinical trial.21 Although we have evaluated the discrimination power of our nomograms, they were developed based on data from 1 registry. Our next step would be to further validate both nomograms using data from external institutions. The web tool we developed makes it easy for clinicians across different institutions to access our survival nomograms and secondarily validate their accuracy as well. While several externally validated nomograms have been published, they were typically based on younger patients and rarely explored the effects of RT dose and fractionation.2,26 Once validated, our nomograms could provide a valuable tool for the management of elderly patients who desire to pursue RT and chemotherapy but also a starting point for discussion with patients and families when best supportive care might be indicated. It can also be employed as a tool for patient education in the consult once validated and could ultimately result in a more homogenous management approach in the elderly patient with GBM. Both the validation and the analysis of patterns of management in the context of web-based tools such as this one, remain subject of future directions.
Finally, many studies on GBM patient prognosis took into account biomarkers including IDH1 and MGMT methylation status, which are known important prognostic factors influencing patient management.25,28–38 The implications of MGMT in the elderly population are however debated7,14 and an in depth or consistent biomarker sequencing paradigm may not be readily available in community settings as evidenced by our registry data. For instance, MGMT promoter methylation status testing in elderly patients was implemented in BC in November 2014 and our analysis of the BC Cancer Registry data revealed that only 79% of eligible patients were tested since then. Noninvasive testing of biomarkers is an active research topic where multiple groups developed a nomogram to prediction IDH1 mutation status using clinical and radiomic parameters.39,40 Tumor location, tumor size, and the capture of tumors in the brainstem and butterfly lesions are potentially highly significant clinical features that can impact the ability to predict outcomes in glioma patients. Lack of robust data represents a limitation of our study reflecting the lack of/poor capture of these parameters in this and other large-scale registries.25,41 The barrier to robust systemic capture of these features is multifactorial including but not limited to: (1) inconsistent capture (imaging, operative report, pathology report as source document); (2) interobserver variability (capture on T1 gadolinium enhanced images vs T2 FLAIR vs pre- and postoperative); (3) manual entry versus electronic medical records batch capture. Tumor location is particularly contentious since tumors are often coded differently by different resources involved in information capture eg. same tumor captured as frontal or temporal or frontotemporal commonly and inconsistent capture as “Overlapping lesion of brain” when “tumor overlaps the boundaries of 2 or more categories or subcategories, and its point of origin cannot be determined” per SEER coding. Brainstem and butterfly lesions are less common as compared to gliomas at large representing far less 1% of lesions.25 There are also data suggesting that such lesions may not be universally associated with a poorer outcome which is contingent on aggressive surgical resection and systemic management.41,42 The complexity of tumor location, surgical approach, and outcome is born out in Sender et al.25 with some patients undergoing biopsy living longer than those undergoing STR irrespective of other factors.43
Prediction tools such as Senders et al.25 and our own represent valuable efforts to address a real clinical need in this space acknowledging that they are currently limited by lack of sufficiently robust clinical information.
Multiple studies suggest that combining imaging features extracted from magnetic resonance imaging (MRI), omic and clinical features, can improve the performance of survival prediction or risk stratification versus clinical features alone.44–47 Our next steps involve the addition of radiomic features and proteogenomic data while employing machine-learning techniques to extract features from patient imaging48 in order to improve the accuracy of survival probability prediction.
Conclusion
Nomograms were developed to provide survival probability estimation for elderly GBM patients based on clinical information readily available in the clinic at the time of consult. A web implementation was created (gbm-nomogram.github.io) to facilitate utilization and future validation of the nomograms by other institutions.
Funding
This work was supported by the Porte-Hungerford Neuro-Oncology Grant formerly held by Dr. A. Krauze and the BC Cancer Summer Studentship Program.
Authorship Statement. RZ participated in ongoing data analysis of the dataset, designed and optimized the web tool, and co-drafted and reviewed the manuscript. JZ collected and organized patient registry data, assisted in its analysis, co-drafted and reviewed the manuscript. KD carried out the statistical analysis and reviewed the manuscript. RP assisted in data organization and access and reviewed the manuscript. AVK conceived the study, participated in its design and coordination, collected patient data, co-drafted and reviewed the manuscript.
Conflict of interest statement. None declared.
Consent for Publication
All authors consented to publication of the material.
Data Availability
The datasets supporting the conclusions of this article were obtained from the BC Cancer Registry following approved Research Ethics Board Review.
References
Author notes
Authors share joint first authorship.
