


Abstract
Postoperative pediatric cerebellar mutism syndrome (pCMS) is a common but severe complication that may arise following the resection of posterior fossa tumors in children. Two previous studies have aimed to preoperatively predict pCMS, with varying results. In this work, we examine the generalization of these models and determine if pCMS can be predicted more accurately using an artificial neural network (ANN).
An overview of reviews was performed to identify risk factors for pCMS, and a retrospective dataset was collected as per these defined risk factors from children undergoing resection of primary posterior fossa tumors. The ANN was trained on this dataset and its performance was evaluated in comparison to logistic regression and other predictive indices via analysis of receiver operator characteristic curves. The area under the curve (AUC) and accuracy were calculated and compared using a Wilcoxon signed-rank test, with P < .05 considered statistically significant.
Two hundred and four children were included, of whom 80 developed pCMS. The performance of the ANN (AUC 0.949; accuracy 90.9%) exceeded that of logistic regression (P < .05) and both external models (P < .001).
Using an ANN, we show improved prediction of pCMS in comparison to previous models and conventional methods.
We identify predictive and reproducible anatomical risk factors of cerebellar mutism syndrome.
Cerebellar mutism syndrome can be accurately predicted using an artificial neural network.
Postoperative pediatric cerebellar mutism syndrome (pCMS) is a severe complication of childhood posterior fossa tumor resection. Despite its relatively high incidence, the syndrome’s etiology and predisposing risk factors are poorly understood. As such, not only is the prediction of pCMS clinically challenging, but this knowledge gap represents a significant area of uncertainty for patients giving consent prior to surgery and for clinicians developing postoperative management plans. Our study, the first to implement an artificial neural network for the prediction of complications in pediatric neuro-oncology, demonstrates that pCMS can be accurately and reproducibly predicted. By interpreting logistic regression coefficients, we also identify the neuroanatomical features most predictive of pCMS. It is our hope that this model will facilitate the routine clinical prediction of pCMS and act as a novel clinical decision-making tool: permitting the consideration of less aggressive resective surgery in combination with adjuvant therapies for patients at greatest risk.
Brain tumors are the most common solid tumors of childhood and the leading cause of cancer-related deaths in children.1 The vast majority (60–70%) arise within the posterior fossa, an area dense with eloquent neural parenchyma, and have an outcome dependent upon the extent of surgical resection.2,3 As such, the neurosurgeon must take care to balance the prognostic benefits of decompression and cytoreduction with the risk of incurring long-lasting neurological sequelae.
Despite recent advances in surgical management, perioperative imaging, and adjuvant therapies, postoperative pediatric cerebellar mutism syndrome (pCMS) remains an enduring complication of posterior fossa tumor resection, with a reported prevalence of 8–39%.4,5 Characterized by a delayed onset transient mutism, emotional lability, ataxia, and hypotonia, pCMS is thought to arise secondary to proximal damage to the efferent cerebellar pathways during surgery.6,7 Children typically recover slowly over several months, though their speech may never return to normal, and they may be late to reach developmental milestones—requiring intensive physiotherapy and speech and language therapy throughout the course of their recovery.8,9 Long-term neuropsychological deficits have also been reported in children with pCMS, with sparse recovery and the potential for further neurocognitive decline during development.10
Machine learning is a form of artificial intelligence in which algorithms improve their performance with experience (training). Given their ability to identify complex patterns in large datasets, such computational methods have the potential to improve outcome prediction beyond an individual surgeon’s clinical intuition.11 In light of the severity and long-term impact of pCMS, the accurate prediction of its onset will enable clinicians to counsel families preoperatively, as well as to formulate postoperative management plans, and ultimately, to implement risk-mitigating measures toward the prevention of pCMS, with consideration of less aggressive resective surgery for children at greatest risk.
Two previous studies have attempted to preoperatively predict pCMS using machine learning.12,13 However, these are trained on small datasets, employ quite restricted models that permit little interaction between input risk factors, and lack external validation. Our aim is to interrogate the external validity of these models and to improve the prediction of pCMS by training and validating an artificial neural network (ANN) on a large series of operated children with primary posterior fossa tumors. We hypothesized that an ANN would improve the prediction of pCMS as it considers implicit and complex nonlinear interactions between input risk factors. Indeed, the efficacy of this learning framework on relatively small datasets within neurosurgery has recently been shown.14,15
Materials and Methods
This study was approved by the institutional review boards of all collaborating institutions prior to commencement.
Defining Risk Factors for pCMS
An overview of reviews was performed in accordance with the Preferred Reporting Items for Systematic Reviews and Meta-Analyses (PRISMA) statement to identify risk factors for pCMS.16
Inclusion criteria.—
We included review articles written in the English language that report clinical and radiological features predictive of pCMS in children (≤18 years).
Databases, search strategy, and study selection.—
Ovid Medline and Embase were searched using the following strategy: (akinetic mutism) OR (cerebellar cognitive and affective syndrome) OR (CCAS) OR (Schmahmann’s syndrome) OR (posterior fossa syndrome) OR (transient cerebellar mutism) OR (transient cerebellar mutism and subsequent dysarthria) OR (cerebellar mutism) OR (cerebellar mutism syndrome) OR (post-operative paediatric cerebellar mutism syndrome) OR (post-operative pediatric cerebellar mutism syndrome) OR (POPCMS) OR (POP-CMS) OR (CMS) OR (pCMS).
Titles and abstracts were screened to identify articles that met the inclusion criteria (Supplementary Figure 1). A full-text review of these articles was then performed, and reported risk factors were recorded (Supplementary Table 1).5,8,9,17–62
Refinement of risk factors.—
Several risk factors were excluded prior to data collection: patient socioeconomic status, handedness, and preoperative language and/or behavioral impairment could not be reliably determined from retrospective medical records. Surgical risk factors such as the extent of resection, surgical approach, and use of a cavitron ultrasonic surgical aspirator were also excluded, as they are determined intraoperatively rather than preoperatively and so cannot be reliably included in a preoperative risk prediction model.
Features did not have to reach a certain risk threshold to be included. Given our relatively poor understanding of the pathophysiology underlying pCMS, a key advantage of using an ANN for prediction is that the model itself selects and weights the most predictive features.
Patient Selection and Data Curation
The Strengthening Reporting of Observational Studies in Epidemiology (STROBE) statement was used to inform the collation of our retrospective cohort.63 Modeling methods and results are reported in line with the Transparent Reporting of a Multivariable Prediction Model for Individual Prognosis or Diagnosis (TRIPOD) statement.64
A prospectively maintained neuro-oncology database was searched for all patients with primary posterior fossa tumors who underwent craniotomy and resection at our institution between January 1, 2002 and January 1, 2021. All patients received treatment as per local guidelines including case discussion within a dedicated pediatric neuro-oncology multidisciplinary team.
Clinical notes were interrogated for demographics and relevant surgical risk factors. pCMS was diagnosed in patients meeting the 2016 consensus criteria: transient reduced speech or mutism and emotional lability of delayed onset following resection of their posterior fossa tumor.43 Preoperative magnetic resonance imaging (MRI) of the neuraxis was reviewed independently by 3 observers (J.S., U.L., and K.M.) blinded to outcome, with imaging features and measurements recorded as per our defined risk factors. All imaging was obtained electronically as part of routine clinical care and did not undergo any subsequent modification. Compression, signal change, and infiltration were assessed on all sequences and confirmed on 2 planes. Interobserver agreement was calculated for qualitative variables using Fleiss’s κ, with the minimum cutoff for inclusion defined as κ ≥ 0.60, and for quantitative variables, using the intraclass correlation coefficient with the same inclusion cutoff.65Table 1 defines the variables we selected for data collection in addition to the interobserver reliability achieved. Due to their low interobserver agreement, risk factors involving the dentate, red, and inferior olivary nuclei were not included in the model. All other variables were included in both the ANN and logistic regression models.
| Definition | Interobserver Agreement | ||
|---|---|---|---|
| Qualitative variables | Fleiss’s κ | ||
| Tumor type | Preoperative radiological diagnosis: medulloblastoma, ependymoma, pilocytic astrocytoma, atypical teratoid rhabdoid tumor, other (detail). | 0.918 | |
| Tumor location | Vermian, caudal/ rostral intraventricular, right/left hemispheric, brainstem, other. Tumors may be inputted with more than one location (eg, large fourth ventricular tumors can be inputted as both caudal and rostral). | 0.723 | |
| Metastatic at presentation | Presence or absence of brain metastases. | 0.825 | |
| Preoperative hydrocephalus | Presence | Ventricular enlargement. | 0.666 |
| Grade | Mild—no periventricular signal change or transependymal edema. | 0.614 | |
| Moderate—with transependymal edema. | |||
| Severe—compression of external CSF spaces and the cerebral cortex. | |||
| Brainstem | Compression | Distortion of normal brainstem anatomy including anteroposterior displacement against the clivus, effacement of the prepontine/medullary cisterns, and loss of the pontomedullary sulcus. | 0.863 |
| Infiltration | Blurring of the boundary between the brainstem parenchyma and tumor with frank extension of the tumor beyond this boundary. | 0.780 | |
| Midbrain | Compression | Distortion of normal midbrain anatomy including anterior/superior displacement of the tectal plate. | 0.731 |
| Infiltration | Blurring of the boundary between the midbrain parenchyma and tumor with frank extension of the tumor beyond this boundary. | 0.747 | |
| Vermis | Compression | Distortion of normal vermian anatomy including effacement of ipsilateral vermian sulci or external cerebrospinal fluid spaces. | 0.612 |
| Infiltration | Tumor may arise from the vermis or there may be a lack of distinction between the margin of the vermis and the tumor, with tumoral extension beyond this margin. | 0.652 | |
| Fourth ventricle | Compression | Effacement by extrinsic tumor or direct infiltration by an intrinsic tumor. | 0.777 |
| Infiltration | Presence of tumor within the fourth ventricle or direct invasion of an extrinsic tumor to involve the walls of the fourth ventricle. | 0.838 | |
| Cerebellar hemispheres | Right compression | Distortion of normal cerebellar hemispheric anatomy including effacement of ipsilateral cerebellar sulci or external CSF spaces. | 0.623 |
| Left compression | 0.631 | ||
| Right infiltration | Tumor may arise from the cerebellar hemispheres or there may be a lack of distinction between the margin of the cerebellar parenchyma and the tumor, with tumoral extension beyond the dentate nuclei and MCPs. | 0.760 | |
| Left infiltration | 0.755 | ||
| MCPs | Right compression | Distortion of normal MCP anatomy including dorsoventral thinning of the MCP. | 0.736 |
| Left compression | 0.761 | ||
| Right signal change | Signal change within the MCPs without frank infiltration or blurring of the parenchyma–tumor boundary. | 0.683 | |
| Left signal change | 0.719 | ||
| Right infiltration | Tumor may arise from the MCPs or there may be a lack of distinction between the margin of the MCPs and the tumor, with tumoral extension beyond this margin. | 0.733 | |
| Left infiltration | 0.715 | ||
| SCPs | Right compression | Distortion of normal SCP anatomy including dorsoventral thinning of the SCP. | 0.709 |
| Left compression | 0.687 | ||
| Right signal change | Signal change within the SCPs without frank infiltration or blurring of the parenchyma–tumor boundary. | 0.675 | |
| Left signal change | 0.674 | ||
| Right infiltration | Tumor may arise from the SCPs or there may be a lack of distinction between the margin of the SCPs and the tumor, with tumoral extension beyond this margin. | 0.622 | |
| Left infiltration | 0.617 | ||
| Dentate nuclei* | Right signal change | Signal change within the dentate nuclei without frank infiltration or blurring of the parenchyma–tumor boundary. | 0.335 |
| Left signal change | 0.364 | ||
| Red nuclei* | Right signal change | Signal change within the red nuclei without frank infiltration or blurring of the parenchyma–tumor boundary. | 0.493 |
| Left signal change | 0.371 | ||
| Inferior olivary nuclei* | Right compression | Distortion of normal inferior olivary anatomy including anteroposterior flattening. | 0.445 |
| Left compression | 0.309 | ||
| Right signal change | Signal change within the inferior olivary nuclei without frank infiltration or blurring of the parenchyma–tumor boundary. | 0.373 | |
| Left signal change | 0.412 | ||
| Quantitative variables | ICC | ||
| Evan’s index | A quantitative measure of hydrocephalus severity is calculated by dividing the maximal axial diameter of the frontal horns by the maximum intracranial diameter at the same axial level. | 0.989 | |
| dSag | Anteroposterior displacement and/or invasion of the brainstem by tumor. If no displacement is present, dSag = 0. | 0.997 | |
| Maximum cerebellar width | A measure of cerebellar size is measured as the greatest transverse axial diameter of the cerebellum. | 0.997 | |
| Maximum tumor diameter | Anteroposterior | Greatest anteroposterior tumor length as measured on axial MRI. | 0.998 |
| Transverse | Greatest transverse axial width of the tumor. | 0.989 | |
| Superoinferior | Greatest superoinferior tumor height perpendicular to the AC–PC line as measured on midline sagittal MRI. | 0.999 |
AC, anterior commissure; CSF, cerebrospinal fluid; MCP, middle cerebellar peduncle; MRI, magnetic resonance imaging; PC, posterior commissure; SCP, superior cerebellar peduncle.
Inputs denoted by an asterisk (*) were not included in the final model due to low interobserver agreement. Structures infiltrated by tumor are also considered to be compressed by tumor (eg, fourth ventricular invasion would also be considered as de facto fourth ventricular compression). In cases of potential indistinction, and particularly in larger tumors, we erred toward defining a structure as infiltrated rather than compressed. Displacement alone without anatomical distortion does not qualify as compression. Signal change may be caused by hydrocephalus, perilesional edema, or direct interaction with the tumor.12 For ease of exposition, measurements are shown diagrammatically in Supplementary Figure 2, and exemplar cases of compression, signal change, and infiltration are shown in Supplementary Figure 3.
| Definition | Interobserver Agreement | ||
|---|---|---|---|
| Qualitative variables | Fleiss’s κ | ||
| Tumor type | Preoperative radiological diagnosis: medulloblastoma, ependymoma, pilocytic astrocytoma, atypical teratoid rhabdoid tumor, other (detail). | 0.918 | |
| Tumor location | Vermian, caudal/ rostral intraventricular, right/left hemispheric, brainstem, other. Tumors may be inputted with more than one location (eg, large fourth ventricular tumors can be inputted as both caudal and rostral). | 0.723 | |
| Metastatic at presentation | Presence or absence of brain metastases. | 0.825 | |
| Preoperative hydrocephalus | Presence | Ventricular enlargement. | 0.666 |
| Grade | Mild—no periventricular signal change or transependymal edema. | 0.614 | |
| Moderate—with transependymal edema. | |||
| Severe—compression of external CSF spaces and the cerebral cortex. | |||
| Brainstem | Compression | Distortion of normal brainstem anatomy including anteroposterior displacement against the clivus, effacement of the prepontine/medullary cisterns, and loss of the pontomedullary sulcus. | 0.863 |
| Infiltration | Blurring of the boundary between the brainstem parenchyma and tumor with frank extension of the tumor beyond this boundary. | 0.780 | |
| Midbrain | Compression | Distortion of normal midbrain anatomy including anterior/superior displacement of the tectal plate. | 0.731 |
| Infiltration | Blurring of the boundary between the midbrain parenchyma and tumor with frank extension of the tumor beyond this boundary. | 0.747 | |
| Vermis | Compression | Distortion of normal vermian anatomy including effacement of ipsilateral vermian sulci or external cerebrospinal fluid spaces. | 0.612 |
| Infiltration | Tumor may arise from the vermis or there may be a lack of distinction between the margin of the vermis and the tumor, with tumoral extension beyond this margin. | 0.652 | |
| Fourth ventricle | Compression | Effacement by extrinsic tumor or direct infiltration by an intrinsic tumor. | 0.777 |
| Infiltration | Presence of tumor within the fourth ventricle or direct invasion of an extrinsic tumor to involve the walls of the fourth ventricle. | 0.838 | |
| Cerebellar hemispheres | Right compression | Distortion of normal cerebellar hemispheric anatomy including effacement of ipsilateral cerebellar sulci or external CSF spaces. | 0.623 |
| Left compression | 0.631 | ||
| Right infiltration | Tumor may arise from the cerebellar hemispheres or there may be a lack of distinction between the margin of the cerebellar parenchyma and the tumor, with tumoral extension beyond the dentate nuclei and MCPs. | 0.760 | |
| Left infiltration | 0.755 | ||
| MCPs | Right compression | Distortion of normal MCP anatomy including dorsoventral thinning of the MCP. | 0.736 |
| Left compression | 0.761 | ||
| Right signal change | Signal change within the MCPs without frank infiltration or blurring of the parenchyma–tumor boundary. | 0.683 | |
| Left signal change | 0.719 | ||
| Right infiltration | Tumor may arise from the MCPs or there may be a lack of distinction between the margin of the MCPs and the tumor, with tumoral extension beyond this margin. | 0.733 | |
| Left infiltration | 0.715 | ||
| SCPs | Right compression | Distortion of normal SCP anatomy including dorsoventral thinning of the SCP. | 0.709 |
| Left compression | 0.687 | ||
| Right signal change | Signal change within the SCPs without frank infiltration or blurring of the parenchyma–tumor boundary. | 0.675 | |
| Left signal change | 0.674 | ||
| Right infiltration | Tumor may arise from the SCPs or there may be a lack of distinction between the margin of the SCPs and the tumor, with tumoral extension beyond this margin. | 0.622 | |
| Left infiltration | 0.617 | ||
| Dentate nuclei* | Right signal change | Signal change within the dentate nuclei without frank infiltration or blurring of the parenchyma–tumor boundary. | 0.335 |
| Left signal change | 0.364 | ||
| Red nuclei* | Right signal change | Signal change within the red nuclei without frank infiltration or blurring of the parenchyma–tumor boundary. | 0.493 |
| Left signal change | 0.371 | ||
| Inferior olivary nuclei* | Right compression | Distortion of normal inferior olivary anatomy including anteroposterior flattening. | 0.445 |
| Left compression | 0.309 | ||
| Right signal change | Signal change within the inferior olivary nuclei without frank infiltration or blurring of the parenchyma–tumor boundary. | 0.373 | |
| Left signal change | 0.412 | ||
| Quantitative variables | ICC | ||
| Evan’s index | A quantitative measure of hydrocephalus severity is calculated by dividing the maximal axial diameter of the frontal horns by the maximum intracranial diameter at the same axial level. | 0.989 | |
| dSag | Anteroposterior displacement and/or invasion of the brainstem by tumor. If no displacement is present, dSag = 0. | 0.997 | |
| Maximum cerebellar width | A measure of cerebellar size is measured as the greatest transverse axial diameter of the cerebellum. | 0.997 | |
| Maximum tumor diameter | Anteroposterior | Greatest anteroposterior tumor length as measured on axial MRI. | 0.998 |
| Transverse | Greatest transverse axial width of the tumor. | 0.989 | |
| Superoinferior | Greatest superoinferior tumor height perpendicular to the AC–PC line as measured on midline sagittal MRI. | 0.999 |
AC, anterior commissure; CSF, cerebrospinal fluid; MCP, middle cerebellar peduncle; MRI, magnetic resonance imaging; PC, posterior commissure; SCP, superior cerebellar peduncle.
Inputs denoted by an asterisk (*) were not included in the final model due to low interobserver agreement. Structures infiltrated by tumor are also considered to be compressed by tumor (eg, fourth ventricular invasion would also be considered as de facto fourth ventricular compression). In cases of potential indistinction, and particularly in larger tumors, we erred toward defining a structure as infiltrated rather than compressed. Displacement alone without anatomical distortion does not qualify as compression. Signal change may be caused by hydrocephalus, perilesional edema, or direct interaction with the tumor.12 For ease of exposition, measurements are shown diagrammatically in Supplementary Figure 2, and exemplar cases of compression, signal change, and infiltration are shown in Supplementary Figure 3.
To define the final inputs of our model, we used the modal value for qualitative variables and the mean value for quantitative variables. Missing data were encountered at random in 2 instances and was handled in the following manner:
Children without apparent diffusion coefficient (ADC) values on preoperative MRI. The ADC represents a quantitative indicator of the diffusion of water molecules within a tissue and has well-reported ranges in the literature corresponding to tumor type.67 Hence, the mean ADC was calculated for each tumor type in our cohort for children with and without pCMS. This mean ADC was then used in place of missing values (n = 36).
Children who underwent cerebrospinal fluid diversion prior to preoperative MRI and tumor resection. In these cases, as children have reached the threshold for neurosurgical intervention, they were assumed to have a hydrocephalus severity score of 3 and their Evan’s index was imputed as the mean of children with this score who did and did not develop pCMS (n = 12).
In order to increase the number of patients included with pCMS and, therefore, the potential accuracy of our model, additional patients with pCMS were included from 2 collaborating institutions subject to identical inclusion criteria. Preoperative imaging from these institutions was read in consensus between J.S., K.M., and the collaborating author (S.M.T. or D.M.M.). As a high interobserver reliability was achieved across 3 observers on our large single-center cohort, and external data constituted less than 10% of all included patients, a consensus agreement between 3 authors was deemed sufficient for the inclusion of this data. In areas of disagreement, the modal value was taken (ie, agreement between a minimum of 2 of the 3 observers).
ANN Theory
We implement a previously reported ANN with proven accuracy within neurosurgery.15 A complete description of our computational approach is presented in Supplementary Material.
In brief, we used nested cross-validation: the inner loop performed evolutionary hyperparameter optimization across 100 repeats of 10-fold stratified cross-validation, while the outer loop evaluated the network across 10 repeats of 10-fold stratified cross-validation. The final model was a stacked ensemble of 1000 constituent ANNs producing a single output. The loss function minimized during training was the mean squared error between the ANN prediction and the patient’s clinical outcome. The fitness of each solution was defined by the average validation error of the set of ANNs. Early stopping was applied to improve generalization and to prevent overfitting.
A cross-validated paired Wilcoxon signed-rank test was used to interrogate the statistical significance of the difference in performance between (1) our ANN and logistic regression and (2) our ANN and the Liu et al. and Dhaenens et al. models. Averaged receiver operating characteristic (ROC) curves were created for these comparative models using 10 repeats of 10-fold stratified cross-validation (the outer loop of nested cross-validation). The accuracy of the final models was determined by comparing the ANN prediction with the patient’s clinical outcome. The area under the curve (AUC) was calculated for each of the ROC curves and evaluated to compare the discriminatory power of the models. To evaluate the fit of the models, sensitivity, specificity, negative and positive predictive values were calculated using the same approach. In all instances, P < .05 was considered statistically significant.
Results
Patient Sample Characteristics
A retrospective review of medical records identified 426 children who underwent resection of primary posterior fossa tumors at our institution, of whom 66 (15.5%) developed pCMS. Four patients with pCMS were excluded due to a lack of preoperative MRI. Eighteen patients with pCMS were added from collaborating centers. Our final dataset consisted of all pCMS patients with preoperative MRI (n = 80) in addition to 124 patients without pCMS randomly sampled from the remaining dataset via a random number generator. The decision to train our model on a subsample of 124 patients who did not develop pCMS rather than the total 360 was pragmatic and constraint-based. Indeed, given the high reported accuracy of our ANN as a neurosurgical predictive model when trained on a dataset of 135 patients, training on this large subset should not negatively impact the performance of the ANN.15
Patient demographics, tumor characteristics, and surgical management are summarized in Table 2.
Patient Demographics With Descriptive Statistical Analysis Using t-tests for Continuous Variables and Chi-Square Tests for Categorical Variables
| Cohort | P | ||||
|---|---|---|---|---|---|
| All | pCMS | Non-pCMS | |||
| Number of patients enrolled | 204 | 80 | 124 | <.00001 | |
| Mean age (SD) (years) | 5.92 (3.88) | 5.19 (3.69) | 6.17 (4.09) | .20 | |
| Median age (interquartile range) (years) | 5.12 (2.61–8.64) | 4.46 (2.63–7.09) | 5.74 (2.52–8.90) | — | |
| Male:female ratio | 1.58: 1 | 2.20: 1 | 1.30: 1 | .08 | |
| Tumor type | Medulloblastoma | 108 | 48 | 60 | .18 |
| Pilocytic astrocytoma | 49 | 16 | 33 | ||
| Ependymoma | 31 | 9 | 22 | ||
| Atypical teratoid rhabdoid tumor | 10 | 5 | 5 | ||
| Other | 6 | 2 | 4 | ||
| Surgical approach | Transvermian | 102 | 44 | 58 | .02 |
| Telovelar | 69 | 29 | 40 | ||
| Other | 11 | 0 | 11 | ||
| Unknown | 22 | 7 | 15 | ||
| Extent of resection | Gross total resection | 146 | 56 | 90 | .55 |
| Subtotal resection | 51 | 22 | 29 | ||
| Unknown | 7 | 2 | 5 |
pCMS, pediatric cerebellar mutism syndrome. Significant values (P < .05) are given in bold.
Network Selection
The mean network structure had 3 layers: a 55-neuron input layer of risk factors for pCMS; one hidden layer containing 8 neurons; and an output layer containing one neuron representing the probability of a patient developing pCMS.
The optimal mean network hyperparameters defined by evolutionary hyperparameter optimization are detailed in Supplementary Table 2.
Network Evaluation
The comparative performance of the ANN is reported in Figure 1 and is illustrated as the mean ROC curve.
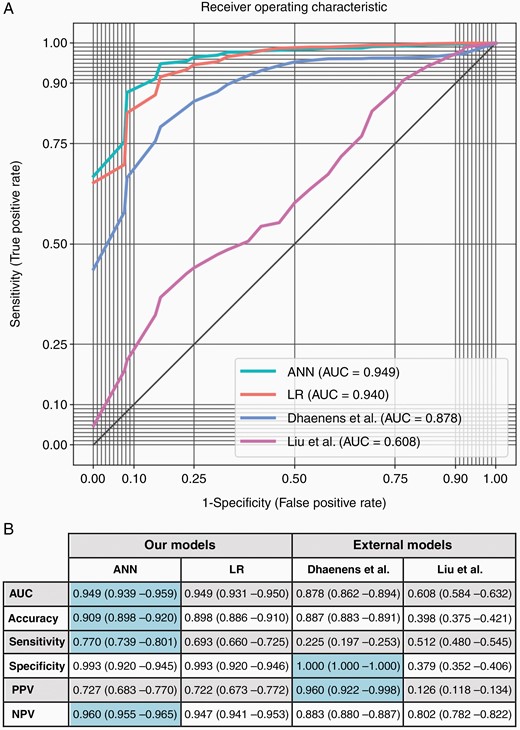
(A) Mean receiver operating characteristic (ROC) curves derived from the prediction of pediatric cerebellar mutism syndrome (pCMS) using an artificial neural network (ANN), logistic regression (LR), and external models. (B) Mean classification performance parameters were achieved using 10 × 10 stratified cross-validation to predict pCMS on the ANN, LR, and external models. Optimal metrics are highlighted in blue. The ANN performed better than Liu et al.’s model across all metrics (P < .001). It also performed better than Dhaenens et al.’s model in terms of the AUC, accuracy, sensitivity, and negative predictive value (P < .001), though performed worse in terms of specificity and positive predictive value (P < .001). Against logistic regression, the ANN performed better in terms of the AUC and accuracy (P < .05) as well as the sensitivity and negative predictive value (P < .001), though the specificity and positive predictive value did not reach statistical significance. AUC, area under the curve; PPV, positive predictive value; NPV, negative predictive value.
The AUC and accuracy of the ANN exceeded that of any other model (P < .05 vs logistic regression; P < .001 vs Liu et al. and Dhaenens et al.). The ANN also outperformed all models in terms of its sensitivity and negative predictive value (P < .001 in all instances). Though the specificity and positive predictive value of the ANN were not significantly different to logistic regression and worse than the Dhaenens et al. model, the ANN’s more substantive improvements in sensitivity and negative predictive value rendered it a more accurate predictive test for pCMS.
The most predictive neuroanatomical features of pCMS as determined by logistic regression coefficients are illustrated in Figure 2. Notably, tumoral involvement of structures associated with the dentatorubrothalamocortical tracts is shown to heighten the risk of developing pCMS, thereby lending further support to the implication of this tract in the pathophysiology of pCMS.9,20


Distribution of logistic regression coefficients over cross-validation folds. Arrows indicate whether a risk factor is protective or predictive of pediatric cerebellar mutism syndrome (pCMS). Coefficients represent the log odds ratio of developing pCMS given a certain risk factor. The log odds of developing pCMS for each tumor type are relative to the modal class (medulloblastoma), while the log odds of developing pCMS given compression, signal change, or infiltration of a certain structure are relative to the midline (eg, compression of the right cerebellar hemisphere is protective in comparison to midline cerebellar compression). Of particular note, the log odds of developing pCMS given involvement of the right/left cerebellar peduncles are relative to involvement of a set of hypothetical midline cerebellar peduncles. In consequence, involvement of the right/left cerebellar peduncles appears falsely protective for pCMS—it is only protective in comparison to this set of (more predictive) hypothetical midline cerebellar peduncles. This is intuitive as midline tumors are more commonly implicated in pCMS, and so they are more likely to affect a set of hypothetical midline cerebellar peduncles. Hence, involvement of the cerebellar peduncles does significantly predispose a child to developing pCMS, with more midline involvement indicative of more severe risk.
Discussion
This is the first study to report the use of an ANN for the prediction of complications in pediatric neuro-oncology. This is also the first study to implement an ANN for the prediction of pCMS and to demonstrate improved accuracy of the ANN over and above existing risk prediction models. Though the clinical significance of this improved accuracy in comparison to logistic regression remains uncertain, given the severity of pCMS and the relatively high volume of posterior fossa tumors encountered within pediatric neurosurgical practice, the increase in accuracy achieved may endow some benefit.
It is our hope that the model (available as an online calculator: https://amarcu5.github.io/cerebellar-mutism-prediction/calc.htm) will act as a useful adjunct to surgical decision making and as a counseling tool for children and their families when giving informed consent prior to surgery. Figure 3 highlights the potential utility of our model in clinical practice by illustrating ANN predictions for 3 patients: 1 who developed pCMS and 2 who did not.
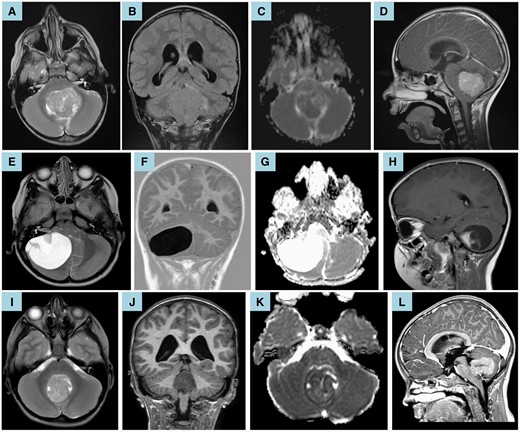
(A–D) Preoperative brain MRI of a 6.5-year-old boy showed a fourth ventricular medulloblastoma with corresponding restricted diffusion (C—apparent diffusion coefficient map). Axial T2-weighted MRI (A) and coronal T2-weighted-fluid-attenuated inversion recovery (B) show compression of the right middle cerebellar peduncle; infiltration of the cerebellar vermis, left cerebellar hemisphere, and left cerebellar peduncles; and compression of the right superior cerebellar peduncle. Sagittal T1-weighted postcontrast imaging (D) shows compression of the brainstem and midbrain. Moderate hydrocephalus is also noted (B, D). Given these anatomical and imaging characteristics, the ANN predicted that the patient would develop pCMS (likelihood 90.6%). Clinically, the child subsequently underwent gross total resection via a transvermian approach and manifested symptoms of pCMS in line with this prediction. (E–H) Preoperative brain MRI of a 4.5-year-old girl showed a large cystic lesion within the posterior fossa with high apparent diffusion coefficient values (G) and an enhancing mural nodule (H—sagittal T1-weighted postcontrast imaging). These imaging features are in keeping with a pilocytic astrocytoma. Axial T2-weighted MRI (E) and coronal T1-weighted inversion recovery (F) show infiltration of the right middle cerebellar peduncle and compression of the brainstem, vermis, fourth ventricle, and left cerebellar hemisphere. Mild hydrocephalus is also noted (F). Given these anatomical and imaging characteristics, the ANN predicted that the patient would not develop pCMS (likelihood 24.1%). Clinically, the child subsequently underwent gross total resection via a trans-cerebellar approach and did not manifest any symptoms of pCMS in line with this prediction. (I–L) Preoperative brain MRI of an 8-year-old girl showed a caudal intraventricular medulloblastoma with compression of the brainstem and cerebellar vermis (I—axial T2-weighted MRI), corresponding restricted diffusion (J—apparent diffusion coefficient map), and moderate hydrocephalus (K—coronal T1-weighted MRI; L—sagittal T1-weighted postcontrast imaging). Given these anatomical and imaging characteristics, the ANN predicted that the patient would not develop pCMS (likelihood 2.4%). Clinically, the child underwent gross total resection via a telovelar approach and did not manifest any symptoms of pCMS in line with this prediction.
Since 1990, survival rates for children with medulloblastoma, the most common tumor type implicated in pCMS, have remained relatively constant, in part due to the increasing importance of balancing the side effects of aggressive therapy (such as pCMS) with the potential for improved outcome.68 A large retrospective study of 787 children with medulloblastoma has shown that, though gross total resection remains the gold-standard surgical outcome, children left with minimal residual tumor following subtotal resection can expect similar outcomes.69 Hence, in the context of continuing uncertainty as to the oncological importance of complete resection in medulloblastoma, an accurate predictive model such as ours may permit the development of a clinical trial in which limited initial surgical resection, followed by adjuvant therapy and late second-look surgery of a smaller tumor, may be considered for children at very high risk of developing pCMS.
Liu et al.12 first aimed to predict pCMS using a C4.5 decision tree and reported an accuracy of 88.8%. Subsequent attempts to validate this model by both our study and Dhaenens et al. have been unsuccessful, with reported accuracies of 39.8% and 78%, respectively.12,13 This poor generalization performance may be partly explained by Liu et al.’s model architecture: a single, non-ensemble decision tree that is consequently more susceptible to noise and has the potential to overfit. Aiming to improve upon Liu et al.’s work, Dhaenens et al.13 implemented a logistic regression model and reported an accuracy of 87%, which generalizes well to our cohort (accuracy 88.7%). Indeed, the comparatively weaker classification performance of decision trees when compared to logistic regression and ANNs has been shown empirically.70
The improved accuracy of the ANN (90.9%) most likely lies in its ability to weigh complex nonlinear relationships between variables, such as those underlying pCMS, when little is known about their distribution and interaction. Hence, through this work, we also reinforce the fact that accurate ANNs can be developed on relatively small datasets by following established best practices: using a stacked ensemble, taking the mean performance of multiple runs, and evaluating the model using k-fold cross-validation.71–73
This work does, however, have several limitations. First, we employed a retrospective study design that rendered several risk factors indeterminable and risked the introduction of selection bias. However, given the relative rarity of pediatric brain tumors, this choice was pragmatic and enabled us to report one of the largest cohorts of children with pCMS in the literature. By sampling children with pCMS from multiple centers, we also increased the replicability of our model beyond a single institution. Second, we predominantly trained our ANN on imaging features predictive of pCMS from preoperative MRI. While this did permit direct comparison with and interrogation of other models to date, we hypothesize that the accuracy of our model would be improved by training a convolutional neural network on raw preoperative imaging. This shift toward automated prediction would also increase the practical utility of our model by eliminating the time-consuming process of image interpretation and manual measurement. Third, due to the nature of preoperative predictions, we are unable to account for individual variation between surgeons, approaches, and techniques employed. Most notably, all surgeons and institutions will differ in how they balance the benefits of more aggressive surgery, and a potential gross total resection, with the risk of incurring pCMS.
For the above reasons, our results should not be taken as direct clinical recommendations at this stage. However, we will aim to address these limitations in a planned prospective multicentre study. We will also aim to expand our model to consider and predict other common postoperative complications of posterior fossa tumor resection in children, namely, disturbances of motor function and gait, cranial nerve deficits, and visual impairment.4 A prospective study would also permit the integration and analysis of recently identified surgical risk factors excluded in this retrospective study, namely, surgical experience and extent of resection.74,75
Conclusion
We present a novel framework that interprets features from preoperative MRI and more accurately predicts the likelihood of a patient developing pCMS than previous methods. It is our hope that, following prospective validation of our model, the routine clinical prediction of pCMS will lead to safer surgery and better-informed discussions of the risks involved with patients and their families. As such, this work represents an exciting step toward the personalized, risk-stratified surgical management of children with brain tumors.
Funding
No funding was sought for this work. A.P.M. is funded by the United Kingdom Research and Innovation Centre for Doctoral Training in Artificial Intelligence for Healthcare (grant number: P/S023283/1). S.M.T. is funded by the Great Ormond Street Hospital Children’s Charity and is an Honorary Research Fellow of the Royal College of Surgeons of England. H.J.M. is funded by the Wellcome/EPSRC Centre for Interventional and Surgical Sciences and the National Institute of Health Research University College London Biomedical Research Centre. K.M. conducts medicolegal expert work and receives speaker honoraria from Guerbet, Novartis, and Siemens. All research at Great Ormond Street Hospital for Children NHS Foundation Trust and the University College London Great Ormond Street Institute of Child Health is made possible by the Great Ormond Street National Institute for Health Research Biomedical Research Centre. The views expressed are those of the authors and not necessarily those of the National Health Service, the National Institute for Health Research, or the Department of Health.
Acknowledgments
We would like to thank and acknowledge the neuro-oncology multidisciplinary teams at Great Ormond Street Hospital for Children, Children’s Hospital Colorado, and Lucile Packard Children’s Hospital and the steadfast work they do for the benefit of children such as these.
Ethical approval: Ethical approval was obtained prior to the commencement of this study from (1) the Department of Research Management and Governance, Great Ormond Street Hospital for Children NHS Foundation Trust (reference numbers: 17NI17, 19NI01, 19NI07); (2) the Colorado Multiple Institutional Review Board (reference number: 21-3146); and (3) the Research Compliance Office of Stanford University. At all institutions, the need for informed consent was waived for this retrospective study.
Conflict of interest statement. On behalf of all authors, the corresponding author asserts that no financial relationships exist with any organizations that might have an interest in the submitted work and that no other relationships or activities exist that could appear to have influenced the submitted work.
Authorship statement. Study conception: J.S., H.J.M, K.A., and K.M. Data acquisition: J.S., U.L., S.M.T, D.Y., G.G., K.Y., D.M.M., and K.M. Data analysis: J.S., A.P.M., and H.J.M. Manuscript draft: J.S. Manuscript revisions: J.S., A.P.M., U.L., S.M.T, D.Y., G.G., K.Y., D.M.M., H.J.M., K.A., and K.M.
Data availability
Anonymized data are available upon request.
Code Availability Statement: Code is available from the following GitHub repository: https://github.com/amarcu5/cerebellar-mutism-prediction
Our online calculator is available from the following GitHub page: https://amarcu5.github.io/cerebellar-mutism-prediction/calc.htm
