


Abstract
Childhood glioblastoma multiforme (GBM) is a highly aggressive disease with low survival, and its etiology, especially concerning germline genetic risk, is poorly understood. Mitochondria play a key role in putative tumorigenic processes relating to cellular oxidative metabolism, and mitochondrial DNA variants were not previously assessed for association with pediatric brain tumor risk.
We conducted an analysis of 675 mitochondrial DNA variants in 90 childhood GBM cases and 2789 controls to identify enrichment of mitochondrial variant associated with GBM risk. We also performed this analysis for other glioma subtypes including pilocytic astrocytoma. Nuclear-encoded mitochondrial gene variants were also analyzed.
We identified m1555 A>G was significantly associated with GBM risk (adjusted OR 29.30, 95% CI 5.25–163.4, P-value 9.5 X 10⁻⁴). No association was detected for other subtypes. Haplotype analysis further supported the independent risk contributed by m1555 G>A, instead of a haplogroup joint effect. Nuclear-encoded mitochondrial gene variants identified significant associations in European (rs62036057 in WWOX, adjusted OR = 2.99, 95% CI 1.88–4.75, P-value = 3.42 X 10⁻⁶) and Hispanic (rs111709726 in EFHD1, adjusted OR = 3.57, 95% CI 1.99–6.40, P-value = 1.41 X 10⁻⁶) populations in ethnicity-stratified analyses.
We report for the first time a potential role played by a functional mitochondrial ribosomal RNA variant in childhood GBM risk, and a potential role for both mitochondrial and nuclear-mitochondrial DNA polymorphisms in GBM tumorigenesis. These data implicate cellular oxidative metabolic capacity as a contributor to the etiology of pediatric glioblastoma.
m1555 G>A variant is associated with increased childhood GBM risk.
Both mitochondrial and nuclear-mitochondrial DNA polymorphisms play a potential role in GBM tumorigenesis.
We report for the first time that both mitochondrial and nuclear-mitochondrial DNA polymorphisms are associated with pediatric glioblastoma risk. In particular, the m1555 variant was significantly associated with GBM risk. M1555 was previously reported to be associated with other metabolic conditions (hearing loss, lower height etc.), and our findings suggest mitochondrial energy synthesis-related pathways may play a role in GBM tumorigenesis. This finding could deepen our understanding and generate new hypotheses on the etiology of this rare but aggressive tumor.
Glioma is the most common central nervous system (CNS) tumor in children,1 and it consists of a diverse group of subtypes with astrocytic, oligodendroglial, and ependymal features.2 While the majority of pediatric gliomas are benign, low-grade cases, some subtypes are high-grade and progress rapidly.3 For example, childhood glioblastoma multiforme (GBM) is a high-grade glioma, likely originating from glial cells or neural precursor cells. Although it is a rare disease compared to adult GBM, only accounting for 3–15% of primary central nervous system (CNS) tumors in children,4 the disease is very aggressive with poor prognosis. Surgical resection and chemo-radiotherapy remain the standard treatment for childhood glioblastoma, and three-year survival is less than 20% 5; therefore, prevention is a worthwhile goal. Prevention hinges on an understanding of the etiology of childhood GBM, which remains largely unknown. Etiologic research on pediatric brain tumors has investigated environmental risk factors such as radiation, air pollution, pesticides, and diet,6,7 but genetic risk factors that impact cellular metabolism and hence the metabolism of xenobiotics have received little attention.
One of the primary organelles that could be involved in glioma tumorigenesis is mitochondria (mt), via the formation of damaging reactive oxygen species produced during oxidative phosphorylation and ATP synthesis in biological processes such as inflammation, immune response, and mitosis.8 The majority of proteins involved in mitochondrial functions are encoded by nuclear genes (n-mt genes), of which there are approximately 1300 in the mitochondrial pathway.9 However, mitochondria also maintain their own DNA, which is crucial to cellular respiratory functions. The 16 kb human mitochondrial genome (mtDNA) is double-stranded, circular, and maternally inherited, and encodes 37 genes including respiratory complexes (I, III, IV, and V), tRNAs, and rRNAs for mtRNA translation. Variation in mtDNA has been causally linked to multiple diseases including MERRF syndrome, an encephalomyopathy with a mix of neurological and myopathic symptoms.10 Expectedly, mtDNA diseases typically affect organs that have a high demand for respiratory functions, namely brain and muscles. Recent sequencing studies demonstrated that somatic alterations of mtDNA may be important drivers of multiple childhood cancers including CNS tumors,11 with the highest rates of variants found in high-grade gliomas.12 These findings inspired the current investigation.
We explored whether germline mitochondrial DNA variants play a role in pediatric glioma risk, using single nucleotide polymorphism (SNP) array data from a California registry-based case-control study. We concentrated this analysis on the glioblastoma subtype given its demonstrated high frequency of somatic mitochondrial variants in tumor cells.12
Methods
Population
Subjects were derived from the California Childhood Cancer Records Linkage Project (CCRLP), a case-control study described previously.13 Briefly, glioma cases were diagnosed before the age of 20 years old from 1988 to 2011, and were born in California between 1982 and 2009. Histologic subtypes of glioma included pilocytic astrocytoma (POL, International Classification of Diseases (ICD)14 HISTO-T3 code 9421), nonpilocytic astrocytoma (AST, ICD HISTO-T3 code > 9400, and <9424 and is not 9421), glioblastoma (GBM, ICD HISTO-T3 code = 9440) and oligodendroglioma (OLG, ICD HISTO-T3 code = 9450 or 9451). All diagnoses were primary. California-born Controls were cancer-free and 1:1 individually matched to cases based on birthdate, sex, and maternal race/ethnicity through the California Vital Statistics records (Tables 1 and 2). Only European and Latino subjects are included in this study due to their sufficient sample sizes for analytic power. The final sample size included 2780 glioma cases and 2789 controls. This study was approved by the State of California Committee for the Protection of Human Subjects, and the University of Southern California, and University of California, Berkeley institutional review boards.
Clinical Variables of Glioma Cases and Controls
| Controls (N = 2789) | Cases (N = 2780) | P-value | |
|---|---|---|---|
| Sex | |||
| Male | 1502 | 1492 | .89 |
| Female | 1287 | 1288 | |
| Subtype | |||
| Pilocytic Astrocytoma (POL) 1 | NA | 787 | NA |
| Nonpilocytic astrocytoma (AST) 2 | NA | 592 | |
| Glioblastoma (GBM) 3 | NA | 90 | |
| Oligodendroglioma (OLG) 4 | NA | 75 | |
| Missing | NA | 471 | |
| Self-reported Race/Ethnicity | |||
| European | 1431 | 1358 | .05 |
| Hispanic | 1501 | 1279 | |
| Gestational age (days) | |||
| Mean (SD) | 278.6 (30.79) | 279.0 (27.76) | .73 |
| Median (range) | 278.0 (158.0–796.0) | 279.0 (172.0–828.0) | |
| Missing | 845 | 843 | |
| Birthweight (grams) | |||
| Mean (SD) | 3416 (556.05) | 3454 (563.66) | .03 |
| Median (range) | 3459 (580–4960) | 3487 (638–5840) | |
| Missing | 767 | 765 |
1ICD HISTO-T3 code 9421
2ICD HISTO-T3 code > 9400, and <9424 and is not 9421
3ICD HISTO-T3 code = 9440
4ICD HISTO-T3 code = 9450 or 9451
Clinical Variables of Glioma Cases by Subtype
| Glioblastoma (GBM) | Nonpilocytic astrocytoma (AST) | Pilocytic Astrocytoma (POL) | Oligodendroglioma (OLG) | |
|---|---|---|---|---|
| Sex | ||||
| Male | 58 | 323 | 386 | 44 |
| Female | 32 | 269 | 401 | 31 |
| Race/Ethnicity | ||||
| European | 46 | 329 | 455 | 47 |
| Hispanic | 44 | 263 | 332 | 28 |
| Gestational age (days) | ||||
| Mean (SD) | 276.2 (19.64) | 279.1 (29.39) | 280.1 (29.46) | 280.8 (20.62) |
| Median (range) | 278.0 (172.0–322.0) | 279.0 (172.0–815.0) | 279.0 (175.0–828.0) | 282.0 (187.0–350.0) |
| Missing | 6 | 24 | 27 | 1 |
| Birthweight (g) | ||||
| Mean (SD) | 3498 (438.96) | 3453 (583.90) | 3465 (515.96) | 3532 (648.50) |
| Median (range) | 3508 (2380–4593) | 3482 (737–5840) | 3465 (1247–5415) | 3487 (1389–4649) |
| Tumor site | ||||
| Retina | 0 | 1 | 0 | 0 |
| Cerebral meninges | 0 | 1 | 0 | 0 |
| Spinal meninges | 0 | 1 | 0 | 0 |
| Cerebrum | 14 | 85 | 76 | 9 |
| Frontal lobe | 15 | 48 | 12 | 18 |
| Temporal lobe | 3 | 92 | 21 | 20 |
| Parietal lobe | 11 | 35 | 10 | 8 |
| Occipital lobe | 4 | 10 | 5 | 2 |
| Ventricle NOS | 5 | 26 | 38 | 2 |
| Cerebellum, NOS | 4 | 50 | 324 | 3 |
| Brain stem | 11 | 94 | 99 | 2 |
| Overlapping lesion of brain | 15 | 45 | 35 | 10 |
| Brain NOS | 4 | 38 | 89 | 0 |
| Spinal cord | 4 | 42 | 31 | 1 |
| Optic nerve | 0 | 14 | 40 | 0 |
| Cranial nerve, NOS | 0 | 7 | 3 | 0 |
| Overlapping lesion of brain and CNS | 0 | 0 | 1 | 0 |
| Pineal gland | 0 | 3 | 3 | 0 |
Dried Blood Spot (DBS) and DNA Genotyping
Archived DBS were obtained from the California biobank program. DNA extraction, processing, and genotyping were performed as previously described.15 Briefly, DNA was extracted from a 1/3 of DBS using Genfind v3.0 (Beckman) reagents on an Eppendorf robot, and a minimum of 300 ng DNA (using nanodrop for purity and pico-green measurement for DNA quantity) was genotyped on the Affymetrix Axiom Precision Medicine Diversity Array (PMDA). Genotype calls were then extracted with Affymetrix Powertools. Polymorphisms were numbered according to the mitochondrial reference genome Genbank: NC_012920.1.
MtDNA Association Study
Probes for a total of 675 mt variants were included on the PMDA array and downstream quality-control steps retained all variants. More specifically, we checked if any SNPs had more than 5% missing data, or significantly deviated from Hardy–Weinberg equilibrium (HWE P-value < 10–4). Plink 216 was used to conduct case-control association analyses. In the event a logistic regression model failed to converge, a Firth regression17 was conducted. We controlled for 10 genetic principal components (calculated with Plink 2) to account for possible population stratification, especially relevant for the admixed Hispanic population, and performed association analyses separately in Hispanic and in non-Hispanic white subjects. Association analyses were conducted in self-reported Hispanics (43 cases and 1501 controls) and Europeans (44 cases and 1431 controls) separately and results from both ethnic groups were meta-analyzed using METAL.18 Results were adjusted for multiple testing using Bonferroni correction based on the number of actual comparisons after linkage disequilibrium (LD) pruning (Europeans: 267 variants, P < 1.88 X 10⁻⁴; Latinos: 286 variants, P < 1.75 X 10⁻⁴; Meta-analysis: 277 variants, P < 1.8 X 10⁻⁴).
Nuclear-Encoded Mitochondrial Gene (N-mt Gene) Set Association Analysis
Since most mitochondrial proteins are encoded by genes located in the nucleus, we also conducted candidate-variant association analyses in glioma cases and controls for SNPs located in regions of N-mt genes. We retrieved the list of genes and their locations from NCBI gene database19 specified by Gene Ontology ID GO:0005739.9,20,21 SNPs bounded by their genomic coordinates within this GO category were included in N-mt SNP scanning. We identified 1318 genes and a total of 19 119 SNPs in European subjects and 19 126 SNPs in Hispanic subjects. We completed analysis (PLINK2), controlling for the 10 genetic PCs as in mitochondrial SNPs association analysis. Multiple correction was also based on Bonferroni test like that of mitochondrial analysis (Europeans: 7960 variants, P < 6.28 X 10⁻⁶; Latinos: 9799 variants, P < 5.10 X 10⁻⁶; Meta-analysis: 8880 variants, P < 5.63 X 10⁻⁶).
Haplogroup-Based Analysis
Since mitochondrial DNA is a “haploid genome”, we also conducted haplotype-based analysis in addition to SNP analysis. To classify the haplogroup of each subject, we used Haplogrep,22 a bioinformatics tool for mtDNA haplogroup classification. Haplogroups were reported based on leaf level, and then traversed to the most common macrogroups 23 for further analysis. A 2-sided exact binomial test was used to assess whether the distribution of cases was significantly different from chance (coin flip) within each macrogroup.
Results
mtDNA variant m1555A>G was associated with elevated glioblastoma risks separately in European (adjusted odds ratio (OR) = 98.33, 95% CI 8.06–1200.01, raw P-value = 3.25 X 10⁻⁴) and Hispanic children (adjusted OR = 9.93, 95% CI 0.93–105.68, raw P-value = .056). In meta-analysis combining both groups, m1555A>G was significantly associated with glioblastoma risk after multiple test correction (P-value = 1.0 x 10⁻⁴, Table 3, Figure 1). We next examined the distribution of m1555 genotypes in glioblastoma cases and controls (Table 3). Patients had a significantly higher odds of carrying a “G” variant by Fisher’s exact test in European subjects (raw OR = 64.86, 95% CI 5.77–728.80, P-value = 3.0 x 10⁻³), and in the total population (raw OR = 23.85, 95% CI 5.25–108.19, P-value = 9.5 X 10⁻⁴). The OR was also >1.0 in the Hispanic population, although it did not reach statistical significance (OR = 10.43, 95% CI 1.06–102.33, P-value = .12). Overall, subjects with the m1555A>G variant had a significantly higher odds to develop glioblastoma. We also examined m1555 genotypes in glioma cases with other, lower-grade subtypes, and the presence of “G” allele was not detected (Table 3).
Distributions of m1555 Genotypes and Odds Ratios in Glioma Subtypes
| Subtype | European | Hispanic | Total | ||||||||||||
|---|---|---|---|---|---|---|---|---|---|---|---|---|---|---|---|
| m1555 Genotype | Odds Ratio (95%CI) | m1555 Genotype | Odds Ratio (95%CI) | m1555 Genotype | Odds Ratio (95%CI) | ||||||||||
| A | G | NA | Raw | Adjusted | A | G | NA | Raw | Adjusted | A | G | NA | Raw | Adjusted | |
| Controls | 1427 | 1 | 3 | reference | reference | 1352 | 3 | 7 | reference | reference | 2779 | 4 | 10 | reference | reference |
| GBM1 | 44 | 2 | 0 | 64.86* (5.77–728.80) | 98.33* (8.06–1200.01) | 43 | 1 | 0 | 10.43* (1.06–102.33) | 9.93+ (0.93–105.68) | 87 | 3 | 0 | 23.85* (5.25–108.19) | 29.30* (5.25–163.4) |
| POL2 | 455 | 0 | 0 | 0 | 1.003 (0.01–93.60) | 332 | 0 | 0 | 0 | 0.58 (0.02–18.09) | 787 | 0 | 0 | 0 | 0.71 (0.05–10.98) |
| AST3 | 329 | 0 | 0 | 0 | 1.54 (0.02–144.82) | 263 | 0 | 0 | 0 | 0.75 (0.02–23.33) | 592 | 0 | 0 | 0 | 0.97 (0.06–15.11) |
| OLG4 | 47 | 0 | 0 | 0 | 13.39 (0.14–1323.29) | 28 | 0 | 0 | 0 | 5.54 (0.17–183.06) | 75 | 0 | 0 | 0 | 7.66 (0.49–118.99) |
1 glioblastoma
2 pilocytic astrocytoma
3 nonpilocytic astrocytoma
4 oligodendroglioma
* P value is significant (P < .05)
+ P value is borderline significant (P < .1)
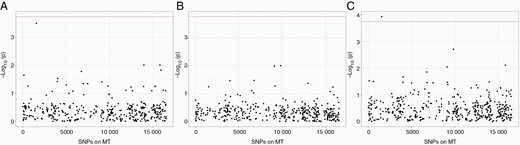
Association analysis results for mitochondrial SNPs in (A) European subjects (B) Hispanic subjects (C) meta-analysis of both populations. Y-axis shows -log10 P values from association models. X-axis shows location of SNP in mitochondria. Significance level is determined by Bonferroni test, based on number of actual tests after pruning.
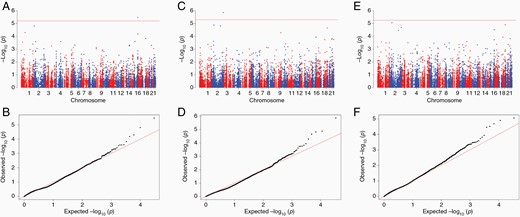
Association analysis results for nucleus mitochondrial SNPs. Significance level is determined by Bonferroni test, based on number of actual tests after pruning. (A) Manhattan plot for European subjects. (B) Q-Q plot for European subjects (lambda value = 1.30) (C) Manhattan plot for Hispanic subjects (D) Q-Q plot for Hispanic subjects (lambda value = 0.93) (E) Manhattan plot for meta-analysis of both populations (F) Q-Q plot for meta-analysis results (lambda value = 1.31).
The haplotype analysis confirmed the risk impact was specific to the m1555 variant in glioblastoma cases, rather than any linked variants. We were able to obtain haplogroups at the leaf level (Supplementary Tables S1, S2), as well as the most common macrogroups (Tables 4, Supplementary Table S5) (by traversing up the mitochondrial haplogroup tree) for all subjects, and as expected, subjects are scattered among many haplogroups. On the leaf level, there are 314 haplogroups present in Europeans (34 of them contain glioblastoma cases) and 231 in Hispanics (21 of them contain glioblastoma cases). Furthermore, binomial test demonstrated no significant difference in case/control distribution in any macrogroup (Tables 4, Supplementary Table S5). Additionally, there was no significant difference in haplogroup distribution for m1555A>G subjects, further supporting that the m1555 variant is unlikely to impact GBM risk through the effects of a larger haplogroup (Supplementary TableTable S6). We also tested case-control distribution in each macrogroup for other subtypes of glioma, as well as all glioma cases combined, and identified race/ethnicity-specific associations with several macrogroups (Supplementary TableTables S3, S4). For example, in European children, macrogroup B was more common among pilocytic astrocytoma cases (P = .046) and all glioma cases combined (P = .034). In Hispanic subjects, macrogroup A was highly more common for oligodendroglioma (P = .0051), pilocytic astrocytoma (P = .0082), as well as all glioma cases combined (P = .00064).
Common Macrogroup Distribution in Europeans
| haplotypes macrogroup | control | case | case percentage | propTestP |
|---|---|---|---|---|
| Z | 0 | 1 | 1 | 0.031 |
| A | 6 | 1 | 0.143 | 0.199 |
| H | 591 | 24 | 0.039 | 0.245 |
| J | 172 | 7 | 0.039 | 0.514 |
| K | 119 | 4 | 0.033 | 0.795 |
| T | 157 | 4 | 0.025 | 0.822 |
| U | 204 | 5 | 0.024 | 0.692 |
| B | 6 | 0 | 0 | 1 |
| C | 13 | 0 | 0 | 1 |
| D | 6 | 0 | 0 | 1 |
| F | 4 | 0 | 0 | 1 |
| I | 41 | 0 | 0 | 0.64 |
| L1 | 2 | 0 | 0 | 1 |
| L2 | 6 | 0 | 0 | 1 |
| L3 | 3 | 0 | 0 | 1 |
| M | 6 | 0 | 0 | 1 |
| N | 19 | 0 | 0 | 1 |
| P | 1 | 0 | 0 | 1 |
| R | 4 | 0 | 0 | 1 |
| V | 34 | 0 | 0 | 0.627 |
| W | 28 | 0 | 0 | 1 |
| X | 9 | 0 | 0 | 1 |
We broadened the analysis of mitochondrial germline SNPs via an analysis of N-mt genes in glioblastoma cases and controls. Candidate mitochondrial genes, defined by gene ontology lists, were assessed in relation to glioblastoma risk. In European children, rs62036057 was significant after Bonferroni correction (OR = 2.99, 95% CI 1.88–4.75, P-value = 3.42 X 10⁻⁶) (Supplementary TableTable S7). This SNP is in the intronic region of WWOX, which encodes a member of the short-chain dehydrogenases/reductases (SDR) family. However, the association with this SNP was not statistically significant in the analysis limited to Hispanic children nor in the meta-analysis, although effect sizes were in the same direction as Europeans. In Hispanic subjects, rs111709726, which is in the intronic region of EFHD1, was significantly associated with glioblastoma case-control status (OR = 6.19, 95% CI 2.95–12.97, P-value = 1.41 X 10⁻⁶). Report effects in Europeans as here well, to be consistent with the above reporting of WWOX.
Meta-analyses of the N-mt SNPs did not reach statistical significance after Bonferroni correction. The SNP with the smallest P value is rs115257641 (OR = 5.19, 95% CI 2.51–10.72, P-value = 8.83 x 10⁻⁶), in the intronic region of PRKCE which belongs to the Protein Kinase C (PKC) family (Figure 1, Supplementary TableTable S7).
Discussion
Leveraging a large California population-based case-control study, we report for the first time an association between m1555A>G variant and pediatric glioblastoma risk. Further haplotype analysis was conducted to elucidate whether this association is a result of haplogroup representation supported an independent effect of the m1555A>G variant. Notably, the association plot showed a lack of other SNPs in LD with m1555, implying that the m1555 variant is not tagging a larger haplogroup compatible with its known structure.
M1555 is in a region of mitochondrial 12S rRNA gene that is highly conserved,24 and m1555 in E. coli has been demonstrated to be an essential ribosome decoding site.25 The A>G variant has been previously reported to cause hearing loss.26–29 Since hair cells in the inner ear have a high demand for energy and are rich in mitochondria, hearing loss is a common symptom across many mitochondrial conditions such as m1555A>G. m1555A>G has also been reported to be associated with reduced height,30 likely associated with a decrease in efficiency of mitochondrial energy synthesis. This suggests a similar vulnerability in the developing brain to energy demands or the impact of mitochondrial insufficiency in the pathophysiology of pediatric glioblastoma formation.
In our disease of interest, m1555 A>G alone is unlikely sufficient to result in glioblastoma development, given the frequency of m1555 being 0.11% (in gnomAD, a large sequenced reference database)31 and the frequency of pediatric high-grade gliomas being less than 1 per 100 000 persons per year, with GBM incidence even lower. Indeed, only 3 subjects of our case group carry this variant. However, this association may lead to a possible deeper understanding of the etiology of glioblastoma. It is also notable that m1555 A>G was only observed in GBM cases, but not any other glioma subtypes, despite the much greater statistical power afforded to the higher case numbers in the non-GBM subtypes. This further strengthens that this polymorphism may be specifically pathogenically tied to GBM tumorigenesis.
One possible mechanism for m1555 risk is through its impact on the mitochondrial oxidative phosphorylation system. We hypothesize that m1555A>G could strain energy supply to key biological processes in brain including DNA repair, expressing tumor-suppressing genes, recruiting immunological agents to eliminate tumor cells, and initiating apoptosis, because of the high levels of brain activities and energy consumption. As a result, m1555 A>G variant may predispose individuals at higher risk for glioblastomas, possibly in concert with environmental risk factors. The presence of additional somatic MT variants in pediatric GBM tumors at a higher rate than other glioma subtypes11,12 suggests a particular sensitivity or dependence on aberrations in pediatric GBM etiology or pathophysiology. Interestingly, somatic mutation of m1555 was also observed in other cancers such as Ewing sarcoma.11 To date, there has been no report of genetic polymorphisms significantly associated with pediatric glioblastoma risk, likely due to lack of statistical power in small datasets assembled to date. However, candidate n-mt association analysis on our dataset discovered nuclear SNPs with significant case-control differences. In European children, the association between rs62036057 in WWOX and glioma risk was statistically significant. WWOX protein localizes to the mitochondria32 and is highly expressed in the brain. Its alteration has been associated with multiple cancers (for example esophageal cancer33 however, it was not clear if it was due to carcinogenesis or secondary effects of cancer therapies.34 Our findings at the germline level lend support to the former hypothesis. In Hispanic children, rs111709726 in EFHD1 was significantly associated with glioma risk. EFHD1 is associated with mitochondrial inner membrane, and acts as a calcium sensor for mitochondrial flash activation.35 It is also overexpressed in brain with a high confidence of spatial location within mitochondria. Similarly, its effect sizes were in the same direction in European subjects, but it was not statistically significant in Europeans nor in the entire study population. The PRKCE gene that was associated with pediatric glioma risk in our study is an intriguing candidate, as it has also been reported to be associated with both neuron growth and cancer cell invasion, for example prostate cancer.36
Our n-mt SNP association analyses suggest a potential interplay between mtDNA and n-mt DNA polymorphisms in contributing to glioblastoma risk. Indeed, some m1555 G allele carriers were also observed to carry identified n-mt risk alleles, mostly glioblastoma cases (Supplementary Table S6). We identify glioblastoma risk that is associated with both mitochondrial rRNA (encoded by mtDNA) and genes that are dehydrogenases/reductases or calcium sensors in mitochondria (encoded by n-mt DNA).
One major drawback of our study is the lack of a replication dataset. Unlike nuclear mtDNA variants which are relatively easier to obtain replication datasets, a comprehensive mt variant panel is not included on most SNP array panels, and therefore an independent external pediatric glioblastoma dataset to replicate m1555 is currently unavailable. We also have a relatively small sample size, and as a result, have computed wide confidence intervals. Our findings warrant future replication in studies of pediatric glioblastoma that include analysis of SNP arrays with mt variant probes, or via targeted mt variant genotyping.
In summary, while genetic risk for pediatric glioblastoma is still largely undefined, the role played by proteins encoded by mtDNA is worth investigating further along with other metabolic variants.
Acknowledgments
The content is solely the responsibility of the authors and does not necessarily represent the official views of the National Institutes of Health. The collection of cancer incidence data used in this study was supported by the California Department of Public Health as part of the statewide cancer reporting program mandated by California Health and Safety Code Section 103885; the National Cancer Institute’s Surveillance, Epidemiology and End Results Program under contract HHSN261201000140C awarded to the Cancer Prevention Institute of California, contract HHSN261201000035C awarded to the University of Southern California, and contract HHSN261201000034C awarded to the Public Health Institute; and the Centers for Disease Control and Prevention’s National Program of Cancer Registries, under agreement U58DP003862-01 awarded to the California Department of Public Health. The biospecimens and/or data used in this study were obtained from the California Biobank Program, (SIS request #311), Section 6555(b), 17 CCR. The California Department of Public Health is not responsible for the results or conclusions drawn by the authors of this publication. We thank Robin Cooley, Steve Graham, and Martin Kharrazi of the California Department of Public Health for advice and logistical support.
Funding
This work was supported by a research grant from the National Institutes of Health (R01 CA194189), United States.
Conflict of interest statement. The authors declare no competing interests.
Authorship statement. Conceptualization: JW, KW, XG. Methodology: JW, KW, XG, SL, AdS. Subject acquisition: LM, CM. Laboratory work: SSM, KA. Data curation: SL. Formal analysis: SL, XG. Writing-original draft: SL, JW. Writing-review & editing: All authors.
