


Abstract
There have been no evidence-based guidelines on the optimal schedule for the radiological assessment of 1p/19q-codeleted glioma. This study aimed to recommend an appropriate radiological evaluation schedule for 1p/19q-codeleted glioma during the surveillance period through parametric modeling of the progression-free survival (PFS) curve.
A total of 234 patients with 1p/19q-codeleted glioma (137 grade II and 97 grade III) who completed regular treatment were retrospectively reviewed. The patients were stratified into each layered progression risk group by recursive partitioning analysis. A piecewise exponential model was used to standardize the PFS curves. The cutoff value of the progression rate among the remaining progression-free patients was set to 10% at each scan.
Progression risk stratification resulted in 3 groups. The optimal magnetic resonance imaging (MRI) interval for patients without a residual tumor was every 91.2 weeks until 720 weeks after the end of regular treatment following the latent period for 15 weeks. For patients with a residual tumor after the completion of adjuvant radiotherapy followed by chemotherapy, the optimal MRI interval was every 37.5 weeks until week 90 and every 132.8 weeks until week 361, while it was every 33.6 weeks until week 210 and every 14.4 weeks until week 495 for patients with a residual tumor after surgery only or surgery followed by radiotherapy only.
The optimal radiological follow-up schedule for each progression risk stratification of 1p/19q-codeleted glioma can be established from the parametric modeling of PFS.
The MRI scan schedule in the surveillance period for 1p/19q-codeleted glioma was established based on evidence using the parametric modeling.
The piecewise exponential model used in the study is a valuable statistical tool that can be applied throughout oncology.
The optimal radiological assessment schedule in the surveillance period for 1p/19q-codeleted glioma was established based on evidence using the parametric modeling. The parametric modeling standardized progression-free survival (PFS) curve into several phases with a constant hazard constant within a phase. In the standardized PFS curve, the interval at which 10% of progression-free patients are newly progressed was recommended as the optimal interval for MRI scans. Subjects were stratified into 3 progression risk groups by recursive partitioning analysis, and each group was standardized by the parametric modeling. The piecewise exponential model used in the study is a valuable statistical tool that can be applied throughout oncology.
Although glioma with 1p/19q codeletion is a minor entity compared to that of the astrocytic lineage, it deserves particular attention by clinicians due to its established benefit from adjuvant treatment and unique favorable prognosis.1–4 This tumor, widely called oligodendroglioma, has been genetically characterized by glioma with 1p/19q codeletion and isocitrate dehydrogenase 1 or 2 (IDH 1/2) mutation.5 According to the histopathological malignancy, it is divided into WHO grades II (O2) and III (O3). The consensus on the best initial treatment for both O2 and O3 disease is maximal safe resection.6–9 For O2, a wait-and-see approach after surgery may be considered for low-risk patients, such as younger patients with no residual mass, while adjuvant treatment, such as radiotherapy (RT) alone or RT followed by chemotherapy (CTX), can be considered for high-risk patients.2–4,10,11 For O3, a wait-and-see approach is not a conceivable option after surgery, even after total resection, but adjuvant RT alone or RT followed by CTX using a combination of procarbazine, lomustine, and vincristine (PCV) or temozolomide (TMZ) alone should be considered.1,12,13 However, the optimal interval of regular radiological checkups after regular treatment in these tumors is still an ambiguous problem in daily clinical practice. Excessive assessments will often cause considerable socioeconomic burden because 1p/19q-codeleted gliomas are believed to be associated with longer overall survival (OS) than astrocytic gliomas such as glioblastoma.9,14 On the other hand, there is a chance that the early progression of aggressive subsets will not be detected if the evaluation interval is too broad.
We previously reported an appropriate radiological assessment schedule for high-grade astrocytic gliomas through parametric modeling.15 By using the same methodological approach, we stratified multi-institutional glioma patients with 1p/19q codeletion into each progression risk group and proposed an optimal radiological evaluation schedule during the surveillance period by using piecewise exponential modeling of progression-free survival (PFS).
Materials and Methods
Study Cohorts
A total of 234 adult patients with 1p/19q-codeleted glioma who underwent surgery between 1988 and 2015 in a total of 6 medical institutions in a single nation were retrospectively enrolled. The institutional review board of each institution approved this study. We defined regular treatment as adjuvant RT after maximal safe resection, depending on the patient’s condition, or adjuvant CTX after RT. In the case of O2, watchful waiting after total resection was also recognized as a regular treatment. Patients who received adjuvant CTX alone after surgery were excluded. PCV over 4 cycles or TMZ over 6 cycles was used as a chemotherapeutic regimen, and fractionated RT (54–60 Gy with 30–33 fractions) was conducted according to the patients’ condition. Patients who did not complete regular treatment due to early progression or treatment-related side effects were also excluded. Patients with obvious progression on baseline magnetic resonance imaging (MRI) after regular treatment were not included. Histopathological diagnosis was confirmed according to the WHO 2016 classification, and all subjects were confirmed to have the essential signature of 1p/19q codeletion and IDH 1/2 mutation by next-generation sequencing or immunohistochemical assay such as fluorescence in situ hybridization, although some subjects did not have information on IDH mutation. Considering the relatively long PFS duration of 1p/19q-codeleted glioma, patients who were followed up for less than 5 years after completing regular treatment without progression were excluded.
Radiological Assessment
Baseline MRI was performed within 3 months after completing regular treatment. A measurable T1-enhancing lesion or a prominent mass-forming lesion observed on the T2/FLAIR sequence on baseline MRI was defined as a residual mass.16 In most patients, a radiological assessment was performed at intervals of 2–6 months for 3 years after regular treatment, and the interval was extended to 6–12 months thereafter. All radiological data were reviewed and reassessed based on recent Response Assessment in Neuro-Oncology (RANO) criteria to define tumor progression, and RANO criteria for high-grade glioma (HGG) and low-grade glioma were applied for O3 and O2, respectively.16 PFS was defined as the time from the date of baseline MRI to the date when progression was first confirmed on MRI. Patients who had not developed progression by the last follow-up MRI were classified as censored, and PFS was defined as the date of the baseline MRI scan to the last MRI scan.
Risk Stratification and Statistical Analysis
All statistical analyses were performed using R version 4.0.4 (http://www.r-project.org). Kaplan–Meier (K–M) survival analysis was performed to evaluate PFS, and progression risk for 1p/19q-codeleted glioma patients was stratified through recursive partitioning analysis (RPA) by using the party package of R. RPA was performed with variables that significantly influenced the progression or survival of 1p/19q-codeleted gliomas according to previous studies, such as residual tumor on baseline MRI, enhancement of residual tumor, WHO grade, age, and adjuvant therapy modality.
A piecewise exponential model was used to standardize the PFS curve. We initially established candidate knots and added them one by one, leaving only the knots that minimized the Bayes information criterion value. A phase is a time interval between 2 adjacent knots, and within it, it has a fixed progression hazard constant. The hazard constant within a phase is the sum of the product of the hazard functions and time interval of each minute section in the PFS curve within the phase. A 10% progression rate was used as the cutoff value among the remaining patients at each observation period in the standardized PFS curve to optimize the MRI scan schedule. A proportional hazards model was used to reflect the patients’ clinical characteristics according to the different hazard constants generated by RPA stratifications. In the case of groups that did not satisfy the proportional hazard hypothesis with each other, they were not modeled together using the proportional hazard model but were modeled separately for each subgroup. Details on parametric modeling were described in our previous report.15
Results
Baseline Characteristics and Stratification
The baseline clinical characteristics of the patients in this study are summarized in Table 1. In total, 234 glioma patients with 1p/19q codeletion who successfully completed regular treatment were enrolled (137 with O2 and 97 with O3). Residual tumors after the end of regular treatment were radiologically confirmed in 65 patients with O2 disease (47.4%) and 51 with O3 disease (52.6%), and the WHO grade was not significantly related to the presence of a residual tumor after regular treatment. Among the patients with O2 disease, 39 received adjuvant RT only (28.5%), and 9 received adjuvant RT and CTX (6.6%), while among the patients with O3 disease, 44 and 53 received adjuvant RT only (45.4%) and RT followed by CTX (54.6%), respectively (Table 2). In the Cox regression analysis, PFS showed significant differences according to the presence of a residual tumor, enhancement of residual tumor, and adjuvant treatment modality (Supplementary Figure 1).
Baseline Clinical Characteristics of Study Population (n = 234)
| Glioma With 1p/19q Codeletion | ||
|---|---|---|
| Characteristics | Grade 2 (n = 137) | Grade 3 (n = 97) |
| Age, years | ||
| Median (range) | 46 (22–80) | 48 (22–76) |
| Sex, n | ||
| Male | 67 (48.9%) | 60 (61.9%) |
| Female | 70 (51.1%) | 37 (38.1%) |
| IDH status | ||
| IDH mutant | 98 (71.5%) | 63 (64.9%) |
| No data | 39 (28.5%) | 34 (35.1%) |
| MGMT promoter status, n | ||
| Unmethylated | 17 (12.4%) | 19 (19.6%) |
| Methylated | 71 (51.8%) | 57 (58.8%) |
| Not available | 49 (35.8%) | 21 (21.6%) |
| Time of diagnosis to study enrollment, months | ||
| Median (range) | 109 (58–394) | 115 (56–269) |
| Extent of resection, n | ||
| Total | 81 (59.1%) | 47 (48.5%) |
| Subtotal/partial | 46 (33.6%) | 45 (46.4%) |
| Biopsy | 10 (7.3%) | 5 (5.2%) |
| Standard treatment protocol, n | ||
| Surgery only | 89 (65.0%) | 0 (0.0%) |
| Adjuvant radiation therapy only | 39 (28.5%) | 44 (45.4%) |
| Adjuvant radiation therapy–chemotherapy | 9 (6.6%) | 53 (54.6%) |
| Residual tumor after standard treatment, n | ||
| No residual tumor | 72 (52.6%) | 46 (47.4%) |
| Residual tumor | 65 (47.4%) | 51 (52.6%) |
| Enhancing residual tumor | 11 (8.1%) | 15 (15.5%) |
| Overall progression state | ||
| Progression, n | 75 (54.7%) | 41 (42.3%) |
| Median progression-free survival, months (range) | 73 (4–218) | Not reached (3–220) |
| Overall survival state | ||
| Death, n | 16 (11.7%) | 31 (32.0%) |
| Median survival, months (range) | 195 (11–197) | 191 (13–228) |
Modalities of Adjuvant Treatment According to WHO Grade and Residual Mass
| Treatment | No residual mass (n = 118) | Residual mass (n = 116) | Pa | ||||
|---|---|---|---|---|---|---|---|
| O2 (n = 72) | O3 (n = 46) | Pb | O2 (n = 65) | O3 (n = 51) | Pb | ||
| Only surgery | 58 | 0 | .000 | 31 | 0 | .000 | .001 |
| Surgery + RT | 14 | 19 | 25 | 25 | |||
| Surgery + RT + CTX | 0 | 27 | 9 | 26 | |||
O2, WHO grade II 1p/19q-codeleted glioma; O3, WHO grade III 1p/19q-codeleted glioma; RT, radiotherapy; CTX, chemotherapy.
aChi-square test between groups with and without residual tumors.
bChi-square test between O2 and O3 groups.
All subjects were stratified into 3 progression risk groups using RPA: (1) patients with no residual tumor on baseline MRI, (2) patients with a residual tumor who received adjuvant RT followed by CTX, and (3) patients with a residual tumor who underwent only surgery or surgery followed by adjuvant RT only. The presence of a residual tumor on baseline MRI and adjuvant treatment modality were significant clinical parameters for stratification, but the WHO grade was not. The proportional hazard hypothesis was satisfied between groups with and without residual mass, but that was not satisfied between groups with different adjuvant treatment modalities. Therefore, we first performed the parametric modeling for the groups divided according to the residual tumor status using the proportional hazard model in which residual mass status was set as a covariate. Then, the patients with a residual mass were divided according to the modalities of adjuvant treatment, and the modeling for subgroups was conducted for each group. The scheme for stratification and the PFS curve according to risk groups are shown in Figure 1.
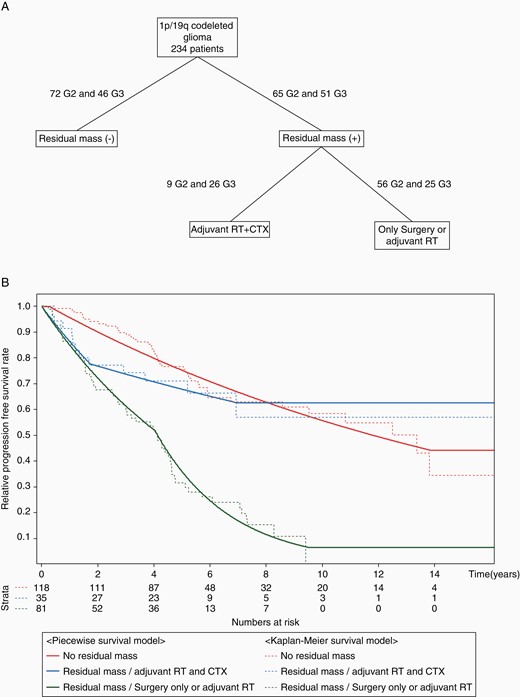
(A) The decision tree created to stratify glioma patients with 1p/19q codeletion after the completion of regular treatment by recursive partitioning analysis. (B) Piecewise exponential models and Kaplan–Meier survival plots with the risk of progression-free survival for the 3 risk groups of glioma patients with 1p/19q codeletion.
Parametric Modeling for the MRI Schedule in Glioma Patients With 1p/19q Codeletion
Disease progression occurred in 75 patients with O2 disease (54.7%) and 41 with O3 disease (42.3%). Parametric modeling using a piecewise exponential distribution for the PFS curve of all patients with 1p/19q-codeleted glioma resulted in a single phase with an even MRI interval after the initial latent period for the first 15 weeks (Figure 2A). The optimal follow-up interval of radiological assessments for all patients with 1p/19q-codeleted glioma was every 54.4 weeks (12.5 months) until 720 weeks (165.6 months) after the end of regular treatment, and 25% of patients remained progression free even after week 720 (Figure 2A).

(A) Radiological assessment schedule for all 1p/19q-codeleted glioma patients after the end of regular treatment established by the parametric model with an expected 10% progression rate among the remaining patients at the time MRI was scheduled. The initial 15 weeks is the latent period with no scheduled MRI. (B) Radiological assessment schedule for the risk group without a residual tumor. (C) Radiological assessment schedule for the risk group with a residual tumor. (D) Radiological assessment schedule for the risk group with a residual tumor who received adjuvant radiotherapy followed by chemotherapy after surgery. (E) Radiological assessment schedule for the risk group with a residual tumor who underwent surgery only or surgery followed by radiotherapy.
Parametric modeling for the subgroup of patients with or without a residual tumor on baseline MRI resulted in the same single-phase pattern following the 15-week latent period. Patients without a residual tumor were suggested to undergo MRI every 91.2 weeks (21.0 months) until 720 weeks after the end of regular treatment, and a total of 8 MRI scans were expected to be taken for patients without progression (Figure 2B). On the other hand, patients with a residual tumor were recommended to undergo MRI every 32.6 weeks (7.5 months) until 720 weeks after the end of regular treatment, and a total of 22 MRI scans were expected to be taken for patients without progression (Figure 2C). After 720 weeks of follow-up, the estimated progression-free rates were 44% and 10% for patients without and with a residual tumor, respectively.
Parametric modeling for patients with a residual tumor who were subsequently subclassified according to adjuvant treatment modality resulted in 2 phases. Patients with a residual tumor who received adjuvant RT and CTX were advised to undergo MRI every 37.5 weeks (8.6 months) until 90 weeks (20.7 months) after the end of regular treatment and every 132.8 weeks (30.5 months) until 361 weeks (83.0 months) thereafter (Figure 2D). An estimated 63% of patients would be progression free after 5 MRI scans and 361 weeks of follow-up. Patients with a residual tumor who underwent surgery only or surgery followed by adjuvant RT, the risk group with the most unfavorable prognosis for progression, were suggested to undergo MRI scans every 33.6 weeks (7.7 months) until 210 weeks (48.3 months) after the end of regular treatment and every 14.4 weeks (3.3 months) until 495 weeks (113.8 months) thereafter (Figure 2E). After 26 scans and 495 weeks of follow-up, 6% of patients would be progression free.
Sixteen patients with O2 disease (11.7%) and 31 with O3 disease (32.0%) died during our follow-up period, and the median OS times for patients with O2 and O3 disease were 195 months and 191 months, respectively. OS was significantly related to the WHO grade as well as the presence of a residual tumor, enhancement of residual tumor, and adjuvant therapy modality in the Cox regression analysis (Supplementary Figure 2). For ease in clinical practice, the guideline timetables for the optimal radiological assessments for all 1p/19q-codeleted glioma patients and patients in each risk group are presented in Figure 3.
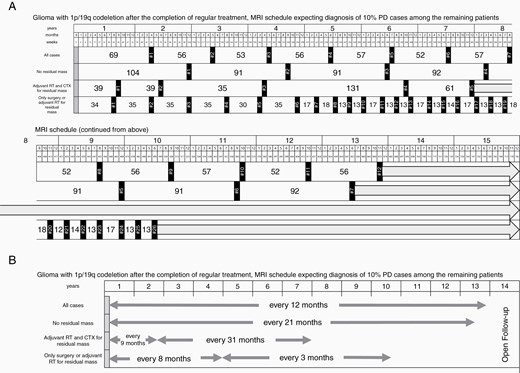
(A) Summary of the optimal radiological assessment schedule after the completion of regular treatment for glioma patients with 1p/19q codeletion and each risk stratification established by the parametric model with an expected 10% progression rate among the remaining patients at the time MRI was scheduled. (B) Simplified scheme of the optimal radiological assessment schedule after the completion of regular treatment for glioma patients with 1p/19q codeletion and each risk stratification.
Discussion
Although 1p/19q-codeleted glioma is a tumor with a more favorable outcome than other HGGs, it is still important to be aware of progression as soon as possible for the sake of both the patient’s quality of life and survival. However, the median OS of 1p/19q-codeleted glioma is longer than that of other HGGs (approximately 10 years for O2 and 5 years for O3).2,3,6,9,12,14,17 Therefore, it is crucial to establish an appropriate interval for the radiological assessment of 1p/19q-codeleted glioma to avoid unnecessary economic burden and inconveniences. Most of the management guidelines for gliomas do not provide an optimal MR assessment schedule separately according to the subclass of glioma or risk groups.7,8,18,19 The European Association for Neuro-Oncology guidelines recommend radiological follow-up every 3–6 months after regular treatment for both O3 and O2 diseases, in common with other HGGs, and the National Comprehensive Cancer Network (NCCN) guidelines suggest every 2–4 months until 3 years and every 3–6 months thereafter for O3 disease and every 3–6 months until 5 years and every 6–12 months thereafter for O2 disease.7,8 In both guidelines, the radiological evaluation schedule is collectively recommended for a single disease entity without risk stratification. We can provide more sophisticated guidelines for the optimal radiological assessment schedule for each risk stratification of 1p/19q-codeleted gliomas.
Upon modeling for subgroups of patients with a residual tumor, the MRI schedules were recommended as 2 phases. Interestingly, in these risk groups, the order of the close follow-up period (more frequent scan) and the regular follow-up period was reversed according to adjuvant treatment modalities. In particular, in patients with a residual mass who underwent surgery only or adjuvant RT only, the close follow-up period follows the regular follow-up period, that is, contrary to what is accepted in glioblastoma as well as other malignant neoplasms.20–22 In most cancers, it is known that the hazard constant for progression is not constant over time but gradually decreases. In our previous study, in glioblastoma, the close follow-up period was followed by a regular follow-up period in every risk group.15 In the present study, most of the patients with a residual tumor who underwent surgery only had O2 disease with a residual tumor less than 2 cm in size. We can presume that a relatively long time was required for the tumor to grow enough to be confirmed as progression on MRI in these patients, since the size of the remaining tumor was small, and its proliferating ability was relatively low. The 15-week latent period of the strata without residual mass in this study was also estimated to be due to the low intrinsic proliferating ability of disease that is not present in other HGGs.15 In this group, progression was extremely slow during the first few years, with only a 10% progression rate even at 2 years after the end of regular treatment. This may also be due to the low progression potential of 1p/19q-codeleted glioma.
The 33.6-week (7.7-month) MRI interval before 210 weeks and 14.4-week (3.3-month) interval after that recommended for the patients with the highest risk of progression are comparable to or slightly longer than those outlined in the NCCN guideline for 1p/19q-codeleted glioma.7 However, the 91.2-week interval recommended for patients without residual mass and the 132.8-week interval after 90 weeks suggested for patients with a residual mass who underwent RT and CTX may be too drastic in daily practice. This interval should be accompanied by close monitoring of clinical symptoms during the surveillance period, which will prevent potential neglect. Although the intervals are considerably longer than the recommended interval for 1p/19q-codeleted gliomas in the guidelines, no study has quantified the velocity of progression through modeling after progression risk stratification for 1p/19q-codeleted glioma before this study. This is a unique point of the present study.
A total of 44 patients with O3 disease who underwent surgery followed by adjuvant RT only were included in this study. Surgery followed by RT only was one of the evidence-based options for adjuvant treatment for O3 disease until 2 influential randomized controlled trials in 2013 reported that adjuvant RT followed by PCV increased both PFS and OS compared with adjuvant RT only in patients with O3 disease.1,13 We confirmed the benefit of adjuvant CTX for a residual mass in patients with O3 disease in this study. Moreover, this study recommended MRI intervals that are useful for patients who cannot receive enough cycles of CTX due to side effects or for institutions where adjuvant modalities are unavailable.
For parametric modeling, the cutoff value of the progression rate among the remaining progression-free patients was set to 10% at each MRI scan, which was the same as that in our previous study on astrocytic HGGs.15 Accordingly, a 14-year surveillance period was recommended for 1p/19q-codeleted gliomas, compared to the 4.5-year period suggested for anaplastic astrocytoma in the previous study, which reflects the malignancies of the tumors themselves. In this study, there was a stratum with a relatively short surveillance period of 6.9 years, but since that group had a relatively small number of patients (n = 35), it may be slightly longer if sufficient numbers of subjects are added. Considering the cost of MRI, medical accessibility, a nation’s health system, and the patient’s disease status, the cutoff value can be adjusted by each institution and applied to the R source code provided in the previous report.
A piecewise exponential modeling strategy for survival data with covariates is a valuable method for standardizing a K–M survival plot, particularly in oncology.23–26 Because several components within the survival plot are stitched together to form an exponential curve with a single hazard constant within a single phase, it is the most appropriate model considering the characteristics of the tumor and the optimal interval for radiological assessments. The essential aspect of piecewise exponential modeling is to obtain an optimized model close to the K–M survival plot without implausible hazard changes. As a result, guidelines that are easy to apply in clinical practice with 1 or 2 phases following the initial short latent period are recommended. Piecewise exponential modeling is a valuable statistical technique that can be used in various fields, such as evaluating cost-effectiveness for medical practice through standardization of a survival plot or predicting the survival plot of the time interval from when the survival data were omitted in clinical trials using extrapolation based on a piecewise exponential distribution.27,28 The method of objectively estimating the appropriate radiological evaluation schedule after the end of regular treatment in oncology using parametric modeling is widely applicable for any cancer.
Conclusions
We suggested the optimal radiological assessment schedule after regular treatment for each progression risk stratification of 1p/19q-codeleted glioma patients using piecewise exponential modeling.
Funding
This research was supported by the following grants: Bio & Medical Technology Development Program of the National Research Foundation of Korea (NRF) funded by the Ministry of Science and ICT (MSIT) of the Korean Government (NRF-2015M3A9A7029740 to C.-K.P.) and the Basic Science Research Program (NRF-2019R1A2C2005144 to C.-K.P., NRF-2020R1A2C3A01003550 to Y.K.) of the NRF funded by the Korean Government MSIT.
Conflict of interest statement. There are no disclosures that need to be reported by any of the authors.
Authorship Statement. Acquisition, analysis, or interpretation of data: all authors; radiological analysis: S.H.C.; histological analysis: J.K.W. and S.H.P.; drafting of the manuscript: H.K., J.L., C.-K.P., and Y.K.; critical revision of the manuscript for important intellectual content: all authors; parametric modeling and statistical analysis: J.L. and Y.K.; supervision: C.-K.P. and Y.K.
References
Author notes
These authors contributed equally to this work.
