


Abstract
Tumor heterogeneity underlies resistance and disease progression in glioblastoma (GBM), and tumors most commonly recur adjacent to the surgical resection margins in contrast non-enhancing (NE) regions. To date, no targeted therapies have meaningfully altered overall patient survival in the up-front setting. The aim of this study was to characterize intratumoral heterogeneity in recurrent GBM using bulk samples from primary resection and recurrent samples taken from contrast-enhancing (EN) and contrast NE regions.
Whole exome and RNA sequencing were performed on matched bulk primary and multiple recurrent EN and NE tumor samples from 16 GBM patients who received standard of care treatment alone or in combination with investigational clinical trial regimens.
Private mutations emerge across multi-region sampling in recurrent tumors. Genomic clonal analysis revealed increased enrichment in gene alterations regulating the G2M checkpoint, Kras signaling, Wnt signaling, and DNA repair in recurrent disease. Subsequent functional studies identified augmented PI3K/AKT transcriptional and protein activity throughout progression, validated by phospho-protein levels. Moreover, a mesenchymal transcriptional signature was observed in recurrent EN regions, which differed from the proneural signature in recurrent NE regions.
Subclonal populations observed within bulk resected primary GBMs transcriptionally evolve across tumor recurrence (EN and NE regions) and exhibit aberrant gene expression of common signaling pathways that persist despite standard or targeted therapy. Our findings provide evidence that there are both adaptive and clonally mediated dependencies of GBM on key pathways, such as the PI3K/AKT axis, for survival across recurrences.
Alterations in common core pathways are retained across GBM recurrences.
Significant transcriptional changes are observed over GBM progression.
Molecular profiling of GBM shows considerable intratumoral heterogeneity, which underlies treatment resistance and remains poorly characterized due to a confounding sampling bias by limited surgical resection beyond regions of MRI-based tumor enhancement. Improved efforts at precision medicine for GBM, especially at recurrence, warrant image-guided tissue sampling.
Glioblastoma (GBM), a World Health Organization (WHO) grade IV astrocytic tumor, is the most common and aggressive primary brain tumor in adults, with an overall 5-year survival rate of 5%. The molecular landscape of GBM offers prognostic and therapeutic relevance, and a diagnosis of GBM now requires an integrated histopathologic and molecular classification.1 Clinical trials employing targeted therapies against mutations and pathways known to be altered in GBM have yet to demonstrate a benefit for either up-front or salvage treatment.
GBMs exhibit substantial intratumoral heterogeneity which is thought to drive the phenotypic features of this malignancy, including aggressive parenchymal invasion, treatment resistance, and inevitable recurrence. GBM cells display a high degree of local dispersion, and tumors recur most commonly in the immediate vicinity of the primary excised tumor.2 The current standard of care includes maximal feasible resection of the enhancing (EN) tumor region, with further non-enhancing (NE) tumor resection as safely allowed, limited by functional regions of the brain.3,4 Radiotherapy targeting the EN disease combined with a wide surgical margin results in improved overall survival, but ultimately does not prevent relapse.4,5 To date, GBM cells infiltrating the brain parenchyma remain inadequately profiled despite their clinical significance. These cells6 may represent genetically and phenotypically divergent tumor cells requiring specific treatment, thus improved temporospatial molecular profiling across both EN and NE regions of GBM remains a significant unmet need. Finally, although concurrent and adjuvant temozolomide (TMZ) provides survival benefit,7,8 it is associated with additional mutations, including hypermutated recurrent tumors harboring mutations affecting DNA mismatch repair proteins.9–11
In this study, we characterize by exome and RNA sequencing a cohort of patient-matched sets of treatment-naïve GBM from the excised bulk of the tumor and recurrent tumors sampled from EN and NE regions. Our results identify commonly altered signaling pathways enriched in recurrent tumors and the emergence of posttreatment mutations.
Materials and Methods
A retrospective analysis of GBM tissue samples was performed. GBM samples were collected as part of an IRB-approved clinical trial protocol (NCT02060890) which recruited patients with recurrent/progressive GBM who were candidates for surgical resection as part of their clinical management. The study was a single-arm feasibility trial evaluating genomic profiling to inform the treatment of recurrent GBM, approved by the University of California San Francisco Institutional Review Board and by the Western Institutional Review Board (TGen); all study participants provided written informed consent prior to study entry. The genomic and clinical results of this feasibility study have been reported.12 Data from this study have been deposited in the database of Genotypes and Phenotypes (dbGaP) under accession number phs001460.v2.p1 (https://www.ncbi.nlm.nih.gov/projects/gap/cgi-bin/study.cgi?study_id=phs001460.v2.p1). As part of the study, tissue was taken from adjacent, NE regions of the surgical resection cavity at recurrence when possible. NE tissue was collected for 12 of the 16 participants. NE tissue biopsies were collected at the time of tumor resection of the contrast-enhancing tumor region. Locations of the acquired EN and NE tissue samples were estimated by the surgical team and recorded as screenshots and image coordinate values of the associated MRI images using Brainlab. Estimated distance between EN and NE samples was calculated using the 3-dimensional Cartesian coordinate annotations. The median estimated distance between NE and EN tissue samples was 18 mm (estimated range, 8–34 mm). For longitudinal analysis, archival fresh frozen tumor tissue or formalin-fixed, paraffin-embedded tissue blocks from the standard of care bulk resection of the primary tumor and/or previous progressive disease were obtained for 4 participants. In addition, longitudinal (matched primary, recurrent, and second or third recurrence) archival tumor tissue samples were obtained for 2 additional GBM patients (GBM-021 and GBM-022). Data available using accession PRJEB39059, accessible via http://www.ebi.ac.uk/ena/data/view/PRJEB39059. Archival recurrent GBM tumor tissue was previously sequenced for these patients (samples 7 and 8 in Ref. 12), and for this study archival primary and later recurrence tumor tissue samples were obtained for these patients for inclusion in the longitudinal analysis. Sample processing and sequencing information are available in Supplementary Methods.
Exome Sequencing Analysis
Whole exome sequencing (WES) was performed on 47 GBM tissue samples and their paired blood samples from 16 patients.
Quality control was performed on raw sequencing data using the MultiQC toolkit.13 Paired-end clean reads were aligned to GRCh37/hg19 using Burrows-Wheeler Aligner.14 Mapped reads were sorted with SAMtools,15 marking duplicates with Picard (http://broadinstitute.github.io/picard). Target coverage of exome sequencing had a mean of 571× for tumor samples and 340× for germline samples. One tumor sample presented low coverage (2×) and was excluded. Aligned reads were processed using GATK16 to remove low mapping quality reads (MPQ ≥20) and realigned in the genomic regions around potential indels. The quality scores were then recalculated for the cleaned BAM files.
Somatic single-nucleotide variants (SNVs) and indels were identified in tumors against matched germline sequences by integrating the results from 4 variant calling algorithms: Freebayes,17 MuTect,18 VarDict,19 and VarScan2.20 To minimize false positives, somatic variants were retained if they met the following criteria:
variant-supporting read count ≥2;
variant allele frequency ≥0.05;
average variant position in variant-supporting reads (relative to read length) ≥0.1 AND ≤0.9;
average distance to effective 3′ end of variant position in variant-supporting reads (relative to read length) ≥0.2;
fraction of variant-supporting reads from each strand ≥0.01;
average mismatch quality difference (variant − reference) ≤50;
average mapping quality difference (reference − variant) ≤50.
Somatic variants reported in the non-cancer databases (dbSNP v150, gnomAD v3, and 1000Genome v5b) with a minor allele frequency of ≥0.05 were classified as germline polymorphisms and excluded.
Somatic copy number was estimated from WES reads by CNVkit.21 GISTIC222 was used to integrate results from individual patients and identify genomic regions recurrently amplified or deleted across glioma samples.
LumosVar 2.023 was used to (1) jointly call SNVs and copy number variations across a set of patient samples, (2) estimate the proportion of cells containing each variant in each sample, and (3) group variants by the patterns they follow across samples. Each clonal variant group was manually categorized as increasing, similar, or decreasing across time points. Genes with coding variants in each set of clones were used in gene set enrichment analysis (GSEA) using the “GeneOverlap” R package using the “hallmark” and the “Reactome” gene sets from the MSigDB website.24–26 False discovery rates (FDRs) were calculated using the Benjamini–Hochberg method. For each sample, tumor purity was calculated using CNVkit; briefly, the largest region of deletion (ie, for most of the samples, this was chromosome 10) was assumed to have a clonal one-copy loss. A log2 fold-change was applied to calculate tumor purity as follows: 2−2*2^(log2FC) (see Supplementary Table 3 for tumor purity estimates).
mRNA Sequencing and Gene Expression Analysis
RNA sequencing quality was assessed through the MultiQC toolkit.13 Reads containing adaptors or more than 10% undetermined bases or more than 50% bases with a Phred quality score ≤5 were removed. Cleaned reads had an error rate mean of ≤2% and Q30 ≥90% for all samples. Reads were aligned to GRCh37/hg19 using STAR27; expression was quantitated at the gene level using featureCounts.28 Downstream analysis of gene expression was performed in the R statistical environment. GC correction was applied for the normalization step and upper quantile for the between phase. Pairwise comparisons were performed by differential expression analysis (2-sided Mann–Whitney–Wilcoxon [MWW] test, top and bottom 50 genes of the test statistics). Samples were clustered using the hierarchical clustering algorithm based on the Ward linkage method and Euclidean distance as implemented in R.
Gene Ontology (GO) enrichment and GBM gene expression-based classification29 were computed using the MWW Gene Set Test.30 The significant GO terms (q-value < 0.001, absolute normalized enrichment score >0.6) were analyzed using the Enrichment Map application of Cytoscape.31 In the network, nodes represent terms while edges represent known term–term interactions and are defined by the number of shared genes between the pair of terms. Node size is proportional to the number of genes in the category. To select overlapping gene sets, a cutoff of the overlapping coefficient (>0.5).
Master regulators (MRs) of the gene expression signature activated in the NE recurrence versus bulk tumor GBM subgroups were performed using the regularized gradient boosting machine algorithm as previously described.30,32 The transcriptional interactome comprised 300 969 (median regulon size: 141) interactions between a predefined set of 2137 transcriptional regulators and 12 656 target genes.
Immunohistochemistry
Immunohistochemistry (IHC) was performed at the University of California, San Francisco using a Ventana BenchMark autostainer. Tissue sections were immunostained with commercially available antibodies including anti-EGFR (Dako; M3563, H11), anti-phospho-RPS6 (Ser240/244; Cell Signaling Technology; 2215), anti-phospho-PRAS1 (PRAS40; Thr246; Cell Signaling Technology; 2997, C77D7), anti-PTEN (PTEN; Cell Signaling Technology; 9559, 138G6).
Results
Tumor Collection Scheme and Commonly Identified Genetic Aberrations in Patient Samples
To determine the signaling mechanism(s) driving recurrent GBM, we analyzed whole exomes and transcriptomes from a cohort of GBM tumors from 14 patients. Samples included matched primary and recurrent tumor and/or multi-region intratumoral sampling across MRI-guided EN and adjacent NE tumor regions (Figure 1A and B; Supplementary Figure 1 and Supplementary Table 1). Baseline patient characteristics and treatment regimens were previously published12 and clinical information is available in Supplementary Table 2. All patients had a histopathologic diagnosis of WHO grade IV GBM at disease onset except GBM-015, which progressed to GBM from initial diagnosis of WHO grade III anaplastic astrocytoma. All patients were treated for the primary tumor and at least one recurrence, if not second and third recurrences over time, likely accounting for long overall survival times provided in Supplementary Table 2. The landscape of genomic alterations as defined by SNVs recapitulates results from other cohorts33,34 identifying known frequently altered early drivers of GBM, including PTEN, CDKN2A, PIK3, TP53, NF1, and RB135 (Figure 1C and D), and 2 tumors displayed TMZ-induced hypermutation (Figure 1D). Individual tumors display alterations that are retained or divergent between the EN and NE regions. PI3K signaling pathway alterations were noted to be frequently retained at tumor recurrence and within intratumoral sampling, including PTEN and PIK3CG mutations across all GBM-007 samples, alterations of PTEN in GBM-001 and GBM-012, and alterations of PIK3C2G in GBM-003 and GBM-016 (Figure 1C and D). These findings converge on the importance of genetic alterations that activate the PI3K signaling pathway in GBM progression.
![Mutational landscape of primary tumors and multiple regions sampled within recurrences. (A) A schematic representation of how human glioma specimens were acquired, either via a standard debulking procedure (yellow surrounding the tumor) or on the basis of their MRI contrast enhancement (enhancing [EN] or non-enhancing [NE], yellow or blue dots, respectively) in the recurrences. (B) Representative T2-weighted magnetic resonance images demonstrating spatial location (yellow arrow) of glioma sample from EN and NE regions of recurrences. (C) The integrated landscape of somatic alterations occurring in 35 GBM samples from 12 patients. Rows and columns represent genes and tumor samples, respectively. Genetic alterations, patients, EN or NE, and tumor types (primary, recurrence #1, recurrence #2) are indicated. Tumor samples are sorted and grouped by patients. Top and right bar plots indicate the total number of somatic alterations per tumor and per gene, respectively. (D) Somatic alterations occurring GBM-012 and GBM-015, which exhibit a hypermutator phenotype.](https://oup.silverchair-cdn.com/oup/backfile/Content_public/Journal/noa/2/1/10.1093_noajnl_vdaa078/1/m_vdaa078f0001.jpeg?Expires=1750211770&Signature=o95wNZ8ea4qSeuTBcwRKqQgYHDxp5XyDv9-MozW4zIHRNbj92k0y7GwOSnSbYwkRMX~zUK1AzEPQgx9ZeBkqey7qPpKLQa9sFTACZTaAGpwnawanHLIf17WIekugLY86Rp7BbDbZhpqzj9G0BLwomE59iws57ZiPx3ICrvmMaIUEDCm0kp76rsVvDcdMRx4-yxdIPhF4U8UARNJaMUstYdhX7a8tjafH-1j-vKqjtZBAwEWzmElxhqAhM-6J7E-q5bnGrN2VesXOjLDthpDwclvRGgvwNdKklFKt7kIXowGFOKX85rMTQCDH-5w-Gz5RKImDIMFdMWFY~cj9ohPR~Q__&Key-Pair-Id=APKAIE5G5CRDK6RD3PGA)
Mutational landscape of primary tumors and multiple regions sampled within recurrences. (A) A schematic representation of how human glioma specimens were acquired, either via a standard debulking procedure (yellow surrounding the tumor) or on the basis of their MRI contrast enhancement (enhancing [EN] or non-enhancing [NE], yellow or blue dots, respectively) in the recurrences. (B) Representative T2-weighted magnetic resonance images demonstrating spatial location (yellow arrow) of glioma sample from EN and NE regions of recurrences. (C) The integrated landscape of somatic alterations occurring in 35 GBM samples from 12 patients. Rows and columns represent genes and tumor samples, respectively. Genetic alterations, patients, EN or NE, and tumor types (primary, recurrence #1, recurrence #2) are indicated. Tumor samples are sorted and grouped by patients. Top and right bar plots indicate the total number of somatic alterations per tumor and per gene, respectively. (D) Somatic alterations occurring GBM-012 and GBM-015, which exhibit a hypermutator phenotype.
Phylogenetic Trees Demonstrate Alternative Evolutionary Paths in GBM-007 and GBM-015
Patient tumors with longitudinal data were subsequently profiled for their individual genomic evolution via phylogenetic analysis alongside their corresponding clinical timeline (Figure 2; Supplementary Figure 3 and Supplementary Methods). GBM-007 (Figure 2A) demonstrates a branching pattern of evolution. EGFR amplification and other commonly identified early aberrations (CDKN2A, PTEN) were observed as truncal alterations, with additional EGFR mutations occurring across time. Enigmatically, the EN region of recurrence #2 branches earlier than the EN/bulk region of recurrence #1, despite arising at a later time in the clinical course, presumably highlighting the presence of these clones prior to clinical detection of recurrence. Moreover, the EN/bulk region of recurrence #1 harbors a mesenchymal/immune transcriptome and contained a high-quality neoantigen (INTS9 V283L), whereas the other samples retained a classical signature (see Supplementary Text for high-quality neoantigen calling methods). The mesenchymal subtype is known to be associated with the highest degree of immune infiltrates.29 GBM-015, which displayed TMZ-induced hypermutation, exhibits linear evolution and also harbored high-quality neoantigens. Of note, while several of these neoantigens are shared among the recurrent samples, there is also a unique neoantigen (ALPK2 E679K) found within recurrence #3 but not recurrence #2, highlighting neighboring sub-clonality emergent over time.
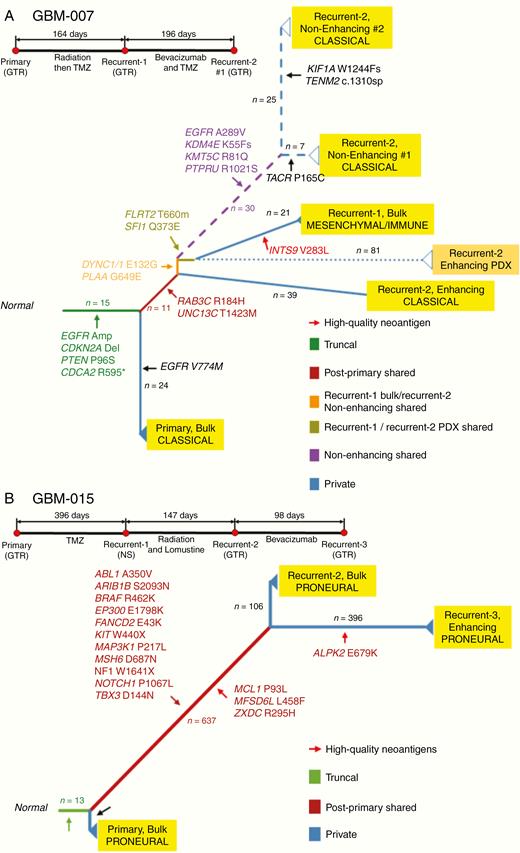
Phylogenetic trees constructed using genetic alterations in GBM-007 and GBM-015. GBM evolutionary trees in patients GBM-007 (A) and GBM-015 (B) and their brief clinical history. The longitudinal and spatial evolution was reconstructed by comparing the somatic alterations occurring in multiple tumors from an individual patient with a clustering approach. The length of branches is proportional to the number of accumulated mutations at each stage that is also reported over the branches. The color of the branch indicates truncal, shared, and private alterations as indicated. Driver genes, as well as high-quality neoantigens, are reported for each evolutionary stage. Transcriptional subtype classification is indicated for each tumor. Surgical annotations: GTR, gross total resection; STR, subtotal resection; NS, no surgery; NA, not applicable.
To assess the adequacy of patient-derived models to study tumor EN and NE regions, patient-derived xenograft (PDX) models were derived from recurrent tissues from 4 GBM patients (GBM-001, GBM-003, GBM-005, and GBM-007). Phylogenetic analysis of PDX tumors revealed close branching to the parent tumor tissue (Figure 2; Supplementary Figure 3). The PDX from GBM-007 branched closely to its cognate parent tumor, although notably gained 81 private mutations (Figure 2A).
Clonal Dynamics in Longitudinal Samples
Patient samples with longitudinal data available underwent a clonal evolution analysis within individual tumors. We utilized LumosVar 2.023 to group variants predicted to occur in the same clones and assessed the frequency of these variants across time (Figure 3; Supplementary Table 4).
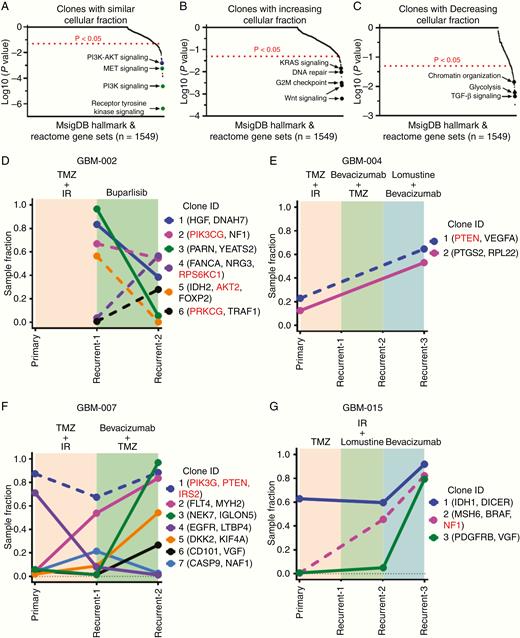
Evolution of clonal populations over time determined by LumosVar. Genes with coding variants in each set of clones were used in gene set enrichment analysis using the MSigDB web portal using both “hallmark” and the “Reactome” gene sets (A–C), with each clone manually categorized as increasing, similar, or decreasing across time points. Combined PI3K–AKT signaling approaches but does not meet significance (P < .05 and FDR <0.1 but >0.05) (blue circle). Graphical representation of changes in the sample fraction of clones in GBM-002 (D), GBM-004 (E), GBM-007 (F), and GBM-015 (G) over the course of treatment in each patient. Clonal alterations involved in the PI3K/AKT/mTOR signaling axis are denoted in red and represented by dotted lines.
We pooled all clones identified across longitudinal patient tumor samples in order to perform a supervised GSEA to determine which gene pathways appear within similar, increasing, or decreasing cellular fraction through tumor progression. Pathway determination was evaluated by assessment of the variants against 1549 gene sets (1499 Reactome gene sets and 50 cancer hallmark gene sets, Supplementary Table 7). Clones identified at a similar cellular fraction through tumor progression are significantly enriched (P < .05 and FDR <0.05) for PI3K, RTK, and MET signaling pathways (green circles, Figure 3A). Clones with increasing cellular fraction through progression include Wnt signaling, G2M checkpoint signaling, DNA repair, and Kras signaling pathways (P < .05, Figure 3B). Clones with decreasing cellular fraction throughout progression include TGF-β signaling, glycolysis, and chromatin reorganization pathways (P < .05, Figure 3C). However, for the pathways identified in increasing and decreasing cellular fraction, FDR was more than 0.1 and therefore requires a larger sample size to generalize these findings.
PI3K/AKT/mTOR pathway signaling mediators were frequently identified among the clones, highlighted in red in Figure 3D–G, and notably most often found within clones that either increased in sample fraction across tumor progression or remained similar (Figure 3D–G; Supplementary Figure 4). GBM-002 (Figure 3D) displayed PI3K pathway activation and received buparlisib, an investigational PI3K inhibitor; however, PI3K pathway-containing clones within this tumor were not significantly impacted by treatment. Buparlisib was shown in clinical trials to lack single-agent efficacy with incomplete PI3K signaling blockade in tumor tissue.36 GBM-015 exhibits a hypermutator phenotype (Figure 1G) and predictably harbors an emergent clone with an MSH6 alteration.
Longitudinal and Spatial Differences in Transcriptomic Signature
GBM tumors with longitudinal data were analyzed for transcriptomic signatures across primary tumors and recurrences (Figure 4A, inset a and b). No significant longitudinal change was observed for tumors taken together; however, individual tumors did display divergent transcriptome profiling within some recurrent samples according to the phylogenies displayed in Figure 2. Broad clusters of increased or decreased differentially expressed genes (DEGs) were shared among the primary and recurrent sample types (Figure 4B). Analysis of DEGs across primary and recurrent samples demonstrates enrichment of downstream mediator of the PI3K/AKT axis mTORC1 in the recurrent samples compared to the primary, where enrichment of mTORC is not observed (Figure 4C).
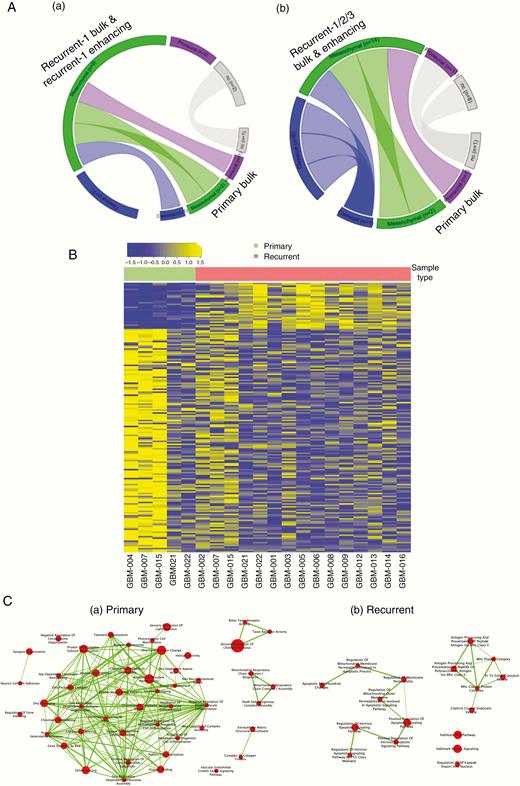
Changes over time demonstrated by descriptive transcriptomic analysis. (A) Circos plots showing subtype dynamics over time between the primary bulk and EN region of the recurrence (inset a) and between primary bulk and EN region of 2 subsequent recurrences (inset b). (B) Heatmap showing significantly differentially expressed genes between primary bulk and recurrent EN regions. (C) Gene ontology analysis showing activated signaling pathways in primary bulk (a) and recurrent EN regions (b).
Given the recurrent alterations noted in PI3K pathway mediators, immunohistochemical staining of GBM-021 and GBM-022 was performed. IHC identified functional activation of phosphorylated ribosomal protein S6 (RPS6) and phosphorylated PRAS40 across the primary tumor and both recurrences (Figure 5). EGFR amplification was detected in GBM-021 (data not shown), corresponding to increased staining over time.

IHC validation. Immunohistochemical staining demonstrating sustained activation of the PI3K/Akt pathway (Phospho S6, Phospho PRAS40, and PTEN) in GBM-021 and GBM-022 from primary to recurrence #1 and recurrence #2. Scale bar represents 50 µm.
We subsequently profiled the transcriptomic signature dynamics within the spatial transitions between bulk/EN regions and NE regions and showed a significant switch toward the proneural subtype in the recurrent, NE samples (P = .03; Figure 6A). Furthermore, a network of top 20 regulators of the bulk tumor (both primary excised bulk and EN region of the recurrences; green in Figure 6B) and NE region of recurrences (red) of proneural subtypes demonstrate an MR switch. Other subtypes did not exhibit a significant change in MRs across time and/or spatial locations (data not shown). By using the pan-glioma gene regulatory network of Mall et al.,32 we computed the differential activity of transcriptional regulators between these 2 proneural cohorts. We observed that the most active upstream regulators of proneural EN/bulk samples are characterized by transcription factors associated with the cell cycle (MCM2, MCM4, E2F), invasion, cell proliferation, and epithelial to mesenchymal transition. On the other hand, active regulators of proneural NE recurrence transcriptional programs are polarized toward neural development (MYTIL, MEF2C), differentiation (NEUROD2, NEUROD6), and other neuronal functions (NEFN, NEFL).
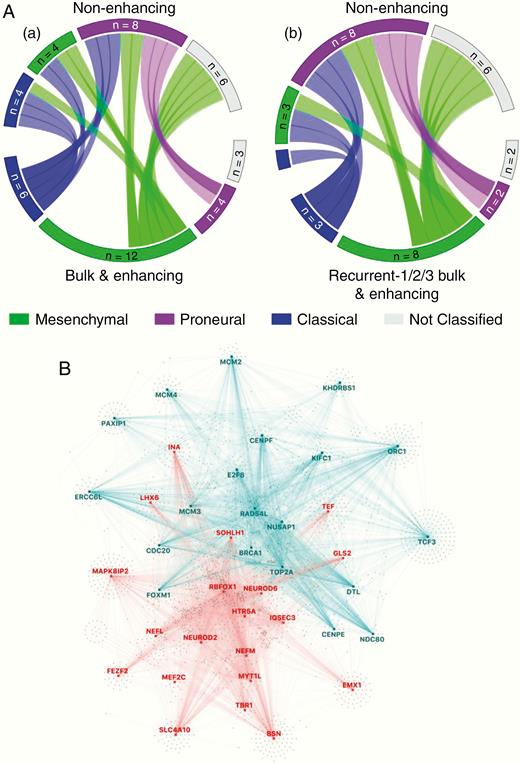
Spatial change demonstrated by descriptive transcriptomic analysis. (A) Circos plots showing subtype dynamics across space between bulk tumor and enhancing (EN) regions versus non-enhancing (NE; inset a) and between all recurrent bulk and EN tissue versus recurrent NE samples (inset b). (B) Master regulator analysis between proneural EN regions and proneural NE regions of recurrent tumors showing master regulators activated in EN (blue) and in NE (red) regions.
Discussion
The molecular profiling of intratumor heterogeneity across regions of MRI-based enhancement in recurrent GBM has so far received modest attention. Consequently, there is a current lack of characterization of the temporospatial evolutionary dynamics of the treatment-resistant residual cells in the peritumoral brain that populate GBM recurrences. Here, we examine WES and gene expression analyses in GBM using a distinct set of matched longitudinal surgical samples from both the grossly resected bulk tumor and EN and NE regions of progressive disease within a cohort of 14 patients. This dataset is limited in the number of patients as well as the number of tumors from which primary resection data were available for genomic profiling, with most samples taken across time points of recurrence. Additionally, the initial diagnosis of some tumors was made based on histopathologic criteria alone without an integrated molecular diagnosis available at the time. However, this data provides meaningful insight into GBM tumor progression via an increased understanding of individual versus cohort combined temporospatial dynamics along a clinically relevant timeline.
Within individual tumor profiles, we observed that the phylogenetic analysis of GBM-007 suggests that the EN region of recurrence #2 branched earlier than recurrence #1. This result is consistent with other reports demonstrating that tumor subclones infiltrating the parenchyma diverge early in tumorigenesis and represent the cell populations which escape the primary bulk tumor early and confer an inherited treatment-resistant profile.37 Individual phylogenetic tumor profiling is limited however in the ability to identify whether new mutations relative to conserved alterations drive tumor progression.
Interestingly, recurrence #1 of GBM-007 is characterized as a mesenchymal/immune subtype and harbors a unique high-quality neoantigen not shared among later recurrence samples of either EN or NE tumor. The disappearance of this signature suggests the possibility of lymphocyte infiltration and immune-elimination over time.38 Comparatively, the recent large cohort of temporally profiled GBMs in the GLASS Consortium found that neoantigens are not exposed to selective pressure during tumor progression.34 Yet, of note in GBM-007, the clinical time to recurrence was longer after the development of this mesenchymal/immune signature in recurrence #1 until recurrence #2, than from primary tumor resection to first recurrence (196 vs 164 days). Thus, further studies are warranted to investigate the role of immune cell activity and editing in individual GBMs, particularly in relation to intratumoral heterogeneity of immune cell infiltrates and duration of clinical response, given GBM is increasingly recognized as a tumor with significant involvement of peripheral and CNS-resident immune cells.39
We subsequently used LumosVar to identify groups of variants, which increased, decreased, or retained a similar proportion of the tumor fraction longitudinally. The characterization of these clones revealed that alterations in several key signaling pathways, including DNA repair, Kras, Wnt, and PI3K/AKT/mTOR, are shared in both primary and recurrent tumors, corroborating previous data40,41 and highlighting the persistence of these pathways in residual disease. On an individual tumor basis, clones containing alterations in members of the PI3K/AKT/mTOR pathway were overall found with similar or increasing frequency across time. Moreover, our DEG analysis identified increased mTORC signaling across primary to recurrent tumor time points. The subsequent functional validation of the activation of PI3K/AKT/mTOR pathway members by IHC revealed the overall stable activation of these mediators across time. Taken together, these results imply that standard treatment regimens did not significantly alter these key truncal aberrations. This small dataset is corroborated by the temporally profiled GBMs in the GLASS Consortium which found that overall truncal alterations remained stable across time as well as the recent study by Draaisma et al.42 showing that alterations in the PI3K/AKT/mTOR pathway specifically are maintained longitudinally. Of note, within the GLASS Consortium dataset, the presence of subclonal competition was notably associated with shorter overall clinical survival, indicating that the identification of subclonal selection may prognosticate tumor aggression. However, in our limited dataset, we are unable to correlate overall survival with clonal change. One tumor in our dataset did receive targeted therapy with the PI3K inhibitor buparlisib, although treatment did not result in a decreased sample fraction of clones with alterations in PI3K signaling. Buparlisib was subsequently shown to be ineffective in enacting meaningful pathway blockade in GBM tumors,36 making it difficult to determine whether or not these tumors would respond to effective PI3K inhibition as a treatment strategy targeting a key truncal aberration. The recent success of other PI3K inhibitors, however, including FDA approval of alpelisib for PIK3CA-mutated hormone receptor-positive advanced breast cancer,43 demonstrates that targeting this axis remains feasible.
We did not find a significant change in transcriptional subtype over time. However, there was a nonsignificant trend toward retention of or switch to the mesenchymal subtype at recurrence across bulk/EN regions, consistent with other studies,44 and suggesting some selection for this subtype with treatment.29,39 While spatial dynamics have been less well studied, intratumoral transcriptional subtype heterogeneity has been previously demonstrated.39 Our data revealed a significant switch toward a proneural subtype among NE regions as compared to bulk/EN. Given the regional differences, it is possible that the intrinsic characteristics of the spatially divergent microenvironments influence the transcriptional subtypes, and this remains to be clarified further by single-cell analysis at the tumor margins. Moreover, among comparative proneural samples across EN and NE tumor, we observed a spatially governed MR transcription factor switch, further suggesting external influence from microenvironment interactions may regulate dynamic tumor progression.
Tumor cell populations residing in the peritumoral brain outside of resection margins represent an elusive and critical population to profile and target during GBM tumor progression. Sampling of these regions is limited by safe resection surgically; however, recent advances in surgical technique including fluorescence-guided surgery have been shown to allow for greater gross total resection of GBM.45 Our data demonstrate that when genomic profiling includes samples from both the EN and NE regions of recurrences, both overlapping and distinct genomic profiles emerge, providing insight into the evolution of the tumor. Our limited cohort supports a continued advancement of methods to further safely acquire up-front tumor samples across MRI regions of contrast enhancement.
Funding
The Ben and Catherine Ivy Foundation, National Institute of Health/National Cancer Institute grants U01 [CA229345 to J.J.P.], U01 [CA220378 to N.L.T.], and U54 [CA210180 to N.L.T.].
Conflict of interest statement. None declared.
Authorship statement. Conception and design: J.J.P., S.A.B., D.W.C., J.D.C., M.D.P., J.M.T., M.E.B., H.D., and N.L.T.; acquisition of data: M.R.B., S.F.E., F.D., J.J.P., M.C., S.P., R.F.H., F.P.C., L.F., W.S.L., and H.D.; analysis and interpretation of data: M.R.B., S.F.E., F.D., J.J.P., M.C., S.P., R.F.H., F.P.C., L.G., M.E.B., A.I., H.D., and N.L.T.; drafting and revising the article: M.R.B., S.F.E., F.D., J.J.P., R.F.H., M.D.P., J.M.T., M.E.B., A.I., H.D., and N.L.T.; and tumor sample procurement: J.J.P. and M.D.P.
References
Author notes
These authors contributed equally to the work.
These authors are co-senior authors.
