


Abstract
While the association between diffusion and perfusion magnetic resonance imaging (MRI) and survival in glioblastoma is established, prognostic models for patients are lacking. This study employed clustering of functional imaging to identify distinct functional phenotypes in untreated glioblastomas, assessing their prognostic significance for overall survival.
A total of 289 patients with glioblastoma who underwent preoperative multimodal MR imaging were included. Mean values of apparent diffusion coefficient normalized relative cerebral blood volume and relative cerebral blood flow were calculated for different tumor compartments and the entire tumor. Distinct imaging patterns were identified using partition around medoids (PAM) clustering on the training dataset, and their ability to predict overall survival was assessed. Additionally, tree-based machine-learning models were trained to ascertain the significance of features pertaining to cluster membership.
Using the training dataset (231/289) we identified 2 stable imaging phenotypes through PAM clustering with significantly different overall survival (OS). Validation in an independent test set revealed a high-risk group with a median OS of 10.2 months and a low-risk group with a median OS of 26.6 months (P = 0.012). Patients in the low-risk cluster had high diffusion and low perfusion values throughout, while the high-risk cluster displayed the reverse pattern. Including cluster membership in all multivariate Cox regression analyses improved performance (P ≤ 0.004 each).
Our research demonstrates that data-driven clustering can identify clinically relevant, distinct imaging phenotypes, highlighting the potential role of diffusion, and perfusion MRI in predicting survival rates of glioblastoma patients.
PAM clustering detects 2 glioblastoma phenotypes, with a 16.4-month survival gap.
Incorporating clusters enhances survival prediction.
Binarized mean rCBF is a key prognostic parameter.
This study applying an unsupervised data-driven approach addresses an important need in the current understanding and management of glioblastoma by investigating the relationship between diffusion and perfusion characteristics and the overall survival of patients. Partition around medoids (PAM) clustering provided an approach to classify distinct imaging phenotypes and helped to improve patient stratification, as it identified high-risk and low-risk groups with significantly different survival outcomes. Our findings suggest that rCBF of the entire tumor determines the respective survival cluster, highlighting the importance of perfusion as a key imaging biomarker in predicting overall survival for glioblastoma patients. The insights gained from this research have the potential to inform clinical decision-making, improve prognostic models, and ultimately lead to better management and outcomes for patients with glioblastoma.
Glioblastoma (GB) is an aggressive and highly malignant primary brain tumor with a dismal prognosis. Despite extensive research and advancements in treatment strategies, the overall survival of GB patients remains unsatisfactory. One of the contributing factors to the challenging nature of GB is its inherent heterogeneity, where tumors exhibit diverse molecular and genetic profiles, as well as varied treatment responses. This heterogeneity results in different survival outcomes among patients with GB. Therefore, understanding and characterizing this heterogeneity is crucial for improving prognostic accuracy and guiding treatment decisions.1,2
Imaging plays a critical role in the diagnosis, characterization, and treatment planning of GB. Magnetic resonance imaging (MRI) has been used for accurate and non-invasive assessment of tumor characteristics as well as treatment response for optimizing therapeutic interventions, and prognostic stratification. In addition to conventional MRI images, functional sequences such as perfusion and diffusion MRI can provide valuable insights. Integrating advanced imaging techniques has shown promise in improving prognostic accuracy and understanding the underlying tumor biology.3–7
Perfusion-weighted imaging, such as dynamic susceptibility contrast (DSC) imaging, offers insights into the tumor vascularity and hemodynamics of tumors by measuring cerebral blood flow (CBF) and cerebral blood volume (CBV). These metrics offer critical information about tumor angiogenesis, vascular permeability, and the presence of necrosis, which are key factors influencing treatment response and overall survival in GB patients.8 Previous research has identified normalized, relative cerebral blood volume (nrCBV) as a strong predictor of overall survival (OS) in glioblastoma patients before radiotherapy.9 Additionally, high mean CBV was associated with increased disease progression in recurrent glioblastoma patients receiving bevacizumab.10,11
Diffusion-weighted imaging (DWI) assesses water molecule motion, aiding in characterizing tissue cellularity and tumor infiltration. Apparent diffusion coefficient (ADC), derived from diffusion imaging, inversely correlates with tumor cell density at diffusion times > 10 ms, providing valuable information for treatment assessment and survival prediction in glioblastoma patients.12–14 Recent studies have also shown ADC as a promising biomarker for novel therapeutic approaches, with increased relative ADC after treatment identified as an early imaging biomarker for OS prediction in patients receiving immune checkpoint inhibitors.15
Although perfusion and diffusion-based parameters have potential as prognostic biomarkers in glioblastoma patients, their integration into clinical routine remains challenging due to existing studies with small cohort sizes and complex parameters.16–19 Most of these studies focus on either diffusion or perfusion alone, disregarding combined diffusion-perfusion analyses. To overcome this, we utilized a data-driven, unsupervised approach to detect naturally occurring hidden patterns within the functional imaging data.20 Furthermore, clustering enables us to use all extracted imaging values and combine them into a single cluster variable, which increases sensitivity to subtle patterns not detected by traditional univariate analyses.
This work aims to unveil distinctive imaging phenotypes based on diffusion and perfusion parameters in newly diagnosed, untreated glioblastoma patients, and to explore their potential value for prognostic subtyping. Unsupervised partition around medoids (PAM) clustering was used to identify these phenotypes, followed by training tree-based machine-learning models to investigate the relationship between imaging parameters and phenotypes. We hypothesized that cluster membership plays a pivotal role in determining overall survival for glioblastoma patients.
Materials and Methods
Dataset
This retrospective study was approved by the local ethics committee of the University of Heidelberg and informed consent was waived (S-784 2018). Consecutive patients with a confirmed diagnosis of Isocitrat-dehydrogenase wild-type (IDH-wt) glioma according to the WHO 2021 Classification21 in the period between 2009 and 2019, who received a preoperative MRI at the Department of Neuroradiology of the Heidelberg University Hospital (Heidelberg, Germany) were included (n = 386). IDH and O6-methylguanine-DNA methyltransferase (MGMT) status based on DNA methylation assay was available for all patients.22 OS data were obtained from clinical documentation. If a date of death was not documented (eg because the patient was still alive or the patient was lost for follow-up), the date of the last documented contact was used, and the patient was censored. For further analysis, we portioned the data using the initial_split function from tidymodels23 with a proportion of 0.8 into a training and test dataset.
MRI Examinations and Imaging Postprocessing
Images were acquired in the routine clinical workup using a 3 Tesla MR system (Magnetom Verio, TIM Trio, or Skyra, Siemens Healthcare) with a 12-channel head-matrix coil. The imaging protocol followed international guidelines3 and included 3D T1-weighted images both before (T1) and after (cT1) administration of a bolus of 0.1 mmol/kg gadoterate meglumine (Dotarem, Guerbet), axial 2D FLAIR, T2-weighted images as well as diffusion-weighted images, and Dynamic Susceptibility Contrast (DSC) sequences. DSC-PWI was obtained with a T2*-weighted gradient-echo EPI sequence before, during, and after bolus injection of a standard dose (0.1 mmol/kg) of intravenous gadoterate meglumine.
A variant of HD-GLIO was used for an automatic deep learning-based tumor segmentation into necrotic, contrast-enhancing, and noncontrast-enhanced, T2/FLAIR hyperintense tumor compartments.24,25 MF, a neuroradiology resident with 5 years of experience, visually examined the segmentations and made any required corrections.
DWI were obtained with following parameters (TR = 5300 ms, TE = 90 ms, b = 0 and b = 1200 with isotropic gradients, pixel size = 1.769 mm/1.769 mm, image matrix = 130 × 130, slice thickness = 5 mm, flip angle = 90°, FoV 229 × 229 mm). ADC maps were calculated using the scanner’s built-in software. Before dynamic imaging, a 0.1 mmol/kg pre-bolus dose of gadoterate meglumine (Dotarem; Guerbet, Aulnay-sous-Bois, France) was administered to diminish T1 effects. DSC perfusion-weighted images were obtained with a T2*-weighted gradient-echo-planar sequence during the administration of a bolus of a standard dose (0.1 mmol/kg) of intravenous gadoterate meglumine. Twenty-six to 28 5-mm-thick sections were acquired with the following parameters: fat suppression, flip angle = 90°, FoV = 240 × 240 mm, image matrix = 128 × 128 mm. In total, 50–75 dynamic measurements were obtained.
Postprocessing of DSC-weighted MRI data for calculating rCBV and rCBF was performed with dedicated software (Olea Sphere v 2.3, Olea Medical), resulting in corrected rCBV maps based on an algorithm to correct the contrast agent extravasations effect.26–28 Next, image intensity correction of rCBV maps was performed by calculating Gaussian-normalized parameters (nrCBV).29 ADC, nrCBV, and rCBF maps were aligned to the corresponding T1-weighted sequence with a rigid registration using FSL (FMRIB software library, FSL, http://fsl.fmrib.ox.ac.uk/fsl/fslwiki/FSL).30 Then, mean values for ADC, nrCBV, and rCBF maps were extracted from the 3 tumor compartments as well as the whole tumor volume as potential imaging biomarkers.
Clustering
All the following analysis steps were performed on the training dataset only and later applied to the test dataset. Figure 1 shows a graphical representation of the study structure.
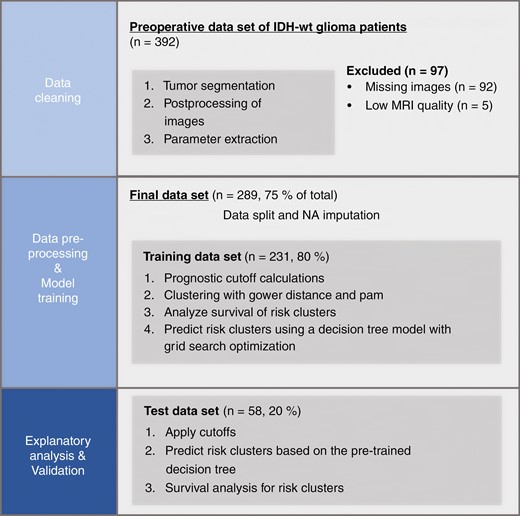
Graphical representation of the study structure. Only the training set was used to calculate cutoffs, for clustering and model training. The test dataset was used as a holdout dataset to provide an unbiased evaluation of the final model.
Cutoff determination.
—Prognostic thresholds were determined for each of the imaging biomarkers (n = 12). Thereby each parameter was fitted using a hierarchical Bayesian method under the framework of the Cox proportional hazards model for OS (implemented in the bhm package in R (https://cran.r-project.org/web/packages/bhm) using default parameters with B = 500 burn-in steps and R = 2000 replications for the Bayesian method as recommended by the developers).31–33 This approach was used to create simple, clinically applicable prediction models and to facilitate data imputation (see below).
Distance calculation and imputation.
—A distance matrix was calculated based on the Gower distance of each patient and the 12 binarized imaging parameters (ADC, nrCBV, and rCBF of 3 tumor compartments and whole tumor mask).
As the distance calculation cannot handle missing values, we used a specific imputation strategy based on expert knowledge. The missing values were only linked to nonexistent tumor compartments. Using information from recent studies, which demonstrated that the absence of contrast enhancement and less necrosis in glioblastoma is associated with better survival rates,34,35 we replaced the missing values with their corresponding binary values linked to enhanced survival outcomes, such as higher ADC and lower rCBV and rCBF.
PAM clustering.—Utilizing the PAM clustering approach was advantageous, given its ability to offer representative cluster members via the medoids, which are data points situated centrally, enhancing interpretability. Its compatibility with categorical variables, including our binary parameters, made it particularly suitable. Furthermore, the method demonstrated high stability, ensuring the reproducibility of the obtained clusters.
PAM clustering was performed with medoids as data points chosen as cluster centers implemented in the cluster package in R (https://svn.r-project.org/R-packages/trunk/cluster/).36 Here, the optimal number of clusters was determined using the average silhouette coefficient. To quantify cluster stability, the Jaccard index was estimated based on 500 bootstrapping samples.37
The calculated medoids were used to calculate Gower distances for the patients in the test dataset, with the smallest distance to the medoid determining the cluster membership of the patient.
Explanatory Analysis With Tree-Based Modeling
To evaluate the underlying influence of the imaging parameters on the cluster assignment, 2 different tree-based models were developed, that differ in their complexity, using the tidymodels library23,38: A bag-tree model (with 25 individual trees) and a simple decision-tree model. Hyperparameter tuning was done using a grid search based on a 10-fold cross-validation with tree depth and cost complexity for both models based on the best accuracy. Feature importance for the models was extracted with the vip package39 (https://github.com/koalaverse/vip/).
Statistical Analysis
All subsequent analyses were carried out with R (R version 4.2.2., R Foundation for Statistical Computing). Continuous data are presented as mean with SD or median with interquartile range, and categorical data as number (frequency). Wilcoxon–Mann–Whitney test was used to compare continuous and chi-squared tests to compare categorical data.
Kaplan–Meier method with the log-rank test was used to construct survival curves for OS in both clusters for the test dataset. Univariate and multivariate Cox proportional hazards regression modeling for OS was performed for the cluster affiliation. The model was adjusted for potential clinical confounders (age, sex, preoperative ECOG performance status), imaging confounders (tumor volume), and molecular confounders (MGMT promoter methylation status). The discriminate ability of the clusters was assessed by calculating the concordance probability (C index) of the different models and tested for significance by analysis of variance (ANOVA).
A P-value of <.05 was considered significant for all analyses.
Results
Patient Characteristics
Overall, 386 patients with newly diagnosed GB were screened and 289 (75%) of these fulfilled the selection criteria and were included. In detail, n = 92 patients were excluded due to missing perfusion data and n = 5 due to limited MRI quality (eg with pronounced motion artifacts). Demographics and image characteristics are summarized in Supplementary Table 1. The dataset was divided into a training and test dataset, respectively n = 231 and n = 57 patients as described above. Kaplan–Meier analysis showed no significant difference in OS between the training and test datasets (log-rank test P = .17) Supplementary Figure 1.
To simplify the prognostic models, we binarized the imaging parameters using the biomarker threshold model in the training dataset. Table 1 shows the optimal cutoff values for mean values of ADC, nrCBV, and rCBF, for the different tumor compartments as well as the whole tumor. Supplementary Figure 2 shows the Phi correlation of the different binarized parameters in the training data set.
Biomarker Thresholds for ADC, rCBF, and nrCBV for the Whole Tumor as Well as the Different Tumor Compartments. Both nrCBV and rCBF are Given in Relative Values With no Units, While ADC is Measured in 10−6 mm²/s.
| Parameter | nrCBV Cutoff | rCBF Cutoff | ADC Cutoff |
|---|---|---|---|
| Whole | 1.25 | 15.97 | 1397 |
| Necrosis | 0.57 | 11.48 | 1451 |
| Edema | 0.93 | 14.18 | 1186 |
| Contrast | 1.85 | 26.61 | 1048 |
| Parameter | nrCBV Cutoff | rCBF Cutoff | ADC Cutoff |
|---|---|---|---|
| Whole | 1.25 | 15.97 | 1397 |
| Necrosis | 0.57 | 11.48 | 1451 |
| Edema | 0.93 | 14.18 | 1186 |
| Contrast | 1.85 | 26.61 | 1048 |
Clustering Results
PAM clustering revealed the optimal number of 2 clusters based on the highest average silhouette coefficient (width = 0.33) with high stability (mean Jaccard index of 0.86 for cluster 1 and 0.89 for cluster 2).
Patients in cluster 1 had high ADC values and low values in perfusion in all 4 tumor areas with an overall cluster size of n = 96 patients, while patients in cluster 2 showed low ADC values and high perfusion values with a cluster size of n = 135 patients. Composition analysis of the clusters reveals different patterns of the clusters. Thus, showed cluster 1 a significantly higher proportion of patients with high ADC values in all tumor compartments compared to cluster 2 (corrected P-value < .001 each). On the other hand, cluster 2 showed a significantly higher proportion of patients with high nrCBV and rCBF values in all tumor compartments (corrected P-value < .001 each) Figure 2. Corresponding intersection plots for the 2 clusters are shown in Supplementary Figure 3.
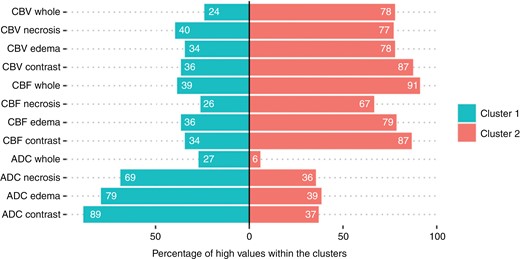
Percentages of high imaging parameters within the 2 clusters in the different tumor compartments. Cluster 1 shows a significantly higher percentage of patients with high diffusion values in all compartments, whereas cluster 2 shows higher perfusion values in all compartments (chi2-tests, P-value after Bonferroni correction < 0.001).
Analysis of tumor volume between these 2 clusters showed a significant difference in whole tumor volume with 92 ± 58 cm3 for cluster 1 and 75 ± 59 cm3 for cluster 2 (P = .02) as well as in edema volume with 65 ± 44 cm3 for cluster 1 and 49 ± 41 cm3 for cluster 2 (P = .003) in the training data set. However, there was no difference neither in contrast-enhancing and necrosis tumor volume (P > .27 each) nor edema volume in the test data set (P > .19 each), Table 2.
Demographic and Volume Data of the 2 Different Clusters in the Training and Test Datasets. Uncorrected P-Values. All significant values are bold and highlighted with an asterisk (*).
| Parameter | Training Set | Test Set | |||||
|---|---|---|---|---|---|---|---|
| Cluster 1 | Cluster 2 | P-value | Cluster 1 | Cluster 2 | P-value | ||
| Total no. of patients | 96 | 135 | NA | 17 | 41 | NA | |
| Sex [n (%)] | Female | 41 (43) | 65 (48) | 0.41 | 4 (24) | 19 (46) | 0.12 |
| Age [y] | Mean ± std. | 60 ± 15 | 62 ± 12 | 0.47 | 63 ± 12 | 62 ± 10 | 0.77 |
| MGMT status [n (%)] | Methylated | 35 (36) | 64 (47) | 0.1 | 6 (35) | 15 (37) | 0.93 |
| Preoperative ECOG [n (%)] | ECOG ≤ 2 | 91 (95) | 130 (96) | 0.58 | 17 (100) | 37 (90) | 0.18 |
| First-line therapy [n (%)] | Radiochemo therapy | 63 (66) | 86 (64) | 0.13 | 10 (59) | 20 (49) | 0.55 |
| Radiotherapy alone | 16 (17) | 18 (13) | 3 (18) | 6 (15) | |||
| Chemotherapy alone | 4 (4) | 6 (4) | 2 (12) | 2 (5) | |||
| Resection alone | 4 (4) | 1 (1) | 0 (0) | 0 (0) | |||
| BSC | 1 (1) | 0 (0) | 0 (0) | 1 (2) | |||
| Missing | 8 (8) | 24 (18) | 2 (12) | 12 (29) | |||
| Tumor volume [cm3 (mean ± std.)] | Whole volume | 92 ± 58 | 75 ± 59 | 0.02* | 92 ± 67 | 78 ± 47 | 0.61 |
| Edema volume | 65 ± 44 | 49 ± 41 | 0.003* | 70 ± 51 | 49 ± 34 | 0.19 | |
| Contrast volume | 18 ± 18 | 20 ± 21 | 0.27 | 14 ± 15 | 20 ± 23 | 0.19 | |
| Necrosis volume | 9.4 ± 12 | 6.7 ± 10 | 0.45 | 8.3 ± 14 | 8.3 ± 13 | 0.5 | |
Both clusters showed a difference in OS with a median OS of 20.6 months (95% CI, 17.1–28.4) for cluster 1 and 13.7 months (95% CI, 12.2-18.1) for cluster 2 (log-rank test P = .002) in the training data set as well as median OS of 26.6 (95% CI, 14.73–NA) for cluster 1, and 10.2 (95% CI, 6.94–18.4) for cluster 2 (log-rank test P = .012) in the test data set (Figure 3). Univariate Cox regression analysis demonstrated an association of cluster affiliation with OS (hazard ratio [HR] = 2.52 [95% CI, 1.19–5.33], P = .015, C index 0.626) in the test data set. In a Multivariate Cox regression analysis addition of cluster affiliation revealed a performance increase from a C index of 0.561–0.65 compared to a model with clinical data (age, sex, and preoperative ECOG status) alone (P = .004). Also, with the addition of MGMT status, the model with information on cluster affiliation (C index 0.669) performed better than the model without (C index 0.572, P = .001). By incorporating the tumor volume, the model with cluster information (C index 0.684) outperformed the same model without this information (C index 0.644, P = .002). All results are summarized in Table 3.
Performance Measures of Multivariate Cox Proportional Hazard Models Used to Predict OS. All significant values are bold and highlighted with an asterisk (*).
| Models | Parameter | HR, 95% CI | P-value | C index | P-value Model a vs. b |
|---|---|---|---|---|---|
| Model 1: cluster (univariate) | Cluster 2 | 2.52, 1.19–5.33 | 0.015* | 0.626 | NA |
| Model 2a: cluster + sex + age + ECOG | Cluster 2 | 2.99, 1.35–6.62 | 0.007* | 0.650 | 0.004 |
| Sex w | 0.55, 0.25–1.23 | 0.145 | |||
| Age | 1.03, 0.99–1.06 | 0.105 | |||
| ECOG ≤ 2 | 0.36, 0.10–1.27 | 0.113 | |||
| Model 2b: sex + age + ECOG | Sex w | 0.78, 0.36–1.68 | 0.524 | 0.561 | |
| Age | 1.02, 0.99–1.05 | 0.225 | |||
| ECOG ≤ 2 | 0.33, 0.09–1.16 | 0.084 | |||
| Model 3a: cluster + sex + age + ECOG + MGMT | Cluster 2 | 3.49, 1.54–7.91 | 0.003* | 0.669 | 0.001 |
| Sex w | 0.61, 0.28–0.135 | 0.223 | |||
| Age | 1.04, 1.0–1.07 | 0.032* | |||
| ECOG ≤ 2 | 0.25, 0.07–0.88 | 0.031* | |||
| MGMT unmeth. | 2.37, 1.09–5.12 | 0.029* | |||
| Model 3b: sex + age + ECOG + MGMT | Sex w | 0.83, 0.39–1.79 | 0.633 | 0.572 | |
| Age | 1.02, 0.99–1.05 | 0.144 | |||
| ECOG ≤ 2 | 0.24, 0.07–0.87 | 0.03* | |||
| MGMT unmeth. | 1.91, 0.91–4.03 | 0.088 | |||
| Model 4a: cluster + sex + age + ECOG + MGMT + Tumor volume | Cluster 2 | 3.55, 1.54–8.19 | 0.003* | 0.684 | 0.002 |
| Sex w | 0.62, 0.28–1.36 | 0.228 | |||
| Age | 1.04, 1.0–1.07 | 0.033* | |||
| ECOG ≤ 2 | 0.25, 0.07–0.88 | 0.031* | |||
| MGMT unmeth. | 2.43, 1.08–5.47 | 0.032* | |||
| Tumor volume | 1.0, 0.99–1.01 | 0.843 | |||
| Model 4b: sex + age + ECOG + MGMT + Tumor volume | Sex w | 0.81, 0.37–1.75 | 0.586 | 0.644 | |
| Age | 1.02, 0.99–1.05 | 0.134 | |||
| ECOG ≤ 2 | 0.25, 0.07–0.91 | 0.036* | |||
| MGMT unmeth. | 1.77, 0.80–3.89 | 0.158 | |||
| Tumor volume | 1.0, 0.99–1.0 | 0.541 |
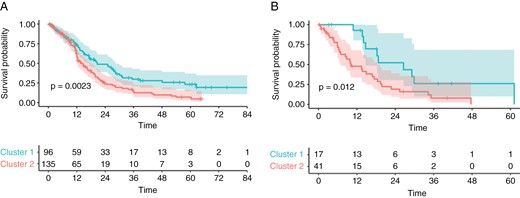
Kaplan–Meier plots of OS in the training data set (A) and test data set (B), stratified to low or high-risk groups according to clustering. Significance was calculated using the log-rank test.
Explanatory Analysis
The tuned bag-tree algorithm was trained with 25 bags, had a tree depth of 6, and a cost complexity of 237 * 10−6. The tuned decision tree had a tree depth of 4 and a cost complexity of 178 * 10−4. Examination of feature importance revealed rCBF in the whole tumor as the most important prognostic parameter in this model Supplementary Figure 4.
The structure of the decision tree trained is shown in Supplementary Figure 5. The tree structure reveals rCBF of the whole tumor, nrCBV, and ADC of contrast-enhancing tumor parts as the most important features. Averaging the importance values revealed rCBF, nrCBV, and ADC in descending order of sequence importance as well as contrast-enhancing area, whole tumor, noncontrast-enhancing area, and necrosis in descending order of area importance, in both models.
The validation in the test dataset unveiled for both models a high accuracy of 0.97 for the tuned bag-tree model and 0.93 for the tuned decision-tree model with respectively a misclassification rate of 3.5% (2 patients) and 7.0 % (4 patients). Complete classification metrics can be found in Supplementary Table 2. In addition, Supplementary Figure 6 shows the probability of cluster membership.
Discussion
Integrating advanced imaging techniques holds great promise for improving prognostic accuracy and understanding of the pathophysiology of glioblastoma. While previous studies have identified MRI diffusion and perfusion parameters as potential prognostic biomarkers, the translation of these findings into practical application remains challenging. The need for fast and reproducible patient classification methods that can be readily applied in a clinical setting is paramount. The present study used an unsupervised data-driven approach to survival cluster determination based on simple MRI diffusion and perfusion parameters in newly diagnosed pre-therapeutic glioblastoma. Our findings demonstrate that the incorporation of these clusters can potentially enhance prognostic performance compared to relying on clinical or morphological models for the prediction of OS.
Upon closer examination of the clusters, we observed that cluster 2, characterized by shorter survival, exhibited a significantly larger proportion of patients with high perfusion values in all tumor compartments. At the same time, the proportion of patients with high diffusion values was significantly smaller compared to cluster 1. These findings are consistent with previously published work, that identified glioblastoma patients with reduced survival based on elevated CBV levels, independent of confounding factors such as the extent of surgical resection or patient age.40–43 In another study focusing on a cohort of patients with recurrent glioblastoma treated with bevacizumab, those showing a greater decrease in rCBV during therapy had a higher survival rate in patients.44
The predictive power of diffusion and perfusion parameters in glioblastoma was also investigated by Hou et al., who determined cutoff values for the parameters similar to our approach.45 They also showed poorer survival for patients with perfusion values above the cutoff and poorer survival for patients with diffusion values below the defined cutoff. However, our cutoff values differed from those reported by Hou et al.’s study employed a regression tree analysis with only 36 patients, whereas we utilized a hierarchical Bayesian method under the framework of the Cox proportional hazards model.31–33
For the training dataset, the different clusters differed in tumor volume, but with a larger volume for the cluster with better OS. This difference is most likely due to the difference in noncontrast-enhancing volume, and the data on peritumoral edema as a predictive parameter in glioblastoma patients are very inconsistent.46–48
Our study, which encompasses 298 patients, represents one of the largest patient populations investigating the predictive power of perfusion and diffusion imaging. Through the implementation of 3 multivariable Cox regression models, we showed that the addition of cluster membership outperformed clinically and morphologically based models alone. Notably, each model indicated the independent significance of cluster membership, while variables such as sex, age, and tumor volume did not exhibit a significant association with OS.
At first glance, these results appear to be inconsistent with the findings reported by Burth et al. in 2016.49 In their study of n = 125 newly diagnosed glioblastomas, they investigated the relevance of clinical data in conjunction with ADC and rCBV for predicting OS and progression-free survival (PFS). Their multivariate Cox regression model revealed significance only in the clinical features, with imaging parameters showing no significant impact on survival outcomes. However, it is essential to recognize that our approach differed substantially from that of Burth et al. While they examined the individual influence of the 10th and 90th quantiles of the imaging parameters, we used an unsupervised data-driven approach to form survival clusters based on nrCBV, rCBF, and ADC. Subsequently, we integrated these clusters into our models, enabling us to combine information from perfusion and diffusion patterns. This approach provided a comprehensive perspective that considers naturally occurring patterns in the interaction between multiple imaging parameters, potentially capturing nuances that single quantile-based analysis might miss. Considering these different methodological approaches, it is challenging to directly compare our findings with those of Burth et al. Instead of being contradictory, our work should be viewed as a valuable complement to their study.
To determine the relative impact of the different imaging parameters on cluster membership tree-based machine-learning models we used 2 different models that differ in their complexity and interpretability.
Both models, the bag-tree and decision-tree, highlighted that rCBF from the whole tumor was the most important parameter for determining clusters. Additionally, rCBF and contrast-enhancing area were identified as the most important sequence and compartment, respectively. These findings are consistent with the widely accepted standard, which emphasizes that contrast-enhancing tumor size is a suitable surrogate biomarker for assessing disease burden and treatment response assessment in glioblastoma.50
This study has some limitations. (i) Although the survival cluster approach appears promising, only a monocentric data set without external validation was used here. In the future, the proposed risk model must undergo validation to confirm its value in stratifying the survival of patients newly diagnosed with glioblastoma. Nevertheless, our study represents one of the largest patient populations investigating the predictive value of perfusion and diffusion imaging. Using a train-test split we ensured independent validation without data leakage. (ii) The sample size was not determined by a power analysis but through the availability of the data. (iii) The retrospective design may introduce potential confounding factors, including incomplete data and reliance on existing medical records.
In summary, using a data-driven unsupervised technique we were able to identify clinically relevant, distinct imaging phenotypes in diffusion and perfusion parameters, which improve the performance of predicting survival rates of newly diagnosed glioblastoma patients.
Conflict of interest statement
None declared.
Funding
M.S. and M.F-D. are funded by the Physician-Scientist Program of Heidelberg University, Faculty of Medicine. P.V. is funded through an Else Kröner Clinician Scientist Endowed Professorship by the Else Kröner Fresenius Foundation (reference number: 2022_EKCS.17). W.W., T.K., F.S., M.B., and P.V. are funded by the Deutsche Forschungsgemeinschaft (SFB 1389).
Authorship statement
Study design, data processing, and statistical analysis by M.F-D. and M.S. Data collection by M.F-D., M.S., T.K., W.W., and F.S. Data interpretation by M.S., M.F-D., P.V., and M.B. First Manuscript draft by M.F-D. All authors critically revised the manuscript for important intellectual content and approved the final version.
Data Availability
PAM clustering with example data will be available at https://github.com/NeuroAI-HD/functional-clustering upon acceptance.


