


Abstract
Diffuse intrinsic pontine gliomas (DIPG/DMG) are devastating pediatric brain tumors with extraordinarily limited treatment options and uniformly fatal prognosis. Histone H3K27M mutation is a common recurrent alteration in DIPG and disrupts epigenetic regulation. We hypothesize that genome-wide H3K27M-induced epigenetic dysregulation makes tumors vulnerable to epigenetic targeting.
We performed a screen of compounds targeting epigenetic enzymes to identify potential inhibitors for the growth of patient-derived DIPG cells. We further carried out transcriptomic and genomic landscape profiling including RNA-seq and CUT&RUN-seq as well as shRNA-mediated knockdown to assess the effects of chaetocin and SUV39H1, a target of chaetocin, on DIPG growth.
High-throughput small-molecule screening identified an epigenetic compound chaetocin as a potent blocker of DIPG cell growth. Chaetocin treatment selectively decreased proliferation and increased apoptosis of DIPG cells and significantly extended survival in DIPG xenograft models, while restoring H3K27me3 levels. Moreover, the loss of H3K9 methyltransferase SUV39H1 inhibited DIPG cell growth. Transcriptomic and epigenomic profiling indicated that SUV39H1 loss or inhibition led to the downregulation of stemness and oncogenic networks including growth factor receptor signaling and stemness-related programs; however, D2 dopamine receptor (DRD2) signaling adaptively underwent compensatory upregulation conferring resistance. Consistently, a combination of chaetocin treatment with a DRD2 antagonist ONC201 synergistically increased the antitumor efficacy.
Our studies reveal a therapeutic vulnerability of DIPG cells through targeting the SUV39H1–H3K9me3 pathway and compensatory signaling loops for treating this devastating disease. Combining SUV39H1-targeting chaetocin with other agents such as ONC201 may offer a new strategy for effective DIPG treatment.
Small-molecule epigenetic screen identifies chaetocin as a potent inhibitor of DIPG.
H3K9 methyltransferase SUV39H1, a target of chaetocin, is required for DIPG growth.
Combination of chaetocin with ONC201 synergistically enhances antitumor efficacy.
The prognosis for individuals with DIPG is extremely poor. Effective treatment options are currently lacking. Here, we identified chaetocin, a fungal metabolite, as a small-molecule epigenetic compound with potent activity against H3K27M DIPG tumor cells in vitro and in vivo. Our transcriptomic and epigenomic profiling indicated that chaetocin targets and suppresses the H3K9me3 methyltransferase SUV39H1, leading to the inhibition of DIPG tumor growth in part by downregulating the stemness-related genes and growth factor signaling pathways. Our analyses further revealed that DIPG cells exhibit adaptive neuronal signaling such as the DRD2 signaling pathway as a compensatory mechanism to resist treatment. We found that a combination of chaetocin and a DRD2 antagonist ONC201 had synergistic effects against DIPG cell growth. Overall, our study sheds light on a new therapeutic vulnerability in DIPG through the SUV39H1–H3K9me3 epigenetic pathway and compensating signaling loops, pointing to a strategy for effectively treating DIPG.
Diffuse midline gliomas (DMG) such as diffuse intrinsic pontine glioma (DIPG) are devastating childhood brain tumors that occur along the midline of the brain.1–3 DIPG usually infiltrates the brainstem and pons critical for respiration and motor activity, and patients are not good surgical candidates due to its sensitive location. Despite multiple aggressive chemotherapy regimens and radiotherapy, the median overall survival of DIPG patients is only 9–11 months with a 5-year survival rate of less than 1%.1–3
Genomic analysis showed that most DIPG tumors are characterized by mutation of lysine (K) 27 to methionine (M) in histone H3.1 or H3.3 (H3.1K27M and H3.3K27M, respectively) in the genes encoding histone H3,4,5 but a subset of DIPG tumors have wild-type histone H3.3.6 The H3K27M mutation has been shown to interfere with the normal functioning of PRC2 (polycomb repressive complex 2) and thus affects the methylation status of H3K27. Oncohistone H3.3K27M increased expression of genes with bivalent chromatin marks of activating (eg, H3K4me3) and repressing (eg, H3K27me3) modifications,7 leading to the activation of oncogenes or repression of tumor suppressor genes. The mutation also inhibits the ability of PRC2 to spread or expand H3K27me3 domains from nucleation sites, leading to a loss of normal repression of gene expression in the regions affected.8–10 We hypothesize that genome-wide epigenetic dysregulation induced by the H3K27M mutations makes tumors vulnerable to epigenetic targeting. Consonantly, previous chemical screens showed that histone deacetylase (HDAC) inhibitors, EZH2 inhibitors, and JMJD3 inhibitors exhibit activity against DIPGs.11–14 However, clinical trials with these inhibitors in DIPGs have not been successful, suggesting that targeting alternative epigenetic pathways would be needed to improve prognosis.
In this study, through a screen of unbiased epigenetics-focused compound libraries, we identified chaetocin as a small-molecule compound with activity against multiple H3.3K27M- and H3.1K27M-expressing patient-derived DIPG cell lines. Our results demonstrate that chaetocin selectively inhibits the growth of DIPG cells but not normal astrocytes in vitro and inhibits the growth of DIPG tumors in xenograft models, prolonging survival. Silencing of the gene that encodes H3K9 methyltransferase SUV39H1, a target of chaetocin,15,16 inhibits DIPG cell growth in part by downregulating stemness and growth factor signaling pathways. Strikingly, we observed adaptive upregulation of neuronal signaling activity such as the dopamine receptor DRD2 pathway as a compensatory signaling mechanism conferring treatment resistance. Consistently, we found that the combination of SUV39H1 inhibition and blockade of DRD2 signaling with ONC201 had synergistic negative effects on tumor cell growth. Thus, our studies reveal a targetable SUV39H1–H3K9me3 epigenetic pathway and its compensating signaling loop as a therapeutic vulnerability in DIPG.
Methods
Animal Experiments
Immunodeficient NOD SCID gamma (NSG) mice were obtained from the Cincinnati Children’s Hospital Medical Center (CCHMC) animal core. DIPG cells (1 × 10⁵) were stereotactically injected into the pons region of 8-week-old immunodeficient NSG mouse brains, followed by vehicle (10% DMSO and 90% corn oil) and chaetocin (0.5 mg/kg) treatment at Dpi 7 with i.p. injection every other day. Animals were monitored weekly by bioluminescence using IVIS in vivo imaging system. The mice were randomized into individual groups. The animal studies were approved by the IACUC (Institutional Animal Care and Use Committees) of the Cincinnati Children’s Hospital Medical Center, United States.
Cell Culture
The DIPG cell lines6 were cultured in the tumor stem medium (TSM) basic medium supplied with B27(-vitamin A), hEGF, hFGF, h-PDGF-AA, h-PDGF-BB, and Heparin.17 Normal human astrocyte (NHA) cell line was purchased from Sciencell (Cat. No. 1800), and cultured in Dulbecco’s Modified Eagle Medium (DMEM) medium supplied with 10% fetal bovine serum (FBS), N2 supplement, and penicillin–streptomycin. The human neural stem cell line was purchased from Cell Applications (Cat. No. HS820K-20f) and cultured in a human neural stem cell growth medium.
Small-Molecule Epigenetic Screen
A panel of 398 epigenetic compound library was assembled from TargetMol (Cat#L1200) and Cayman Epigenetics Library (cat# 11076) for screening drug sensitivity of DIPG cells; each compound was plated in 4 concentrations (10 µM, 1 µM, 100 nM, 10 nM) in triplicate in 384-well format. Early passage cells cultured from autopsy or biopsy tissue were plated at a density of 2500 cells per well and incubated at 37°C with humidified 5% CO2 for 3 days. Cell viability was determined by the CellTiterGlo luminescent assay per manufacturer’s instructions. IC50 values were determined by a nonlinear best-fit method using Excel Solver.
Vectors, shRNA, and Lentivirus Production
Lenti-shRNAs against SUV39H1 were cloned into pGreen-puro vector. To produce lentiviruses, HEK293T cells were co-transfected with shRNA or GFP vector packaging using Lipofectamine 3000 reagent (Life Sciences). Concentrated viruses were used to cells (multiplicity of infection [MOI] = 5) overnight in the presence of 10 μg/mL polybrene. Cells were selected and maintained with puromycin (2 μg/mL). Gene expression was verified by western blot or real-time PCR.
Cell Proliferation and Neurosphere Formation Assays
For the cell proliferation assay, cells were plated in 96-well plates at a density of 3 × 10³ in 100 µL medium per well in the 384-well plate, or treated with chaetocin and/or ONC201, TRAIL. Cell viability was determined with the CellTiterGlo assay (Promega, cat# G7570) or WST-1 cell proliferation assay (Takara, cat# MK400) according to the manufacturer’s instructions.
Western Blotting and Immunostaining
DIPG cells were lysed in radioimmunoprecipitation assay buffer (RIPA) lysis buffer containing protease and phosphatase inhibitors (Complete-Mini; Roche-Boehringer) for western blotting. Brains were processed for vibratome and paraffin sectioning as previously described.18 We used antibodies against TUBULIN (CST, cat# 2144s), GAPDH (Invitrogen, cat# AM4300), H3K9me3 (CST, cat# 13969s), SUV39H1 (CST, cat# 8729s), and H3K27me3 (Millipore, cat# 07-449), Ki-67 (Thermo Fisher Scientific, cat# RM 9106-S0), cleaved caspase 3 (CST, cat# 9661s), BrdU (BD Pharmingen, cat# 555627). HRP-conjugated secondary antibodies were used from Jackson ImmunoResearch Laboratories.
Soft Agar Assay
Prepared 2× DIPG medium with 1% agar to generate 1 mL 0.5% base layer each well in 6-well plates. Mixed 3000 DIPG cells with 7% agar: 2× DIPG medium (1:1), and seed 1 mL cell mixture to each well. Cultured cells for 1 week, then treated cells with chaetocin or irradiation, followed by Soft agar assay for 3 weeks. Stained plates with 0.1% Crystal violet in 10% ethanol for 30 minutes, washed wells with dH2O several times, and then imaged and counted colonies.
RNA Sequencing, CUT&RUN-Seq, and Data Analysis
Total mRNAs of DIPG cells were extracted by RNeasy Mini Kit (Qiagen) for RNA sequencing. Analysis of differential expression genes (false discovery rate [FDR] < 0.05 and fold changes log2 > 2) was performed using the DESeq2 package from R 4.0.2 using raw gene counts as an input. Heatmaps were drawn using the pheatmap package from R. CUT&RUN was performed following the published protocol.19 The reads in FASTQ format were first subjected to quality control and duplicate read removal using the programs FastQC v0.11.7, Trim Galore! v0.4.2 and cutadapt v1.9.1, and BOWTIE v2.3.4.1. CUT&RUN heatmap was generated by computeMatrix and plotHeatmap of deepTools (https://deeptools.readthedocs.io/en/develop/).
Statistical Methods
All quantification and analyses were done using Microsoft Excel and GraphPad Prism 5.00 (www.graphpad.com). Statistical analysis was performed using 2-tailed unpaired Student’s t-tests or 1-way ANOVA test was performed by multiple comparisons. Data are shown in dot plots, or histograms as mean ± SD, P < .05 was considered to be significant. Significance was set as P < .05, unless otherwise indicated.
Data Availability
All the RNA-seq and CUT&RUN-seq data have been deposited in the NCBI Gene Expression Omnibus (GEO) under accession number GEO: GSE225029. H3K9me3 ChIP-seq data from glioma stem cell (GSC) and U937 cells were downloaded from the GEO public resource with the accession numbers GSM3120523, GSM3120524, GSM4131805, and GSM4874843.
Results
High-Throughput Small-Molecule Screen Identifies Chaetocin as a Potent Inhibitor of DIPG
We hypothesized that epigenetic dysregulation caused by H3K27M could create druggable vulnerabilities in DIPG tumor cells. To identify these vulnerabilities, we screened an epigenetic compound library in 4 patient-derived DIPG cell lines, SU-DIPG17 and SU-DIPG25 cells, which have the H3.3K27M mutation, and SU-DIPG21 and SU-DIPG36 cells, which have the H3.1K27M mutation,20 and a NHA cell line to identify compounds that inhibit the growth of DIPG but not normal astrocytes. The library consisted of 398 unique compounds that target a variety of epigenetic regulatory molecules and pathways. We used the area under the curve (AUC) to distinguish active from inactive compounds.14 Inhibitors with AUC values less than 2 in all 4 tumor cells but not in NHA were classified as “hits.” Of the compounds screened, a set of approximately 20 compounds were effective against DIPG tumor cell lines and not normal astrocytes (Figure 1A, B). These hits included compounds that had previously shown activity in preclinical and clinical settings toward DIPG including inhibitors of HDACs, histone methyltransferases, and Sirtuin as well as Aurora and PI3K signaling effectors (Figure 1C). Consistent with previous chemical screens,13,14 we identified a set of HDAC inhibitors (eg, romidepsin, CUDC-101, panobinostat) against DIPG cell lines (Figure 1A, B and Supplementary Figure S1A). Notably, we identified a top-hit compound chaetocin, which was not included in the previous compound screens. We then chose to characterize the activity of chaetocin, a fungal metabolite derived from Chaetomium minutum21 since chaetocin was shown to inhibit the growth of high-grade gliomas such as glioblastoma.22,23

Drug screen identifies chaetocin as a DIPG growth inhibitor. (A) Relative cell proliferation upon treatment with epigenetic drugs. Identities of several hits are indicated. (B) Heatmap showing epigenetic drug inhibition activity differences in SU-DIPG36, SU-DIPG21, SU-DIPG17, SU-DIPG25 cells, and normal human astrocytes (NHAs). (C) Summary of drug classification in the epigenetic drug library. (D) Chaetocin-mediated inhibition of growth as measured by AUC in SU-DIPG21, SU-DIPG25, SU-DIPG36, and SU-DIPG17 cells and NHA. (E) Viability of DIPG cell lines and NHAs treated with chaetocin over a range of concentrations after 72 hours. (F) Relative cell growth of human neural stem cells (hNSCs) and human normal astrocytes (NHA) treated with vehicle or chaetocin (25 nM) by WST-1 assay. (G) Representative fluorescent images (left) and quantification (right) of BrdU in SU-DIPG36 cells treated vehicle or chaetocin (25 nM). Scale bar = 100 µm. Data are presented as means ± SEM; n = 3 independent experiments; ***P < .001, 2-tailed unpaired Student’s t-test. (H) Representative fluorescent images (left) and quantification (right) of cleaved caspase 3 in SU-DIPG36 cells with vehicle or chaetocin treatment. Scale bar = 100 µm. Data are presented as means ± SEM; n = 3 independent experiments; ***P < .001, 2-tailed unpaired Student’s t-test. (I) Representative fluorescent images (left) and quantification (right) of BrdU-stained SU-DIPG13 cells treated vehicle or chaetocin (25 nM). Scale bar = 100 µm. Data are presented as means ± SEM; n = 3 independent experiments; ***P < .001, 2-tailed unpaired Student’s t-test. (J) Representative fluorescent images (left) and quantification (right) of SU-DIPG13 cells with or without chaetocin treatment stained for cleaved caspase 3. Scale bar = 100 µm. Data are presented as means ± SEM; n = 3 independent experiments; ***P < .001, 2-tailed unpaired Student’s t-test. (K) Representative fluorescent images of NHA cells (left) and quantification (right) in cells treated vehicle or chaetocin stained for cleaved caspase 3. Scale bar = 100 µm. Data are presented as means ± SEM; n = 3 independent experiments; N.S., not significant, 2-tailed unpaired Student’s t-test. (L) Photograph of soft agar colony formation assay (left) and quantification (right) in SU-DIPG36 cells and SU-DIPG13 cells vehicle or chaetocin treatment. Number of colonies normalized to DMSO-treated cells. Data are presented as means ± SEM; n = 3 independent experiments; *P < .05, **P < .01, ***P < .001, 1-way ANOVA with multiple comparisons test.
Treatment with chaetocin inhibited the growth of multiple DIPG cell lines but not NHAs and human neural stem cells (hNSCs) (Figure 1D–F). We validated the activity of chaetocin in additional patient-derived DIPG cell lines including cells with the H3.3K27M mutation (CCHMC-DIPG2, SU-DIPG6, SU-DIPG13) and H3.1K27M mutation (SU-DIPG4, SU-DIPG21, and SU-DIPG36)20,24 (Figure 1E). Compared to NHAs, all tested DIPG cells were more sensitive to chaetocin (Figure 1E), demonstrating that chaetocin targets a vulnerability in DIPG tumor cells while sparing normal astrocytes.
Chaetocin Inhibits Proliferation and Promotes Apoptosis of DIPG Cells In Vitro and Xenografts
We next sought to determine the effect of chaetocin on DIPG cell proliferation and viability in vitro. DIPG cell lines SU-DIPG36 and SU-DIPG13 were treated with chaetocin25 for 24 hours. Chaetocin treatment significantly reduced the proliferation of these cells as assessed by BrdU pulse labeling and, over the same time period, significantly increased apoptotic cells as indicated by quantification of cleaved caspase 3 (Figure 1G–J). The chaetocin treatment did not induce apoptosis in NHAs (Figure 1K). In addition, a colony formation assay showed that chaetocin treatment suppressed the sphere formation in H3K27M DIPG cells, SU-DIPG36 and SU-DIPG13 (Figure 1L).
To evaluate the in vivo effect of chaetocin on DIPG growth, we established an orthotopic xenograft model using DIPG cells carrying a luciferase reporter to track tumor growth. We treated the mice xenografted with these tumor cells with vehicle and the brain-penetrant chaetocin (0.5 mg/kg body weight)26,27 via i.p. every other day starting 7 days after tumor cell transplantation. Treatment with chaetocin resulted in the inhibition of the growth of tumor cells in mice xenografted with SU-DIPG36 cells, which have the H3.1K27M mutation, and significant improvement in animal survival (Figure 2A–C). Similarly, chaetocin treatment given daily beginning 7 days after xenograft and halted after 56 days suppressed the outgrowth of SU-DIPG13 tumors, which have the H3.3K27M mutation with tumor rebound only after cessation of drug administration (Figure 2D–F). Treatment with chaetocin in xenografts reduced the number of H3K9me3+ cells and the intensity of H3K9me3 expression (Figure 2G). Examination of treated tumors showed a decrease in proliferation while an increase in apoptosis assayed by Ki-67 and cleaved caspase 3, respectively, when compared with tumors from vehicle-treated control mice (Figure 2H, I). These observations suggest that chaetocin treatment effectively inhibits DIPG tumor growth in vivo and extends animal lifespan.
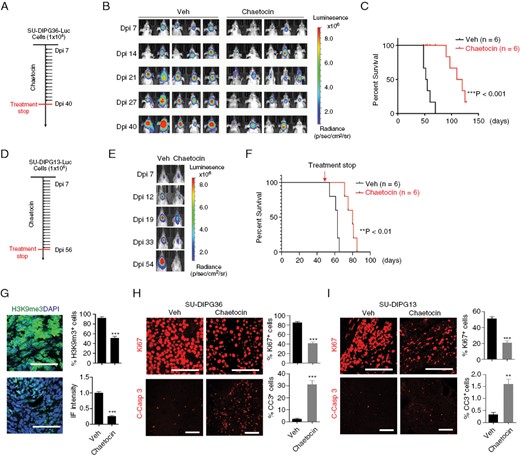
Chaetocin inhibits DIPG growth in vivo. (A) Experimental scheme for treatment of mice with SU-DIPG36 xenografts. (B) Representative bioluminescence images of mice xenografted with SU-DIPG36 cells and treated via intraperitoneal injection with chaetocin or vehicle. (C) Survival analysis of mice with SU-DIPG36 xenografts with or without chaetocin treatment. N = 6 mice/group; ***P < .001, log rank test. (D) Experimental scheme for treatment of mice with SU-DIPG13 xenografts. (E, F) Representative bioluminescence images (E), and survival analysis (F) of mice with SU-DIPG13 xenografts treated with chaetocin or vehicle every other day from day 7 to day 56. Data are presented as means ± SEM. N = 6 mice/group; **P < .01, log rank test. (G) Representative images (scale bar = 100 µm) and quantification of tumors stained for H3K9me3 from mice with SU-DIPG36 xenografts treated with or without chaetocin. (H) Representative images (scale bar = 100 µm) and quantification of tumors stained for Ki-67 and cleaved caspase 3 from mice with SU-DIPG36 xenografts treated with chaetocin or vehicle. Data are presented as means ± SEM; n = 3 independent samples; *P < .05, **P < .01, ***P < .001, 2-tailed unpaired Student’s t-test. (I) Representative images (scale bar = 100 µm) and quantification of tumors stained for Ki-67 and cleaved caspase 3 from mice with SU-DIPG13 xenografts treated with or without chaetocin. Data are presented as means ± SEM; n = 3 independent samples; *P < .05, **P < .01, ***P < .001, 2-tailed unpaired Student’s t-test.
SUV39H1 and H3K9me3 Levels Are Downregulated by Chaetocin Treatment
Chaetocin has been shown to be an inhibitor of histone methyltransferases SUV39H116 and regulates the expression and protein stability of SUV39H1.15,28–30 We, therefore, investigated the effect of chaetocin on the expression and activity of histone methyltransferase SUV39H1 that catalyzes the deposition of the H3K9me3 mark.22,30,31 SUV39H1 was highly expressed in the majority of DIPG cell lines but not in NHAs (Figure 3A). Chaetocin treatment significantly decreased levels of SUV39H1 mRNA and protein in both SU-DIPG13 and SU-DIPG36 cells (Figure 3B–E). Chaetocin also reduced H3K9me3 levels, consistent with a decrease in SUV39H1 enzymatic activity (Figure 3D, E). Our analysis further showed that chaetocin treatment increased the H3K27me3 level in H3K27M-mutant SU-DIPG13 and SU-DIPG36 cells (Figure 3F, G). This suggests that chaetocin targets SUV39H1 activity and restores, at least partially, the levels of H3K27me3 that were downregulated by the H3K27M mutation in DIPG cells.
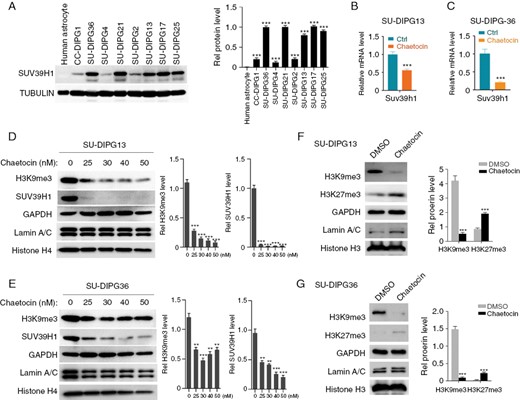
SUV39H1 is highly expressed in DIPG tumors and is sensitive to chaetocin. (A) Western blot (left) and quantification (right) of SUV39H1 expression in human astrocytes and indicated DIPG cells. (B) qPCR analyses of SUV39H1 mRNA in SU-DIPG13 cells treated with chaetocin or vehicle (Ctrl). (C) qPCR analyses of SUV39H1 mRNA in SU-DIPG36 cells treated with chaetocin or vehicle (Ctrl). (D) Western blot (left) and quantification (right) of H3K9me3 and SUV39H1 in SU-DIPG13 cells treated with indicated concentrations of chaetocin. (E) Western blot (left) and quantification (right) of H3K9me3 and SUV39H1 in SU-DIPG36 cells treated with indicated concentrations of chaetocin. (F) Western blot (left) and quantification (right) of H3K9me3 and H3K27me3 in SU-DIPG13 cells treated with chaetocin or vehicle. (G) Western blot (left) and quantification (right) of H3K9me3 and H3K27me3 in SU-DIPG36 cells treated with chaetocin or vehicle.
SUV39H1 Is Essential for DIPG Cell Growth
We next investigated the effect of the loss of SUV39H1 on DIPG growth. Expression of shRNAs SUV39H1 knockdown by lenti-shRNA vectors carrying a GFP-reporter substantially reduced the SUV39H1 and H3K9me3 levels compared to the control vector (Figure 4A). Knockdown of SUV39H1 decreased sphere numbers in SU-DIPG13 cultures (Figure 4B), but had no detectable effects on the number of NHAs (Figure 4C). Similarly, in the H3.1K27M mutant cell line SU-DIPG36, knockdown of SUV39H1 significantly decreased H3K9me3 levels and the number of SU-DIPG36 cells (Figure 4D, E). Further, a cell proliferation assay (WST-1) showed that depletion of SUV39H1 suppressed the proliferation of DIPG cells but not human astrocytes or neural stem cells (Figure 4F). In addition, SUV39H1 knockdown also induced apoptosis assayed by elevated cleaved caspase 3 in DIPG cells (Figure 4G). Moreover, we found that chaetocin treatment did not have a substantial effect on the growth of SUV39H1-knockdown cells, suggesting that chaetocin inhibits DIPG cell growth, at least in part, through inhibiting SUV39H1 (Figure 4H, I). Together, our data indicate that SUV39H1, a target of chaetocin, is a driver for DIPG cell growth.
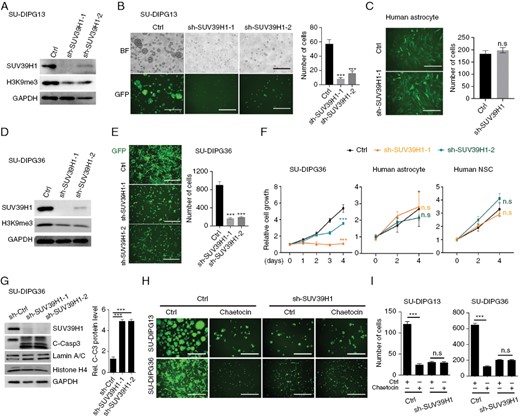
SUV39H1 is essential for DIPG cell growth. (A) Western blot analysis of SUV39H1 and H3K9me3 in SU-DIPG13 cells treated with control lentivirus (Ctrl) or lentivirus expressing shRNAs targeting SUV39H1. (B) Representative images (left) and quantification (right) of SU-DIPG13 cells with or without knockdown of SUV39H1. Scale bar = 100 µm. Data are presented as means ± SEM; n = 3 independent experiments; N.S., not significant, 2-tailed unpaired Student’s t-test. (C) Representative images (left) and quantification (right) of human astrocytes with or without knockdown of SUV39H1. Scale bar = 100 µm. Data are presented as means ± SEM; n = 3 independent experiments; ***P < .001, 1-way ANOVA with multiple comparisons test. (D) Western blot analysis of SUV39H1 and H3K9me3 in SU-DIPG36 cells with or without knockdown of SUV39H1. (E) Representative images (left) and quantification (right) of SU-DIPG36 cells with or without knockdown of SUV39H1. Scale bar, 100 µm. (F) Relative cell growth of SU-DIPG36 cells, normal human astrocytes, and human neural stem cells (NSC) with or without SUV39H1 knockdown as a function of time. (G) Western blot analysis of SUV39H1 and cleaved caspase 3 in SU-DIPG36 cells treated with control lentivirus (Ctrl) or lentivirus expressing shRNAs targeting SUV39H1. And quantification of cleaved caspase3 level in SU-DIPG36 cells treated with control lentivirus (Ctrl) or lentivirus expressing shRNAs targeting SUV39H1. Data are presented as means ± SEM; n = 3 independent experiments; **P < .01, ***P < .001, 2-tailed unpaired Student’s t-test. (H) Representative images of control and SUV39H1 knockdown in SU-DIPG13 and SU-DIPG36 cells treated with either vehicle or chaetocin. Scale bar = 100 µm. (I) Quantification of control and SUV39H1 knockdown in SU-DIPG13 and SU-DIPG36 cells following treatment with either vehicle or chaetocin. Data are presented as means ± SEM; n = 3 independent experiments; ***P < .001, n.s., not significant, 1-way ANOVA with multiple comparisons test.
SUV39H1 Inhibition Decreases Stemness and Oncogenic Signaling
To explore the mechanism underlying the antitumor effect of chaetocin treatment, we performed RNA sequencing of SU-DIPG36 cells after 24 hours of exposure to chaetocin, of these cells depleted of SUV39H1, and of relevant controls (Figure 5A). The gene expression profile changes were correlated between chaetocin-treated and SUV39H1-depleted cells (Figure 5B). We found that both chaetocin treatment and SUV39H1 depletion led to decreased expression of genes associated with stemness (eg, SOX9, MYCN, OLIG2, AURKB), growth factor signaling (eg, HGF, FGF21), receptor-tyrosine kinases signaling (eg, EGFR, FGFR, and PDGFR), and WNT signaling (eg, WNT5A, AXIN2), whereas the genes associated with the NRF2 stress pathway, oxidative stress-related genes (eg, HMOX1, ARK1C1), cell cycle inhibition (eg, CDKN1A, CDKN2B, CDKN2D), and neuronal signaling activity (eg, DRD2, NRG1, NRXN1) were upregulated (Figure 5A, C). Consistent with this, gene set enrichment analysis (GSEA) indicated downregulation of growth factor signaling, epithelial–mesenchymal transition (EMT), and stemness pathways in the DIPG cells treated with chaetocin (Figure 5D). In contrast, chaetocin treatment did not affect the mRNA level of SUV39H2 (Supplementary Figure S1B). Together, our data suggest that chaetocin regulates a specific set of genes or pathways without inducing a global downregulation of gene expression.
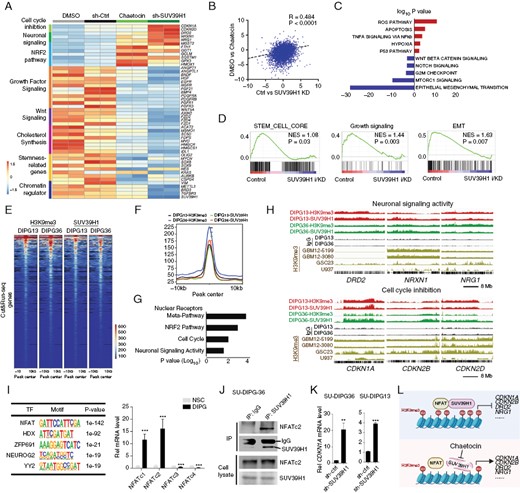
SUV39H1 drives DIPG growth by activation of growth factor signaling and suppression of cell cycle inhibitors. (A) Heatmap showing transcriptome profiles of SU-DIPG36 cells treated with DMSO, chaetocin, control shRNA, or SUV39H1-targeted shRNA. (B) Correlation between transcriptomes of DMSO versus chaetocin-treated and Ctrl versus SUV39H1-targeted shRNA-treated SU-DIPG36 cells. (C) GO analysis shows downregulated pathways (blue) and upregulated pathways (red) in chaetocin-treated or SUV39H1-knockdown SU-DIPG36 cells. (D) GSEA analysis showing enrichment of pathways significantly altered in chaetocin-treated or SUV39H1-knockdown SU-DIPG36 cells. (E) Heatmap showing H3K9me3 and SUV39H1 CUT&RUN signals in SU-DIPG13 cells and SU-DIPG36 cells. (F) Co-occupancy of H3K9me3 and SUV39H1 CUT&RUN peaks in SU-DIPG13 cells and SU-DIPG36 cells. (G) Gene ontology (GO) analysis of H3K9me3 and SUV39H1-binding loci. (H) Tracks showing SUV39H1 and H3K9me3 occupancy on the loci of genes associated with neuronal signaling activity and cell cycle inhibition in indicated cell lines. (I) Left, SUV39H1-binding motifs by HOMER in SU-DIPG36. Right, expression of NFAT family members in DIPG cells relative to hNSCs. (J) SU-DIPG36 cell extracts were subjected to immunoprecipitation by an anti-SUV39H1 antibody or a control IgG antibody. Co-immunoprecipitated or total proteins (WCL) were immunoblotted with SUV39H1 and NFATc2 antibodies. (K) qPCR analyses of CDKN1A mRNA in SU-DIPG36 and SU-DIPG13 cells treated with control or lenti-shSUV39H1. Data are presented as means ± SEM; n = 3 independent experiments; **P < .01, ***P < .001, 2-tailed unpaired Student’s t-test. (L) Model of how the interaction between SUV39H1 and NFAT impacts chromatin remodeling and gene expression to facilitate DIPG cell growth.
To identify potential direct targets of SUV39H1, we performed CUT&RUN-seq32 for H3K9me3 and SUV39H1 genomic occupancies in SU-DIPG13 or SU-DIPG36 cells (Figure 5E). H3K9me3- and SUV39H1-occupied genomic regions or peak signals were essentially overlapped in SU-DIPG13 and SU-DIPG36 cells (Figure 5F), consistent with SUV39H1-catalyzed H3K9me3 deposition. The broad peaks of H3K9me3 and SUV39H1 genomic occupancy are in keeping with those observed in other cell types.33 GO analysis revealed that the H3K9me3- and SUV39H1-targeted genes included those associated with nuclear receptor meta-pathways, neuronal signaling activity, and cell cycle inhibition (Figure 5G). Among the candidate genes upregulated in chaetocin-treated or SUV39H1-depleted DIPG cells, we found that H3K9me3 and SUV39H1 directly targeted genes associated with neuronal differentiation and neurotransmitter receptor signaling and transport (eg, DRD2, NRXN1, NRG1) and cell cycle inhibition (eg, CDKN1A, CDKN2B, CDKN2D) (Figure 5H), suggesting that chaetocin-mediated SUV39H1 inhibition increases cell cycle inhibition while promoting neuronal differentiation and signaling.
NFAT Transcription Factor Binding-Motif Enriched in H3K9me3/SUV39H1-Targeted Sites
The CUT&RUN-seq genomic occupancy analysis indicated that the SUV39H1-enriched peaks covered 6573 and 5912 genes in DIPG13 and DIPG36 cells, respectively. Motif enrichment analysis using the HOMER program34 showed that binding motifs for transcription factors such as NFAT and HDX were associated with SUV39H1-targeted sites in DIPG13 and DIPG36 cells (Figure 5I and Supplementary Figure S2A). Consistently, HOMER analysis of the published H3K9me3 ChIP-seq data sets in different GSC lines (GBM12-5199, GBM12-3080, and GSC23) also predicted the similar transcription factor motifs (Supplementary Figure S2A). Strikingly, all these sites were predominantly enriched with the NFAT consensus-binding motif, suggesting that NFAT family transcription factors might be cofactors of SUV39H1 in DIPG oncogenesis. Compared to normal human neural stem cells, NFAT family transcription factors such as NFATc1 and NFATc2 were highly expressed in DIPG cells (Figure 5I).
NFATc2 has been shown to recruit SUV39H1 and H3K9me3 deposition to repress expression of cell cycle inhibitor genes such as CDKN1A, encoding p21, in stem cells and in cancer cells.35,36 To determine if SUV39H1 can interact with NFATc2, we performed co-immunoprecipitation (co-IP) assays in DIPG cell lines, DIPG13 and DIPG36, and demonstrated that SUV39H1 formed a complex with NFATc2 (Figure 5J and Supplementary Figure S2B). Moreover, ChIP-qPCR experiments after the pulldown of SUV39H1 or NFATc2 showed that both SUV39H1 and NFATc2 bound to the same NFATc2-motif-containing regulatory elements at the loci of CDKN1A (Supplementary Figure S2C). In addition, CDKN1A is upregulated after SUV39H1 knockdown or chaetocin treatment (Figure 5A, K). These data suggest that SUV39H1 can form a complex with NFATc2 and target the CDKN1A gene locus for repressing CDKN1A expression. Consistently, transcriptomics profiling indicates that expression of cell cycle inhibitors such as CDKN1A, CDKN2B, and CDKN2D, which were targeted by H3K9me3 and SUV39H1 (Figure 5H), was upregulated upon chaetocin treatment or SUV39H1 depletion in DIPG cells (Figure 5A, K). Together, our data suggest that SUV39H1 may cooperate with transcriptional repressor NFATs to suppress the expression of cell cycle inhibitors for DIPG oncogenesis (Figure 5L).
Targeting Adaptive DRD2 Signaling by ONC201 Is Synergistic With SUV39H1 Inhibition
Our genomic occupancy analysis revealed that H3K9me3 and SUV39H1 target a set of neuronal differentiation and activity regulators including DRD2, NRXN1, and NRG1 (Figure 5H). DRD2, which encodes a dopamine receptor, was occupied by H3K9me3 and SUV39H1 in DIPG cells but absent or low in GSC lines (eg, GBM12-5199, GBM12-3038, GSC23)37,38 or a human lymphoma cell line U93739 (Figure 5H), suggesting a unique enrichment of H3K9me3/SUV39H1 occupancy or targeting on the DRD2 locus in DIPG cells. DRD2 has been shown to be upregulated in H3K27M gliomas,40–42 and inhibition of DRD2 with small-molecule antagonist ONC201 enhances regression of H3K27M DIPG and DMG in a subset of patients.41,42 Intriguingly, DRD2, but not DRD3, was upregulated in the cells treated with chaetocin or SUV39H1 silencing (Figure 5A; Supplementary Figure S3A). qPCR analysis further confirmed that chaetocin treatment increased DRD2 mRNA expression in different DIPG cell lines (Supplementary Figure S3B). Moreover, we observed upregulation of DRD2 protein and mRNA levels in tumor xenografts treated with chaetocin (Supplementary Figure S3C–E). This suggests that the neural DRD2 signaling may represent an adaptive or compensatory signaling pathway in DIPG cells after SUV39H1 inhibition.
We hypothesized that DRD2 signaling activity maintains the residual growth of DIPG tumor cells and prevents chaetocin-mediated tumor regression. To determine whether targeted inhibition of DRD2 activity by ONC201 is synergistic with chaetocin, we treated SU-DIPG13 cells with chaetocin and ONC201 across ranges of concentrations. We applied the Bliss model to calculate synergy scores,43 and classified the Bliss score greater than 10 as synergistic.43 We found that combining these 2 drugs reduced the growth of DIPG cells synergistically in vitro (Figure 6A, B), and more effectively inhibited tumor growth in orthotopic xenograft mouse models compared to either single agent alone (Figure 6C, D). The administration of chaetocin and combined with ONC201 does not result in significant weight loss or visible side effects in treated mice (Supplementary Figure S4C).
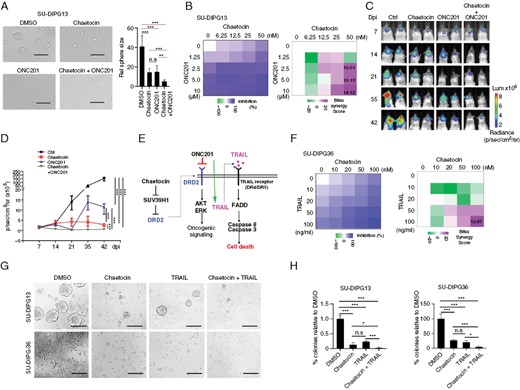
Chaetocin synergizes with ONC201 to inhibit DIPG growth. (A) Representative images (left) and quantification of sphere sizes (right) of SU-DIPG13 cells treated with DMSO, chaetocin (25 nM), ONC201 (5 μM), or the combination of chaetocin and ONC201. Scale bar = 100 µm. Data are presented as means ± SEM; n = 3 independent experiments; ***P < .001, 1-way ANOVA with multiple comparisons test. (B) Heatmap of growth inhibition (left) and Bliss synergy scores (right) of SU-DIPG13 cells treated with indicated concentrations of ONC201 and chaetocin for 48 hours. (C) Representative bioluminescence images (C) and quantification (D) of mice xenografted with SU-DIPG36 cells and treated with vehicle, chaetocin, ONC201, or a combination of chaetocin and ONC201. N = 6 mice/group. ***P < .01, log rank test. (E) Schematic of how targeting of DRD2 by ONC201 induces cell death. (F) Heatmap of growth inhibition (left) and Bliss synergy scores (right) of SU-DIPG36 cells treated with TRAIL and chaetocin for 48 hours. (G) Representative images of SU-DIPG13 cells and SU-DIPG36 cells treated with DMSO, chaetocin (25 nM), TRAIL (50 ng/mL), or the combination of chaetocin and TRAIL. Scale bar = 100 µm. (H) Quantification of SU-DIPG13 sphere number (left) and number of SU-DIPG36 cells (right) in cultures treated with DMSO, chaetocin, TRAIL, or the combination of chaetocin and TRAIL. Data are presented as means ± SEM; n = 3 independent experiments; ***P < .001, 1-way ANOVA with multiple comparisons test.
ONC201 was initially identified in a phenotypic screen as an inducer of TRAIL (TNF-related apoptosis-inducing ligand),44–46 which is a tumor necrosis factor-related, apoptosis-inducing ligand. TRAIL has been shown to induce apoptosis through binding of death receptors DR4 and DR5,47 and it specifically kills tumor cells including glioblastoma cells in a rapid manner, but not nonneoplastic cells.44,46 We therefore asked whether TRAIL stimulation was synergistic with SUV39H1 inhibition, which elevated DRD2-mediated TRAIL expression in DIPG cells (Figure 6E). Indeed, we found that the combination of chaetocin and TRAIL synergistically inhibited the growth of DIPG tumor cells (Figure 6F). The combination of chaetocin treatment and the death ligand TRAIL delivered significantly greater reductions of SU-DIPG13 sphere numbers and SU-DIPG36 cell numbers than treatment individually (Figure 6G, H), indicating that this combined treatment of chaetocin with TRAIL strongly inhibits the growth of DIPG tumor cells in vitro.
Discussion
DIPG is an aggressive malignancy that is refractory to multimodal chemotherapies and radiotherapies; therefore, alternative interventions are urgently needed to treat this devastating disease. DIPG is driven, at least in part, by epigenetic dysregulation due to mutation of H3K27M that can inhibit PRC2 functions and alter the distribution of H3K27me3 domains. In this study, through screening of compounds that target enzymes involved in epigenetic modifications, we identified chaetocin, an inhibitor of H3K9 methyltransferase SUV39H1, that functions as a potent inhibitor of DIPG growth.
The fungal metabolite, chaetocin, has activity against a variety of cancers including glioblastoma and was shown to cross the blood–brain barrier.22,26,48–58 Treatment with chaetocin reduces the proliferation, clonogenic potential, and migration of glioblastoma cells.59 Here, we showed that chaetocin treatment not only inhibited the growth of DIPG cells in culture but also significantly prolonged survival of mice xenografted with DIPG cells with mutation of H3.3K27M or H3.1K27M. The compound had no detectable toxicity toward NHAs or neural stem cells in vitro or discernible adverse effects in animals at the dose that inhibited tumor cell growth, suggesting a therapeutic window against DIPG.
Transcriptomics analysis indicates that SUV39H1 inhibition decreased the expression of stem cell regulators and oncogenes, including those involved in growth factor-mediated tyrosine receptor signaling, EMT, and wingless-related integration site (WNT) signaling, leading to decreased stemness and viability. These data suggest that SUV39H1 and H3K9me3 deposition have a crucial role in regulating the stemness and oncogenic networks to control the growth and viability of DIPG cells. This is in keeping with the notion that the H3K9me3-mediated heterochromatin state is critical for maintaining the survival of drug-resistant persisters in cancer cells.60
The H3K27M mutations lead to gene dysregulation through widespread gene de-repression due to the inhibition of repressive PRC2 functions. In addition, oncohistone H3K27M also regulates the expansion of H3K27me3 domains and inhibits the expression of tumor suppressors including CDKN1A and CDKN2D for promoting tumorigenesis.8–10,61 Similarly, SUV39H1 can establish H3K9me3 deposition at pericentric heterochromatin and modulate the distribution of H3K27me3 marks.62 Notably, SUV39H1 has been shown to function as an oncogene to promote tumorigenesis in cancers in which H3K9me3 mediates suppression of tumor suppressors.35,36,63 Our genomic occupancy analysis indicates that a set of gene loci bound by SUV39H1/H3K9me3, including the tumor suppressor gene CDKN1A, are highly enriched with NFAT-binding motifs. NFAT transcription factors such as NFATc2 can recruit SUV39H1 and cause H3K9me3 deposition to repress their target expression in stem cells or cancer cells.35,36 In keeping with the oncogenic activity of SUV39H1 in other contexts,35,36,63 our findings suggest that H3K9me3 deposition mediated by SUV39H1 may work in concert with other oncogenic drivers (eg, NFAT transcription factors) to promote tumor growth through suppression of cell cycle inhibitors and induction of growth factor signaling.
We found that SUV39H1 knockdown upregulates CDKN1A expression, and that SUV39H1 and H3K9me3 can be recruited to the CDKN1A locus in DIPG cells, suggesting that SUV39H1-mediated H3K9me3 deposition at the CDKN1A locus leads to repression of CDKN1A expression. Furthermore, inhibition of SUV39H1 by chaetocin also increases H3K27me3 levels. Thus, these data suggest that inhibition of SUV39H1 may relieve the H3K27M-mediated repression of tumor suppressor genes such as CDKN1A in DIPG cells by modulating key histone methylation marks.
Chaetocin treatment reduced both SUV39H1 mRNA and protein levels in DIPG cells, which is consistent with the previous reports.15,28,30 The exact mechanisms remain to be defined. Perhaps, inhibition of SUV39H1 methyltransferase activity by chaetocin may alter SUV39H1 downstream effectors, which may in turn downregulate SUV39H1 transcription. In addition, chaetocin can regulate protein stability15,28 that may also contribute to the decreased SUV39H1 expression. It is worth noting that chaetocin may target other cellular processes such as the degradation of oncoproteins29 and inhibition of the central oxidative stress remediation enzyme, thioredoxin reductase.64 The potential differential effects between chaetocin treatment and SUV39H1 knockdown are likely due to the multifaceted effects of chaetocin on other pathways in addition to its action through SUV39H1.
Despite previous reports for the SUV39H1’s role in adult gliomas59 and chaetocin’s in vitro activity against DIPG cells,65 our present study utilized an unbiased epigenetic compound screen in DIPG cells and identified a set of lead compounds including chaetocin. The convergence of multiple approaches on chaetocin underscores its potential impact against high-grade gliomas such as GBM and DIPG. Importantly, our transcriptomic and epigenomic analyses revealed potential downstream targets and oncogenic pathways regulated by SUV39H1 or chaetocin. We further showed that SUV39H1 can cooperate with NFATc2 and repress tumor suppressor CDKN1A expression for oncogenesis. In addition, we demonstrated that combination therapy with a DRD2 inhibitor ONC201 and chaetocin enhances anticancer efficacy in DIPG cells, suggesting that DRD2 upregulation contributes to chaetocin resistance in DIPG cells. Thus, our present work provides novel insights into the mechanisms underlying SUV39H1/chaetocin’s actions and enhanced effects of chaetocin and ONC201 combination treatment on DIPG growth.
Given that compensatory pathways might become activated and maintain the growth and survival of tumor cells after treatment, combination therapy with multiple modalities is often necessary for the effective treatment of cancer because resistance can arise from monotherapy. The translation potential of combining chaetocin treatment with radiation remains to be determined. Nonetheless, our transcriptomic analysis revealed an adaptive or compensatory upregulation of neuronal signaling gene DRD2 following chaetocin treatment since dopamine signaling through DRD2 has been shown to be mitogenic in glioblastoma,66 and it can be targeted to selectively block cancer stem cell growth.67 Although the DRD2 gene is decorated with H3K9me3 marks, SUV39H1 knockdown or chaetocin treatment substantially decreases H3K9me3 levels. This reduction in H3K9me3 may at least partially contribute to the upregulation of DRD2 gene expression after chaetocin treatment. Treatment of DIPGs with the DRD2 antagonist ONC201 was shown to decrease tumor growth in recent clinical trials.41,42 As neuronal signaling activity has been shown to drive tumor growth in DIPG cells,68 increased reliance of tumor cells on extrinsic trophic sources may compensate for the loss of intrinsic growth factor expression caused by SUV39H1 loss. Indeed, we found that co-targeting of SUV39H1 using chaetocin and DRD2 signaling using ONC201 was synergistic in vitro. In a similar fashion, the activation of pro-apoptotic TRAIL signaling, normally activated by DRD2 signaling, was also synergistic with chaetocin. A combination therapy enables the use of lower doses of otherwise toxic monotherapies. It is worth noting that ONC201 can not only function as DRD2 antagonist, but also activate mitochondrial protease ClpP,46,69,70 leading to oxidative stresses and mitochondrial-mediated cell death in cancer cells. Chaetocin may also exert antitumor activity through other mechanisms including the inhibition of thioredoxin reductase to induce mitochondrial reactive oxygen species (ROS) generation and oxidative stresses by disrupting redox homeostasis,25,50 suggesting that chaetocin may potentially add or synergize 2 arms of the ONC201 pathways. As clinical trials of ONC201 have suggested efficacy with tolerable side effects (NCT02525692 and NCT04732065), combining chaetocin with other agents such as ONC201 and its derivatives (eg, ONC206) may offer a new strategy for the treatment of DIPG.
Funding
This study was supported in part by grants from the ChadTough Defeat DIPG Foundation, CureStartsNow Foundation, CancerFree Kids Foundation, Pray-Hope-Believe Foundation, and TeamConnor Childhood Cancer Foundation to Q.R.L.
Conflict of Interest
The authors declare no conflict of interest.
Acknowledgments
The authors would like to thank Dr. Michelle Monje at Stanford University for providing the DIPG cell lines, Xuezhao Liu for technical support, and Dr. Ed Hurlock for critical comments.
Authorship Statement
Conception and design: D.E.X., Y.L., R.R., and Q.R.L. Data acquisition, analysis, and interpretation: D.E.X., Y.L., R.R., S.O., S.S., M.X., A.E.B., W.L.S., and R.T.G. Writing and review: D.E.X., Y.L., R.R., C.K., and Q.R.L. Study supervision: Q.R.L.
References
Author notes
Dazhuan Eric Xin, Yunfei Liao and Rohit Rao contributed equally.


