


Abstract
Insulin feedback is a critical mechanism responsible for the poor clinical efficacy of phosphatidylinositol 3-kinase (PI3K) inhibition in cancer, and hyperglycemia is an independent factor associated with poor prognosis in glioblastoma (GBM). We investigated combination anti-hyperglycemic therapy in a mouse model of GBM and evaluated the association of glycemic control in clinical trial data from patients with GBM.
The effect of the anti-hyperglycemic regimens, metformin and the ketogenic diet, was evaluated in combination with PI3K inhibition in patient-derived GBM cells and in an orthotopic GBM mouse model. Insulin feedback and the immune microenvironment were retrospectively evaluated in blood and tumor tissue from a Phase 2 clinical trial of buparlisib in patients with recurrent GBM.
We found that PI3K inhibition induces hyperglycemia and hyperinsulinemia in mice and that combining metformin with PI3K inhibition improves the treatment efficacy in an orthotopic GBM xenograft model. Through examination of clinical trial data, we found that hyperglycemia was an independent factor associated with poor progression-free survival in patients with GBM. We also found that PI3K inhibition increased insulin receptor activation and T-cell and microglia abundance in tumor tissue from these patients.
Reducing insulin feedback improves the efficacy of PI3K inhibition in GBM in mice, and hyperglycemia worsens progression-free survival in patients with GBM treated with PI3K inhibition. These findings indicate that hyperglycemia is a critical resistance mechanism associated with PI3K inhibition in GBM and that anti-hyperglycemic therapy may enhance PI3K inhibitor efficacy in GBM patients.
Metformin reduces insulin feedback and improves the efficacy of phosphatidylinositol 3-kinase (PI3K) inhibition in a glioblastoma (GBM) mouse model.
Hyperglycemia is an independent factor in poor prognosis in patients treated with PI3K inhibitors.
PI3K inhibition leads to increased T-cell and microglia abundance in tumors of patients with GBM.
The efficacy of phosphatidylinositol 3-kinase (PI3K) inhibition for cancer treatment is impaired by on-target insulin feedback that reactivates the PI3K signaling pathway. Treatment of patients with recurrent glioblastoma (GBM) using PI3K inhibitors failed in a Phase 2 clinical trial. We demonstrate that PI3K inhibitors induce hyperglycemia and hyperinsulinemia in mice and that counteracting hyperglycemia with metformin enhances therapeutic efficacy in an orthotopic GBM mouse model. We also found that hyperglycemia was an independent factor associated with poor progression-free survival in a clinical trial evaluating PI3K inhibition in patients with recurrent GBM. This hyperglycemia was sufficient to induce insulin receptor activation in tumor tissue in patients. Implementation of a rational anti-hyperglycemia regimen along with PI3K inhibition may help translate these findings to improve PI3K targeting in patients with GBM.
Receptor tyrosine kinase (RTK) activation is critical to the growth of many cancers, including glioblastoma (GBM), the most lethal primary brain tumor. The most highly activated RTK pathway in GBM is phosphatidylinositol 3-kinase (PI3K), which is directly altered in 10% of cases and hyper-activated because of phosphatase and tensin homolog (PTEN) deletion in 80% of cases.1,2 PI3K is a lipid kinase that catalyzes the phosphorylation of phosphatidylinositol 4,5-bisphosphate (PIP2) to form phosphatidylinositol-3,4,5-trisphosphate (PIP3), which facilitates downstream activation of Akt and the mammalian target of rapamycin (mTOR) pathways to enhance cancer cell growth.3
Because of its widespread activation in human cancer, PI3K has been an attractive therapeutic target, with numerous small molecule inhibitors of the PI3K/Akt/mTOR axis being efficacious in clinical trials for breast cancer, renal cell cancer, and leukemia.4 Brain-penetrant PI3K inhibitors, including the pan-PI3K inhibitor buparlisib (BKM-120) and the PI3Kα-specific inhibitor paxalisib, were also developed to target brain metastases and primary brain tumors. However, a Phase 2 clinical trial examining the efficacy of buparlisib, a pan-PI3K inhibitor, in recurrent GBM failed to prolong progression-free survival, which was thought to be due to incomplete downstream PI3K inhibition.5
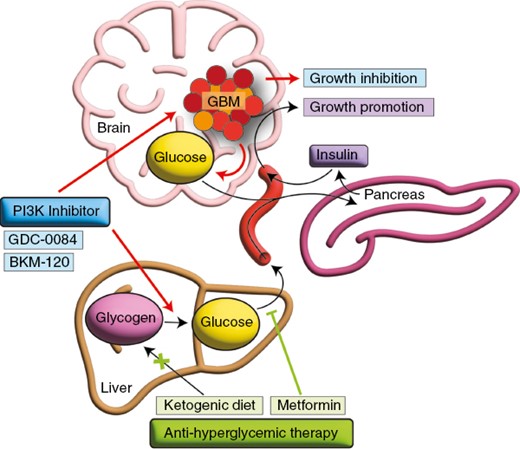
The administration of PI3K inhibitors leads to systemic hyperglycemia because of disruption of glucose metabolism in several tissues, including the liver, fat, and muscle.3 Recently, we showed that PI3K inhibitor-related hyperglycemia is blocked by drugs that reduce insulin feedback or with the ketogenic diet in mice treated with these drugs.6 This diet lowers systemic glucose levels by providing a diet high in fats and low in carbohydrates and induces systemic ketosis. Lowering insulin feedback enhances the efficacy of these inhibitors.
We now show that anti-hyperglycemic therapy with metformin reduces insulin feedback from PI3K inhibition and improves the efficacy of PI3K inhibition in an orthotopic patient-derived GBM mouse model. We also leveraged data from the Phase 2 study evaluating buparlisib in patients with recurrent GBM (NCT05183204) to demonstrate that the PI3K inhibitor buparlisib induced activation of insulin signaling and hyperglycemia that was independently associated with poor prognosis. We also found that systemic hyperglycemia was sufficient to induce insulin receptor phosphorylation in tumor tissue from these patients and that buparlisib increased T-cell and microglia abundance in tumor tissue, a potential indication of altered immune cell invasion resulting from treatment. Together, these results highlight the utility of rational synergistic regimens that combat treatment-associated resistance to single-target agents in GBM.
Methods
Animal Care
All animal studies were conducted following the Institutional Animal Care and Use Committee -approved animal protocols at Weill Cornell Medicine. Ethical requirements for the treatment of animals were followed for all the animal studies as per institutional guidelines set by the Principles of Laboratory Animal Care (National Institutes of Health). Mice were maintained in temperature- and humidity-controlled specific pathogen-free conditions on a 12-hour light/dark cycle and received a normal chow diet (PicoLab Rodent 20 5053 lab Diet) unless otherwise specified with free access to drinking water. The ketogenic diet used in this study was a custom-formulated diet (TD.200669) composed of coconut oil as the predominant fat source, and that was isocalorically matched with the regular diet in the study (TD.200670) (Envigo) (Supplementary Tables 1 and 2). The ketogenic diet was served in 100 mm Petri dishes and changed 3 times a week. Male NOD scid gamma mice were used for the survival study and purchased from Jackson Laboratory.
Insulin Treatment and Western Blot
Five million 667 cells were plated in media without glucose and pyruvate and then treated 4 hours later with BKM-120 (0.5 µM) for 1 hour, and insulin (10 µg/mL) was added 30 minutes before harvest. Five million 810, 308, or 1228 cells were plated in media without glucose and pyruvate and treated 4 hours later with GDC-0084 (0.4 µM) for 1 hour. Insulin (10 µg/mL) was added 30 minutes before harvest. Whole-cell lysate preparation and western blot analysis were performed as described previously.7
Cell Proliferation Assay
Cell proliferation was measured using the Cell Titer Glo reagent (Promega) according to the manufacturer’s instructions. Briefly, 10,000 cells were plated in a white-bottom 96-well plate. For proliferation assays in cells treated with insulin, B27 supplement lacking insulin was used (Thermo Fisher). Insulin (10 ng/mL) and BKM-120 (0.4 µM) or GDC-0084 (0.5 µM) were added to corresponding wells, and plates were placed in the incubator for 24–72 hours. Cells were incubated with Cell Titer Glo reagent for 10 minutes on a rocking platform, and luminescence was measured on a Synergy Neo 2 plate reader (BioTek Instruments).
Orthotopic GBM Xenograft Study
Twenty-five thousand 667 cells expressing a luciferase construct were injected intracranially into the brains of mice at the following coordinates relative to bregma: 1.6 mm right, 0.5 mm posterior, and 3 mm dorsal. Bioluminescence imaging was performed beginning at Day 7, and mice whose bioluminescence intensity was 3,000–12,000 Relative luciferase units (RLU) were begun on treatment. Mice began either the regular diet or ketogenic diet (Supplementary Tables 1 and 2), which were matched for the fat source (soybean oil, coconut oil, and milk fat), and each contained 6.4% kcal protein. GDC-0084 was administered once daily via oral gavage 5 days per week. β-Hydroxybutyrate levels were measured 7 days after ketogenic diet initiation using a OneTouch Ultra Ketone reader from 10 µL of tail vein blood, and all mice fed the ketogenic diet exhibited β-hydroxybutyrate levels >1 mM. Mice were treated with vehicle or GDC-0084 until 25% weight loss, reduced spontaneous activity, unkempt coat, paralysis, or death. For these studies, we used only male mice as female mice lost weight >15% on the ketogenic diet, which precluded their inclusion.
Glucose, C-peptide, and Insulin Measurement
A OneTouch Ultra Glucometer was used to measure blood glucose levels obtained from 10 µL of tail vein blood at 0, 5, 15, 30, 60, 120, 240, and 360 minutes after drug treatment. Insulin levels were measured by ELISA (ALPCO, 80-INSMS-E01) from 5 µL of mouse serum collected 30 minutes after PI3K inhibitor treatment. C-peptide levels were measured by ELISA (ALPCO, 80-CPTMS-E01) from 5 µL of mouse serum collected 30 minutes after PI3K inhibitor treatment.
Bioluminescence
Mice were injected subcutaneously with 200 µL d-luciferin (150 mg/kg) and subjected to bioluminescence imaging using an IVIS CT Spectrum instrument (Perkin Elmer) at Day 7. Bioluminescence images were taken 7 minutes after injection, acquired for 5 minutes, and analyzed using Living Image Software v.2.50. 2 × 2 cm region of interests (ROIs) were traced around brain tumor bioluminescent signal, and an identical 2 × 2 cm ROI placed over the mouse abdomen was used as background correction.
PET-MR Data Acquisition
The custom-built PET-MR system and PET-MR details were described previously.8 Absolute tracer uptake is expressed in % injected dose per gram of tissue (% ID/g). Co-registered PET/MRI images were visualized in the Amide program. MRI studies were performed on Days 8–10 after treatment initiation to quantify tumor size. The same protocol was used as for PET-MR analysis.
Immunohistochemistry
Mouse brains were extracted after euthanasia by CO2 asphyxiation. The immunohistochemical analysis of mouse brain tumors was performed on formalin-fixed, paraffin-embedded coronal sections of the brain containing tumor. The immunohistochemical analysis of human GBM was performed on formalin-fixed, paraffin-embedded sections. Tissue and slide preparations were performed by the Laboratory of Comparative Pathology at Memorial Sloan Kettering Cancer Center.
Clinical Trial Data Acquisition and Analysis
The following clinical data and samples from the completed NCT01339052 trial were obtained through an institutional review board-approved protocol at Weill Cornell Medicine and the Dana Farber Cancer Institute: blood glucose, C-peptide, body mass index, and hemoglobin A1c. Surgical specimens were obtained from excess samples available from 12 patients in the study and from 18 patients with newly diagnosed GBM or recurrent GBM who were age-matched and whose tumors exhibited either PIK3CA mutation or PTEN deletion.
Imaging Mass Cytometry and Data Acquisition
Banked FFPE samples were baked for 2 hours on a slide warmer at 60°C. Slides were then dewaxed in CitriSolv (Decon Labs) twice, each for 10 minutes, followed by hydration in descending series of ethanol (100%, 95%, 80%, and 75%) for 5 minutes each. Slides were washed in MilliQ water and processed for antigen retrieval in antigen retrieval solution pH 9 using the HIER method at 95°C for 30 minutes. Slides were then cooled to room temperature and washed twice in tris-buffered saline (TBS). After blocking slides for an hour in super block solution, they were incubated in antibody cocktail solution overnight at 40°C (antibodies are displayed in Supplementary Table 3). Slides were washed in 0.2% Triton-X 100 solution twice, TBS twice, and incubated in Iridium DNA solution for 30 minutes at room temperature. Slides were air-dried. Slides were imaged on a Fluidigm imaging mass cytometer, and the ROI was drawn using H&E reference annotation.
Computational Preprocessing of IMC Data
Eighty-three ROIs from 29 patients were processed through IMC software (version 0.1.4) (https://github.com/ElementoLab/imc), which applied nuclei and cell probability prediction through Ilastik (version 1.3.3post2), segmentation through DeepCell (version 0.10.0), and marker quantification through mean aggregation of cell masks. Expression was batch-normalized through scanpy (version 1.8.1) implementation Harmony integration. We performed log transformation of the mean aggregated expression matrix, z-score normalization with truncation at ±3 SDs. To provide a lower dimensional representation of the data, we applied scanpy Uniform Manifold Approximation and Projection with γ of 25. To develop granular cell phenotypes, we performed Leiden clustering at 1.0 resolution. Cell types were labeled based on a normalized expression matrix.
To compare the relative abundance of cell type between control and treatment groups, we calculated the cell-type proportion for each of the 83 ROIs. We then performed a Mann–Whitney U test between the 57 control ROIs and 26 treated ROIs for the 12 cell-type groups using the pinguoin (version 0.5.2) statistical testing Python package. For multiple comparison testing, we applied Benjamini–Hochberg false discovery rate P-value compensation.
Statistical Analysis
Statistical analyses were conducted using GraphPad Prism, version 8.0. T tests were used to measure the significance between 2 samples, and ANOVA was used to measure the significance between 3 or more groups, with results being adjusted for multiple comparisons. Univariate and multivariate logistic regression were used to determine the association between clinical trial variables and progression-free survival and were performed in R. All error bars indicate the mean ± SD unless otherwise specified.
Results
PI3K Inhibitor-mediated Insulin Feedback Is Blocked by Anti-hyperglycemic Therapy in Mice
We previously showed that insulin feedback reduces the efficacy of PI3K inhibition in various cancers in mice, but GBM was not included in this study.6 We treated mice with the pan-PI3K inhibitor buparlisib or the PI3Kα-mTOR inhibitor GDC-0084 and measured blood glucose, insulin, and C-peptide levels (Figure 1, Supplementary Figure 1). We found that PI3K inhibition led to a significant increase in blood glucose after 30 minutes, which remained elevated even after 8 hours of treatment. Mice that received the ketogenic diet had no significant elevation in blood glucose in response to BKM-120, either with or without the anti-hyperglycemic drug, metformin (Figure 1A, Supplementary Figure 1A). Metformin alone was not sufficient to prevent glucose elevation in response to BKM-120. For GDC-0084, mice treated with the ketogenic diet or metformin were resistant to hyperglycemia (Figure 1B, Supplementary Figure 1B). Likewise, both BKM-120 and GDC-0084 induced a significant increase in insulin and C-peptide levels, which were reduced by the ketogenic diet and metformin (Figure 1C and D). Metformin alone also reduced insulin and C-peptide levels after GDC-0084 treatment. To determine the functional changes of PI3K inhibition on hyperglycemia in vivo, we established orthotopic patient-derived xenografts from the GBM neurosphere patient-derived cell line, 667, which has gain of chromosome 7, PTEN loss, PDGFRA amplification, and CDKN2A/B focal 2-copy deletion. Tumors were tracked with bioluminescence starting 2 weeks after implantation. One week before imaging, mice were placed on a ketogenic diet or an isocaloric regular diet. Mice then received BKM-120 and underwent imaging 1 hour later. Ketone levels are given in Supplementary Table 4. Mice treated with BKM-120 exhibited significantly reduced 18F-fluorodeoxyglucose (FDG) avidity, likely because treatment-related elevation in blood glucose competed for uptake with the radiotracer (Figure 1E and F). In contrast, mice treated with the ketogenic diet exhibited significantly elevated FDG avidity, likely a result of lower resting blood glucose levels. Mice treated with the ketogenic diet and BKM-120 exhibited FDG avidity that resembled untreated mice on the regular diet, an indication that the ketogenic diet helped to normalize FDG avidity in orthotopic brain tumors in response to PI3K inhibition.
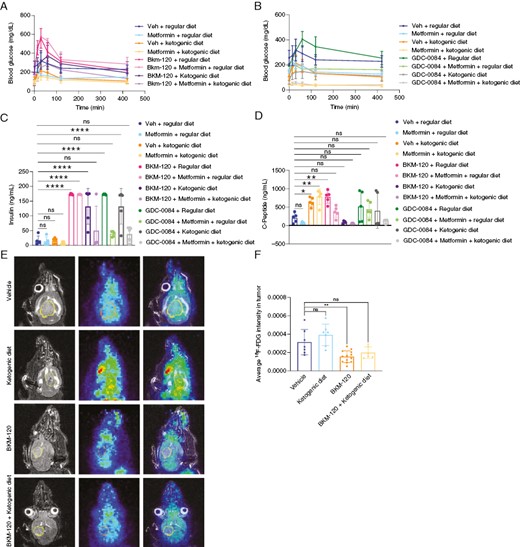
PI3K inhibitor-driven insulin feedback is reduced by anti-hyperglycemic therapy in mice. Serum glucose levels were measured in mice treated with BKM-120 (60 mg/kg) (A) or GDC-0084 (15 mg/kg) (B) along with metformin (200 mg/kg) and a regular or ketogenic diet. P values by 1-way ANOVA for vehicle v. BKM-120 (<.001), metformin (ns), BKM-120 + metformin (<.01), metformin + ketogenic diet (<.05), ketogenic diet (ns), BKM-120 + ketogenic diet (ns), and BKM-120 + ketogenic diet + metformin (ns). P values by 1-way ANOVA for vehicle v. GDC-0084 (ns), metformin (<.05), metformin + ketogenic diet (<.0001), GDC-0084 + ketogenic diet (<.0001), and GDC-0084 + ketogenic diet + metformin (<.0001). Insulin (C) and C-peptide (D) levels were measured in mice treated with BKM-120 and GDC-0084 as in A and B. Mice fed a regular or ketogenic diet were treated with BKM-120 (15 mg/kg) followed 30 minutes later by 18F-fluorodeoxyglucose, and PET-MR imaging was then performed (E) and quantified in F. **P < .01, ****P < .0001.
Insulin Reactivates PI3K Signaling After PI3K Inhibition
Because PI3K inhibitor-related hyperglycemia induces pancreatic insulin release and reactivates PI3K signaling, we hypothesized that insulin would counteract GBM growth inhibition by PI3K inhibitors in vitro. We treated patient-derived glioma cells with BKM-120 and GDC-0084 and either vehicle or physiological levels of insulin (10 ng/mL) and measured growth. We found that both PI3K inhibitors reduced GBM growth, but that insulin modestly rescued this growth inhibition, consistent with its mitogenic effects on these cells (Figure 2A and B). In addition, whereas PI3K inhibition reduced phosphorylation of Akt and S6, this signaling was rescued by insulin in 667 cells (Figure 2C and G). We also used additional patient-derived cell lines, including 308, 810, and 1228 cells, to test the effects of insulin feedback. These cells exhibit no mutations or deletions in PIK3CA exons 1, 2, 7, 9, and 20 or PTEN exons 5, 7, and 8. Insulin enhanced Akt and S6 phosphorylation, which was prevented by PI3K inhibitor treatment in these cells (Figure 2D–F, H–J). These results indicate that insulin feedback can counteract PI3K pathway inhibition in glioma cells.
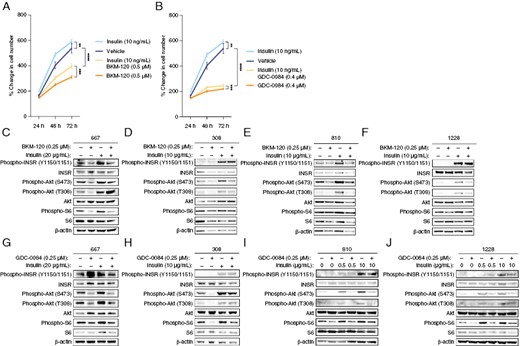
Insulin rescues PI3K inhibitor-induced growth suppression and signaling, 667 cells were treated with 0.5 μM BKM-120 (A) or 0.4 μM GDC-0084 (B) along with 10 ng/µL insulin, and cell proliferation was measured by Cell Titer Glo assay. (C) 667 cells were treated with 0.25 μM BKM-120 along with 20 μg/mL insulin, and PI3K-mTOR signaling was analyzed by western blot. (D) The glioma cells 308, 810, and 1228 were treated with 0.25 μM GDC-0084 along with 10 μg/mL insulin, and PI3K-mTOR signaling was analyzed by western blot. **P < .01, ***P < .001, ****P < .0001.
Anti-hyperglycemic Therapy Improves Efficacy of PI3K Inhibition in a GBM Orthotopic Mouse Model
To determine the effects of anti-hyperglycemic therapy on PI3K inhibition in GBM mouse models, we developed orthotopic xenografts of 667 cells. We allowed tumors to grow until prespecified bioluminescence intensity, upon which time we began treatment with GDC-0084 (15 mg/kg) and/or metformin (200 mg/kg). We used metformin because this compound significantly prevented the hyperglycemic rise and insulin release induced by GDC-0084. We performed bioluminescence and MRI at 8–10 days after treatment initiation. Weight data for these mice are shown in Supplementary Figure 2. We found that mice treated with metformin along with GDC-0084 had significantly improved overall survival, with a more than double rate of survival (Figure 3A). This increase in survival with GDC-0084 and metformin correlated with significant reduction on size on MRI brain scans compared to vehicle-treated mice (Figure 3B and C, Supplementary Figure 3).
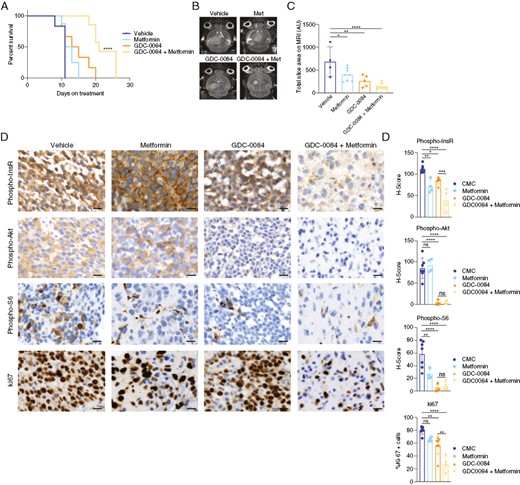
Metformin improves the efficacy of PI3K inhibition in an orthotopic GBM mouse model, (A) Mice bearing orthotopic 667 GBM xenografts were treated with GDC-0084 (15 mg/kg) and/or metformin (200 mg/kg), and overall survival was measured from the time of treatment initiation. (B) Mice underwent MR brain imaging at 8–10 days after treatment initiation, with results quantified in C. (D) Tumor tissue was harvested from mice at the survival endpoint and processed for immunohistochemistry with the indicated antibodies. Percent expression and H-scores were quantified using Halo software (E). Met, metformin. *P < .05, **P < .01, ***P < .001, ****P < .0001. Scale bars = 20 μm. GBM, Glioblastoma.
We also analyzed PI3K targets in brain tumor tissue from treated mice. We found that GDC-0084 reduced PI3K pathway activity, as measured by phosphorylated Akt and S6, in tumor tissue by 50%–80% (Figure 3D and E). Metformin co-treatment did not improve PI3K pathway inhibition. However, metformin did induce a greater reduction in insulin receptor phosphorylation when combined with GDC-0084 than with GDC-0084 treatment alone, indicating that metformin co-treatment reduces in vivo insulin feedback stimulated by GDC-0084. This reduced insulin receptor phosphorylation was associated with decreased proliferation as measured by Ki67. Therefore, given that metformin co-treatment did not alter Akt and S6 phosphorylation more than GDC-0084 alone, the reduction in insulin receptor phosphorylation by GDC-0084 and metformin may decrease growth signaling through other receptor tyrosine kinase pathways, such as the mitogen-activated protein kinase (MAPK) pathway.
Hyperglycemia Is Associated with Reduced Progression-free Survival in GBM Patients Treated with BKM-120
In the Phase 2 clinical trial of buparlisib (BKM-120) in patients with recurrent GBM, 15 patients were enrolled in a surgical arm, where they were treated with buparlisib 5 days before tumor resection, after which tumor tissue was analyzed for PI3K inhibition.5 These patients then continued buparlisib after resection. In addition, 50 patients were treated with buparlisib in a nonsurgical arm and followed for progression-free survival. Buparlisib failed to increase progression-free survival in both cohorts in this study, which was hypothesized to be due to incomplete PI3K pathway inhibition. However, while only 4.6% of buparlisib-treated patients exhibited Grade 3 or 4 hyperglycemia, 50% of buparlisib-treated patients in the surgical arm and 40% of patients in the nonsurgical arm exhibited hyperglycemia of any grade, defined as greater than the upper limit of normal to 160 mg/dL. To confirm these findings, we found that buparlisib-treated patients exhibited significantly higher average glucose, C-peptide, and HbA1c levels as compared to baseline levels before starting buparlisib (Figure 4A–C).
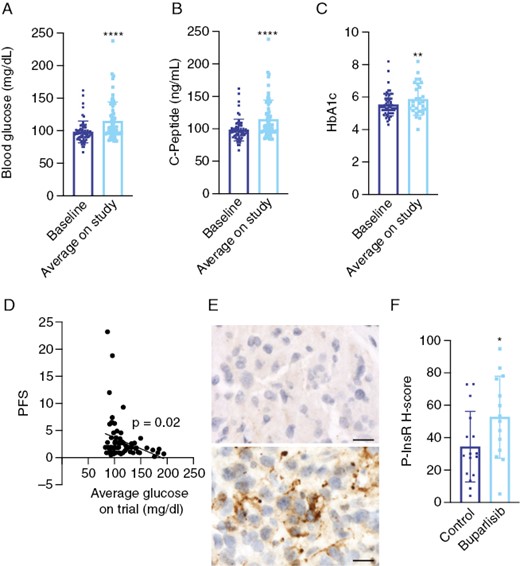
Buparlisib induces hyperglycemia and insulin receptor phosphorylation in tumor tissue from GBM patients. Baseline and average on-treatment glucose (A), C-peptide (B), and HbA1c (C) values were obtained from patients treated on the Phase 2 study of buparlisib for recurrent GBM. (D) Logistic regression of the association between average glucose values on trial and progression-free survival. (E) Tumor tissue from patients in the study and from historical controls was subjected to immunohistochemistry for phosphorylated insulin receptor. (F) H-scores from tumor tissue were quantified using Halo software. **P < .01, ****P < .0001. Scale bars = 20 μm. GBM, Glioblastoma.
To determine whether treatment-related hyperglycemia was responsible for this poor efficacy, we analyzed the association between blood glucose during buparlisib treatment and progression-free survival. On univariate analysis, we found that high on-treatment blood glucose levels were significantly associated with reduced progression-free survival (Figure 4D, Supplementary Table 4). This association was maintained when we dichotomized blood glucose levels into low and high groups based on median values. Multivariate analysis showed that the inverse association of blood glucose levels with progression-free survival was still significant after controlling for baseline C-peptide levels, body mass index, and insulin usage (Table 1). These findings indicate that treatment-related hyperglycemia predicted poor prognosis and may have been an important factor in the failure of buparlisib in GBM patients.
Multivariate analysis of the association between blood glucose levels and progression-free survival in buparlisib-treated patients
| Variables | Estimate (95% CI) | P Value |
|---|---|---|
| Average glucose (dichotomous ≤104) | 59.19% (7.42%, 135.92%) | .022 |
| Insulin (Yes) | 165.84% (30.33%, 442.24%) | .008 |
| Baseline C-peptide (dichotomous ≤3.3) | 106.16% (39%, 205.77%) | <.001 |
| Total steroid usage (days) (dichotomous ≤48) | −56.37% (−70.58%, −35.29%) | <.001 |
| Baseline body mass index (dichotomous ≤26.94) | −28.06% (−52.25%, 8.4%) | .112 |
In this study, Akt phosphorylation was shown to be significantly reduced in buparlisib-treated samples as compared to archival tissues, but there was no significant reduction in phosphorylation of S6.5 To determine whether insulin feedback mediated incomplete PI3K pathway inhibition in GBM tissue from this study, we analyzed phosphorylation of insulin receptor in tissues from this clinical trial and compared to archival tissues that were matched for age, sex, and PI3K alteration. We found that patients in the buparlisib study exhibited significantly elevated insulin receptor phosphorylation as compared to historical controls (Figure 4E and F). These findings indicate that systemic hyperglycemia in this study was sufficient to re-activate insulin signaling in brain tumors in these patients.
Buparlisib Increases T-cell and Microglia Abundance in Human GBM Tissue
Because GBM is a heterogeneous neoplasm with at least 20% of tumor mass composed of myeloid cells and because of the effects of PI3K inhibition on the tumor microenvironment, we performed imaging mass cytometry to characterize the immune landscape in buparlisib-treated patients with recurrent GBM.9,10 We analyzed 18 controls, which included non–trial-related controls composed of those with newly diagnosed GBM (n = 16) and recurrence post-treatment (n = 2), as well as 9 buparlisib-treated patients with 38 epitopes (Figure 5A, Supplementary Figure 4A). We found a nonsignificant increase in cell number between groups, but cell density was significantly increased in buparlisib-treated patients (Figure 5B). The abundance of microglia and CD8+ T cells were significantly increased in buparlisib-treated patients as compared to controls (Figure 5E and G, Supplementary Figure 4B). Glial fibrillary acidic protein-positive regions in buparlisib-treated patients exhibited lower Ki67 expression than controls, likely indicative of tumor-rich regions with reduced proliferation (Figure 5F and G). These results indicate that buparlisib may effectively reduce GBM proliferation but may induce changes in T-cell and microglia recruitment in these tumors.
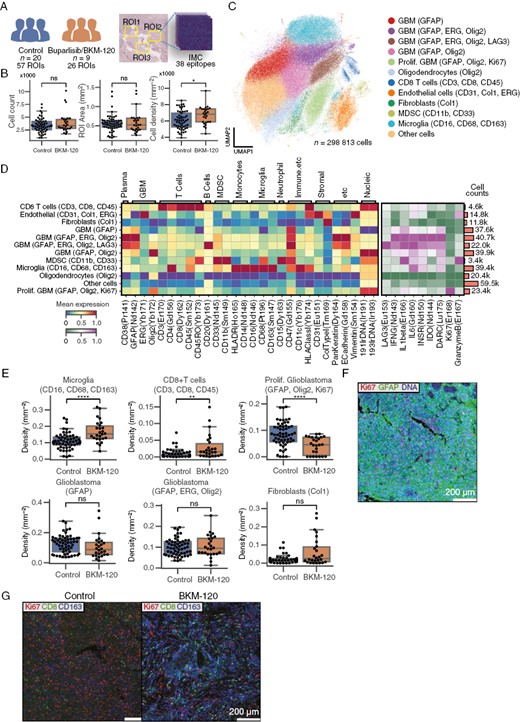
Buparlisib increases T-cell and microglia abundance in tumor tissue from GBM patients. (A) Tumor tissue from 20 untreated patients (57 ROIs) and 9 patients treated with buparlisib was subjected to imaging mass cytometry using 38 epitopes. (B) Cell counts, area, and cell density for each collected ROI. (C) UMAP of cell expression color-coded with cell-type labels. (D) Heatmap of normalized cluster expression used to label cell types. The left heatmap shows cell-type identification markers, and the right heatmap shows functional markers. The bar plot on the right shows cell counts for each group. (E) Cell-type proportion of each ROI as a box plot in control and buparlisib-treated patients. (F) Sample control image of proliferative GBM ROI. GFAP and DNA is expressed in all cells in the ROI. Purple cells are Ki67+ GBM cells. (G) Sample visualization illustrating Ki67, CD8, and CD163 expression in control and treatment groups. *P < .05, **P < .01, ****P < .0001. Scale bars represents 200 μm. GBM, Glioblastoma; GFAP, Glial fibrillary acidic protein; ROI, Region of interest; UMAP, Uniform Manifold Approximation and Projection.
Discussion
PI3K inhibitor-driven hyperglycemia and subsequent insulin feedback is a major limitation of treatment efficacy in cancer. Though numerous clinical trials have tested PI3K inhibitors in a wide variety of cancers, many have failed to show a clinical benefit.11 One potential reason behind these clinical trial failures is poorly managed treatment-related hyperglycemia or usage of insulin to counteract hyperglycemia. Improved glycemic control using oral anti-hyperglycemic agents in the SOLAR-1 study with alpelisib in patients with PIK3CA-mutated hormone receptor-positive breast cancer led to improved progression-free survival and FDA approval of alpelisib.12
We show that the dual PI3K-mTOR inhibitor GDC-0084 induces hyperglycemia in mice, but that metformin and/or the ketogenic diet counteract this effect. High-glucose levels correlate with increased insulin and C-peptide release, which are also reduced by metformin and/or the ketogenic diet. Similarly, the pan-PI3K inhibitor buparlisib lowers FDG uptake in orthotopic GBM xenografts, likely by inducing hyperglycemia, which is normalized in mice fed the ketogenic diet. Combining the anti-hyperglycemic drug metformin with GDC-0084 significantly increases survival in mice and reduces insulin feedback in mouse brain tumor tissue. These results suggest that combining an anti-hyperglycemic regimen with PI3K inhibition in glioma patients may improve treatment efficacy.
Though several clinical trials have failed to show a benefit when using PI3K inhibition in a number of cancers, few analyses have been conducted to demonstrate reasons for treatment failure.5,11 In particular, there has been relatively little focus on analyzing the effects of glycemic control on treatment efficacy in these studies, especially considering that hyperglycemia increases the growth of GBM and other tumors.13 Our results demonstrate that GBM patients in the Phase 2 buparlisib study exhibited significantly elevated glucose values over the entire course of their enrollment and that treatment-related hyperglycemia reached high enough levels to induce insulin receptor phosphorylation in tumor tissue resected from patients within the surgical cohort. These findings help to explain incomplete PI3K-mTOR pathway inhibition observed in this study and highlight a previously under-recognized resistance mechanism in patients with GBM.
Our results also add to the growing literature examining the role of insulin signaling and hyperglycemia within the brain, especially as related to brain tumor treatment and prognosis. Corticosteroids are prescribed ubiquitously to control vasogenic edema in glioma patients, and in the inpatient setting, insulin is almost uniformly used to counteract this effect.14 Because insulin is a potent tumor mitogen, especially in glioma where nearly 80% of patients will have pre-existing PI3K pathway activation, it is perhaps unsurprising that dexamethasone usage and hyperglycemia are both independently associated with poor clinical function and survival in GBM.15–20 Our findings suggest that better glycemic control, especially in the setting of regimens that raise serum glucose, may be more effective at controlling tumor growth.
We also demonstrate that PI3K inhibitor usage in patients leads to increased CD8+ T-cell and microglia abundance in tumor tissue. This effect could result from neuroinflammation resulting from high circulating glucose levels or could be an effect of PI3K pathway inhibition itself.21 It is noteworthy that glioma is traditionally regarded as one of the most T-cell-depleted tumors and that immunotherapy has repeatedly failed in clinical trials to improve overall survival.22–25 Likewise, we found that archived samples and historical controls exhibited <5% T-cell abundance. Our results suggest that enhanced T-cell and microglia entry in patients treated with PI3K inhibitors may provide a window of opportunity to enhance the efficacy of immunotherapy in this disease. However, our study is limited by the small number of recurrent GBMs in our historical cohort. Further delineation of these T-cell and microglia subtypes is needed to better understand the function of these cells within the tumor microenvironment. In addition, the effect of systemic hyperglycemia on T-cell and microglia abundance in GBM requires further exploration.
Though we found that metformin improves the efficacy of GDC-0084 in our GBM xenograft model, it is possible that non-anti-hyperglycemic effects of metformin are responsible for synergism in our models. It is also possible that results would differ in immunocompetent models given conflicting reports of metformin on immune cell trafficking in cancer and in response to acute inflammation.26–29 We found a significant reduction in Akt and S6 phosphorylation in mice treated with GDC-0084, but tumor growth was maximally inhibited only with GDC-0084 and metformin. Therefore, combination treatment with metformin and GDC-0084 may limit growth signaling through other receptor tyrosine kinase signaling pathways, such as the MAPK pathway.
Our findings demonstrate that reducing insulin feedback in a mouse model of GBM improves the efficacy of PI3K inhibition and that hyperglycemia is a primary mediator of poor efficacy of PI3K inhibition in GBM patients. The results from this work are currently being tested at our institution in a Phase 2 clinical trial using GDC-0084 combined with metformin and the ketogenic diet (NCT05183204). Future studies should be aimed at identifying predictors of PI3K inhibitor resistance in patients treated with combined anti-hyperglycemic therapy.
Funding
This study was supported by the Roland and Gladys Harriman Foundation Bridge Fund (E.K.N.), the Society for Neuro-oncology/PRIME Oncology Young Investigator Award (E.K.N.), the National Institutes of Health (K08 NS128263 to E.K.N.; R35 CA197588 to L.C.C.; P30 CA008748 to Memorial Sloan Kettering Cancer Center and Weill Cornell Medicine, and P50 CA165962 to K.L.L., P.Y.W.), the Stand Up To Cancer-American Association for Cancer Research DT22-17 (L.C.C.), and institutional funds from the Weill Cornell Medicine.
Acknowledgments
We appreciate the help of Mihaela Lupu, Dov Winkelman, Valerie Longo, and Pat Zanzonico at the Memorial Sloan Kettering Cancer Center small animal imaging core facility for assistance on MR brain imaging and the help of Maria Jiao and Sebastien Monette at the Laboratory of Comparative Pathology of Weill Cornell Medicine for assistance in immunohistochemistry. We appreciate the help of Martin Judenhofer and Simon Cherry of the Department of Biomedical Engineering at the University of California at Davis for developing the PET insert used for animal imaging experiments. Funding for imaging studies in this manuscript was also supported by NIH SIG S10 OD023669.
Authorship Statement
Conception and design: E.K.N., L.C; Acquisition of data: E.K.N., L.N.P., I.Y., N.B., H.R., D.J.P., K.Z., H.C.L., S.C., P.Y.W., K.L.L.; Analysis and interpretation of data: E.K.N., L.N.P., I.Y., H.R., J.K., M.B.D., O.E., D.J.P., K.Z., H.C.L., J.A.K., P.Y.W., K.L.L; Writing, review, and/or revision of manuscript: E.K.N., L.N.P., K.L.L., L.C.C; Study supervision: E.K.N., L.C.C.
Conflict of interest statement. E.K.N. is founder/CEO of Destroke. L.C.C. is a founder, shareholder, and member of the scientific advisory board of Agios Pharmaceuticals, co-founder and shareholder of Faeth Therapeutics, and a founder and former member of the scientific advisory board of Ravenna Pharmaceuticals. L.C.C. has received research funding from Ravenna Pharmaceuticals. L.C.C and O.E. are co-founders of Volastra Therapeutics. L.C.C. is a paid advisor to and stockholder in EIP Pharmaceuticals, Cell Signaling Technologies, and Larkspur. O.E. is equity holder in or paid advisor to OneThree Bio, Owkin, Freenome, Champions Oncology, Pionyr Immunotherapeutics, Harmonic Discovery, Acuamark, and Genetic Intelligence. P.W. received research funding from Kazia Therapeutics, Agios, AstraZeneca, Black Diamond, Erasca, Merck, Novartis, Chimerix, Lilly, MedicicNova, Vascular Biogenics, VBI Vaccines, Puma Biotechnology, Celgene, Bayer, Nuvation Bio, Karyopharm Therapeutics and has consulted for Servier, AstraZeneca, Vascular Biogenics, VBI Vaccines, Karyopharm Therapeutics, ElevateBio, Prelude Therapeutics, Novocure, Mundipharma, Black Diamond Therapeutics, Day One Biopharmaceuticals, Sapience Therapeutics, Nuvation Bio, Cellularity, Novartis, Merck, and Chimerix. K.L.L. is a founder, shareholder, and paid consultant for Travera Inc., and paid consultant for BMS, Integragen/OncoDNA.
Data Availability
All original data from this manuscript will be made available upon reasonable request.


