


Abstract
Nearly one-third of patients with neurofibromatosis type 1-associated optic pathway glioma (NF1-OPG) fail frontline chemotherapy; however, little is known about risk factors for treatment failure.
We performed a retrospective multi-institutional cohort study to identify baseline risk factors for treatment-refractory/relapsed disease and poor visual outcome in children with NF1-OPG. Refractory/relapsed NF1-OPG was defined as a requirement of two or more treatment regimens due to progression or relapse.
Of 111 subjects eligible for inclusion, adequate clinical and visual data were available for 103 subjects from 7 institutions. Median follow-up from the initiation of first chemotherapy regimen was 95 months (range 13-185). Eighty-four (82%) subjects received carboplatin-based frontline chemotherapy. Forty-five subjects (44%) experienced refractory/relapsed disease, with a median time of 21.5 months (range 2-149) from the initiation of first treatment to the start of second treatment. The proportion of patients without refractory/relapsed disease at 2 and 5 years was 78% and 60%. In multivariable analyses, age less than 24 months at initial treatment, posterior tumor location, and familial inheritance were associated with refractory/relapsed NF1-OPG by 2 years. Both age less than 24 months and posterior tumor location were associated with refractory/relapsed NF1-OPG by 5 years. Subjects with moderate to severe vision loss at last follow-up were more likely to have posterior tumor location, optic disc abnormalities, or abnormal visual acuity at initial treatment.
Young age, posterior tumor location, and optic disc abnormalities may identify patients with the greatest likelihood of refractory/relapsed NF1-OPG and poor visual outcomes, and who may benefit from newer treatment strategies.
Young age and posterior tumor location are associated with refractory/relapsed NF1-OPG.
Posterior tumor location and optic disc abnormality are associated with poor visual outcomes.
While many children with neurofibromatosis type 1-associated optic pathway glioma (NF1-OPG) respond to initial chemotherapy, a significant subset requires additional therapies for clinical or radiologic progression. A rigorous description of features of children with NF1-OPG who require additional therapies does not exist. Furthermore, outcomes of prior studies are often limited to either radiographic outcomes or visual outcomes, despite evidence demonstrating a poor correlation between imaging findings and visual acuity. This study identifies features associated with both poor clinical and visual outcomes in a large cohort of subjects with NF1-OPG and addresses a critical knowledge gap in risk assessment of NF1-OPG. Recognition of readily identifiable prognostic features of high-risk disease is increasingly important as we consider alternate novel upfront therapies to reduce the long-term burden of visual impairment for patients with NF1-OPG.
Optic pathway glioma (OPG) is a low-grade astrocytic neoplasm of the visual pathway that occurs in 15%-20% of children with the autosomal dominant cancer predisposition syndrome, neurofibromatosis type 1 (NF1).1 Progressive, clinically significant visual acuity (VA) decline is the best indication for treatment of NF1-associated OPG (NF1-OPG), and up to half of the patients with NF1-OPG will require therapy.1,2 When therapy is indicated, chemotherapy is the treatment of choice. Approximately 30% of children treated with chemotherapy will demonstrate continued VA decline after frontline chemotherapy, and up to 30% will require additional therapy within 5 years after initial chemotherapy.3,4 Furthermore, estimates of progression-free survival (PFS) in patients with NF1-OPG are based on a small number of studies, with reported 3- and 5-year PFS rates of 82% (n = 23) and 70%, respectively.4–6 Importantly, little is known about the risk factors for treatment-refractory or relapsed NF1-OPG, and few studies have focused on long-term visual outcomes.
Contrary to other childhood cancers, adequately powered cohort studies to determine risk factors for treatment-refractory or relapsed disease have not been performed for patients receiving chemotherapy for NF1-OPG. For example, well-established prognostic variables for pediatric acute lymphoblastic leukemia influence the approach to therapy, such as age, presenting white blood cell count, and genetic characteristics of the leukemic blast.7 Prognostic variables for NF1-OPG are less firmly established, and patient age, posterior tumor location, and residual tumor volume have been inconsistently described as associated with clinical progression and/or poor visual outcomes.4–6,8,9
A prior retrospective study investigating outcomes after frontline chemotherapy for NF1-OPG identified tumor location in the posterior visual pathway to be associated with VA decline after initial therapy, with young age approaching significance. In that study, radiographic and visual outcomes demonstrated poor correlation; however, the study did not evaluate the need for subsequent treatment regimens or the durability of NF1-OPG response to chemotherapy.3 The largest study to date examining NF1 low-grade glioma (>85% NF1-OPG) outcomes after treatment with carboplatin and vincristine reported residual tumor greater than 3 cm as a prognostic factor for progression but did not find young age to be significant.4 This study did not evaluate visual outcomes. Unfortunately, the barriers to defining these critical prognostic features in NF1-OPG include the lack of standardization of treatment and outcome assessments, preventing rigorous evaluations of features associated with high-risk disease and the effectiveness of therapy.
There is a pressing need to identify patients at high risk for treatment-refractory disease, as current visual outcomes are unacceptable and children with visual impairment experience fewer education and employment opportunities and increases in socioeconomic burden.10,11 For these reasons, we conducted a large retrospective multicenter study to rigorously evaluate potential clinical risk factors for treatment-refractory/relapsed NF1-OPG and poor visual outcomes.
Patients and Methods
This multicenter, retrospective chart review received approval from all ethics committees of the 7 participating sites (Children’s Hospital of Philadelphia [CHOP], Pennsylvania; Children’s National Hospital, Washington, DC; Cincinnati Children’s Hospital Medical Center, Ohio; Ann & Robert H. Lurie Children’s Hospital of Chicago, Illinois; St. Louis Children’s Hospital, Missouri; Lucile Packard Children’s Hospital Stanford, California, SickKids, Toronto, Canada). Informed consent was waived. The study population consisted of children 18 years of age or younger at the time of initial treatment for NF1-OPG and a clinical diagnosis of NF1 using the NIH Consensus Conference criteria or a documented pathogenic constitutional NF1 gene mutation.12 The subjects must have initiated initial chemotherapy after January 1, 2005 and before December 31, 2014. Subjects who received systemic chemotherapy prior to January 1, 2005 or received radiation therapy as initial treatment were excluded. Charts were abstracted for demographic and clinical characteristics of interest, including age at OPG diagnosis, sex, race, ethnicity, age, and tumor location at the initiation of initial and subsequent treatment regimens for OPG, indication for treatment, NF1 inheritance pattern (sporadic vs familial), the presence of non-OPG at initial treatment and last follow-up, and documentation of prior germline NF1 variant testing.
The primary outcomes of interest were treatment-refractory/relapsed NF1-OPG by 2 and 5 years following the initiation of initial chemotherapy regimen. The secondary outcome of interest was long-term VA. Treatment-refractory/relapsed NF1-OPG was defined as the requirement for two or more treatment regimens due to relapse or lack of response. Subjects whose chemotherapy regimen was modified due to allergy or toxicity were not considered to have failed therapy; completion of therapy was defined as the end of treatment with the regimen. Subsequent chemotherapy regimens for an indication other than NF1-OPG were not included in the definition of refractory/relapsed disease. VA data within 3 months of the start of each treatment regimen and at last follow-up were obtained and included VA method and acuity, optic disc appearance (edema and/or pallor), and visual field deficits (1-4 quadrants). Site investigator provided raw VA data and interpretation of VA (abnormal vs normal for age). VA data interpretations were subsequently independently validated by a neuro-ophthalmologist (R.A.A.). Similar to prior studies, a 2-line decrease in VA compared with prior VA was defined as worsening (with adjustment for age-appropriate norms).3 Data were evaluated “per eye” and “per subject.” For per-subject VA outcomes, if one eye worsened, the visual outcome was defined as worsened for the subject. Worsened VA was defined as a reduction in logarithm of the minimal angle of resolution (logMAR) by 0.2 or greater. Moderate-severe vision loss was defined as Snellen equivalent of 20/80 (logMAR of 0.6) or worse. Study data were collected and managed using REDCap electronic data capture tools hosted at CHOP.
Statistical Analysis
For the primary outcome of refractory/relapsed NF1-OPG, log-binomial model was used to determine the association of clinical variables with the outcome of treatment-refractory/relapsed NF1-OPG by 2 and 5 years, and relative risks (RR) and 95% confidence intervals (CIs) were estimated to quantify the associations. The risk factor analysis included only patients who had complete follow-up through 2 and 5 years from the initiation of therapy. Baseline characteristics of subjects who were included in the analysis were compared with the patients who were excluded, using the Wilcoxon test for continuous variables and Fisher’s exact test for categorical variables. Age was categorized for analysis (>= or <2 years) based on findings from prior studies evaluating age as a risk factor for need for initial therapy and progression following treatment.6,13 Tumor location was categorized based on the most posterior optic pathway location involved with tumor as follows: nerve, chiasm, or posterior to the chiasm (including hypothalamus) and analyzed as a binary variable (nerve/chiasm vs posterior to the chiasm) consistent with prior studies.3 For the variables with missing data (optic disc abnormality and baseline quantitative VA), there were no plausible variables to be used for multiple imputation, therefore, the absence of information was coded as one of the categories. Univariate analyses were performed first, and variables that demonstrated some evidence of association (RR > 1.5 or P value < .1) were selected for inclusion in the multivariable model. For the variables with high collinearity, only one of the variables was included in the multivariable model. The sensitivity analysis restricted to subjects who received carboplatin-based frontline chemotherapy was performed given the variation in frontline chemotherapy and potential impact on associations of clinical features with refractory/relapsed NF1-OPG. Another sensitivity analysis was performed by restricting to subjects with abnormal VA for age at initial chemotherapy to control for potential confounding by treatment indication. For the secondary outcomes of VA, we provided descriptive summaries and performed exploratory analyses to compare the category of VA loss at last follow-up by baseline characteristics using Fisher’s exact test. All analyses were performed using Stata 15 (StataCorp LLC, College Station, TX, USA) and a two-sided P < .05 was considered statistically significant.
Results
Demographics
One hundred eleven subjects who met eligibility criteria were identified from 7 tertiary care institutions with established NF programs. Of the subjects who met eligibility for inclusion, treatment data and outcomes were available for 103 subjects. Quantitative VA data at the initiation of therapy were available for 79 subjects. The characteristics of the study population are shown in Table 1. The median age at initial diagnosis of OPG was 25 months (range 2-172 months). The median time from diagnosis of OPG to initial treatment was 5 months (range 0-136 months). About 43% of subjects had tumor posterior to the chiasm at the initiation of chemotherapy. Of the 79 evaluable subjects with baseline objective VA data, 54 (68%) had abnormal VA for age at the initiation of therapy. A carboplatin-containing regimen was initial treatment in 84 (82%) of subjects. VA decline/deficit and radiographic tumor burden/progression were the most frequently identified primary indication for treatment (82% of cohort).
Characteristics of 103 Subjects With Neurofibromatosis Type 1-Associated Optic Pathway Glioma Treated With Chemotherapy
| Characteristic | N = 103 |
|---|---|
| Sex | |
| Female | 56 (54%) |
| Male | 47 (46%) |
| NF1 inheritance | |
| Sporadic | 64 (63%) |
| Familial | 36 (35%) |
| Unknown | 2 (2%) |
| Age at initial diagnosis of OPG, median (range) | 25 months (range 2-172 months) |
| Age at the initiation of therapy, median (range) | 39 months (6-197 months) |
| Most posterior tumor location at the initiation of therapy | |
| Nerve | 27 (26%) |
| Chiasm | 32 (31%) |
| Post-chiasm | 44 (43%) |
| Other gliomas present at the initiation of therapy | |
| Yes | 22 (22%) |
| No | 79 (78%) |
| Optic disc abnormality | |
| Yes | 56 (54%) |
| No | 38 (37%) |
| Unknown | 9 (9%) |
| Abnormal visual acuity for age at initial therapy (per subject) | |
| Yes | 54 (53%) |
| No | 25 (24%) |
| Unknown | 24 (23%) |
| Primary indication for initial therapy | |
| Ophthalmologic | 51 (49.5%) |
| Radiographic | 45 (43.7%) |
| Unknown | 7 (6.8%) |
| Initial treatment regimen | |
| Carbo/vincristine | 78 (75.9%) |
| Carbo monotherapy | 6 (5.8%) |
| Vinblastine | 15 (14.6%) |
| Bevacizumab/irinotecan | 2 (1.9%) |
| Bevacizumab | 1 (0.9%) |
| Bevacizumab/vinblastine | 1 (0.9%) |
| Temozolomide | 1 (0.9%) |
| Subjects per institution | |
| CHOP | 24 (23%) |
| Toronto | 16 (15.5%) |
| CCHMC | 15 (14.6%) |
| Lurie Children’s | 15 (14.6%) |
| Wash U. St. Louis | 12 (11.7%) |
| CNH | 11 (10.7%) |
| Stanford Children’s | 10 (9.9%) |
Abbreviations: Carbo, carboplatin; CCHMC, Cincinnati Children’s Health Medical Center; CHOP, Children’s Hospital of Philadelphia; CNH, Children’s National Hospital; NF1, neurofibromatosis type 1; OPG, optic pathway glioma; Wash U, Washington University.
Clinical Outcomes
The median duration of follow-up for the entire study cohort was 95 months (range 13-185 months; Table 2). Three subjects were lost to follow-up by 2 years and 13 subjects were lost to follow-up by 5 years (2 subjects transitioned to adult institutions, 3 subjects transferred care, remaining reasons for loss to follow-up unknown). Follow-up duration varied only by NF inheritance pattern, with greater 5-year retention for patients with sporadic NF1 (94% of sporadic NF1 vs 78% of familial NF1, P = .03). There were no differences in follow-up by age, sex, tumor location, or baseline VA.
Outcomes of Study Cohort
| Outcome of Interest | N (%) |
|---|---|
| Treatment regimens required | |
| Multiple treatment regimens | 45 (44) |
| Single treatment regimen | 58 (56) |
| Number of required regimens | |
| 1 | 58 (56) |
| 2 | 26 (25) |
| 3 | 8 (8) |
| 4 | 7 (7) |
| >=5 | 4 (4) |
| Refractory/relapsed OPG by 2 years, N = 100 | 22 (22) |
| Refractory/relapsed OPG by 5 years, N = 90 | 36 (40) |
| Time from initial treatment to second regimen, median (range) | 21.5 months (2-149 months) |
| Indication for second regimen, N = 44 | |
| Decline in visual acuity | 18 (41) |
| Radiographic | 22 (50) |
| Other | 4 (9) |
| Second treatment regimen, N = 44 | |
| Carboplatin/vincristine | 6 (13) |
| Vinblastine | 12 (27) |
| Bevacizumab/irinotecan | 8 (18) |
| Temozolomide | 4 (9) |
| MEK inhibitor | 5 (11) |
| Other | 9 (20) |
| Duration of follow-up, median (range) | 95 months (13-185 months) |
Abbreviations: MEK, mitogen-activated kinase kinase; OPG, optic pathway glioma; VA, visual acuity.
Forty-five subjects (44%) experienced refractory/relapsed NF1-OPG, with 19% requiring 3 or more treatment regimens (Table 2). The median time to second treatment regimen from the start of initial chemotherapy was 21.5 months (range 2-149 months). About 22% of subjects required a second treatment regimen within a 2-year post-initiation of chemotherapy. VA abnormalities and radiographic progression were the predominant indications for second-line therapy (91% of subjects). There was a clear variation in chemotherapy regimen for second-line therapy (Table 2). In addition, 6 subjects required therapy for non-OPG after completion of therapy for their NF1-OPG. One subject developed acute lymphoblastic leukemia, and another died during follow-up due to a progressive non-OPG glioma.
Assessment of Clinical Risk Features for Refractory/Relapsed NF1-OPG by 2 Years
A total of 100 subjects had complete 2-year follow-up and were included in the analysis of refractory/relapsed NF1-OPG by 2 years. In univariate analysis, age less than 24 months at initial therapy was significantly associated with refractory/relapsed NF1-OPG by 2 years from the initiation of initial therapy (RR 2.3; 95% CI 1.1-4.6; P = .035) (Table 3). Familial NF1 inheritance (RR 1.9, 95% CI 0.91-3.9, P = .074), the presence of non-OPG (RR 2.1, 95% CI 1.03-4.4, P = .051) and posterior tumor location at initial therapy (RR 2.0, 95% CI 0.94-4.2, P = .056) approached significance. In multivariable analysis, age less than 24 months (adjusted RR 3.2, 95% CI 1.2-5.2, P < .001), posterior tumor location (adjusted RR 2.2, 95% CI 1.1-4.1, P = .020) and familial NF1 inheritance (adjusted RR 2.2, 95% CI 1.2-3.9, P = .009) were significantly associated with higher risk of refractory/relapsed disease by 2 years (Table 3, Figure 1). Non-OPGs met criteria for selection into the multivariable model but were omitted from multivariable analysis due to high co-linearity with age.
Association of Baseline Clinical Features With Risk of Refractory/Relapsed Neurofibromatosis Type 1-Associated Optic Pathway Glioma by 2 and 5 Years
| Clinical Feature | 2-Year Analyses, N = 100 | 5-Year Analyses, N = 90 | ||||||||
|---|---|---|---|---|---|---|---|---|---|---|
| R/R outcome N (%) | RR (95% CI), Unadjusted | P Value, Unadjusted | RR (95% CI), Adjusted | P Value, Adjusted | R/R outcome N (%) | RR (95% CI), Unadjusted | P Value, Unadjusted | RR (95% CI), Adjusted | P Value, Adjusted | |
| Age <24 months | ||||||||||
| Yes | 8 (40) | 2.3 (1.1, 4.6) | .035 | 3.2 (1.9, 5.2) | <.0001 | 11 (58) | 1.7 (1.0, 2.7) | .064 | 1.6 (1.2, 2.3) | .005 |
| No | 14 (17) | Ref | Ref | Ref | Ref | 25 (35) | Ref | Ref | Ref | Ref |
| Sex | ||||||||||
| Male | 9 (20) | 0.83 (0.4, 1.7) | .384 | 16 (39) | 0.95 (0.6, 1.6) | .518 | ||||
| Female | 13 (24) | Ref | Ref | 20 (41) | Ref | Ref | ||||
| NF1 inheritance | ||||||||||
| Familial | 11 (32) | 1.9 (0.91, 3.9) | .074 | 2.2 (1.2, 3.8) | .009 | 15 (54) | 1.6 (0.97, 2.6) | .058 | 1.3 (0.79, 2.0) | .304 |
| Sporadic | 11 (17) | Ref | Ref | Ref | Ref | 20 (33) | Ref | Ref | Ref | Ref |
| Optic disc abnormality | ||||||||||
| Yes | 13 (23) | 1.1 (0.51, 2.6) | .465 | 22 (45) | 1.7 (0.9, 3.1) | .083 | 1.6 (0.89, 2.9) | .107 | ||
| No | 7 (20) | Ref | Ref | 9 (27) | Ref | Ref | Ref | Ref | ||
| Unknown | 2 (22) | 1.1 (0.3, 4.5) | .602 | 5 (62) | 2.3 (1.0, 4.9) | .073 | 1.4 (0.6, 3.3) | .467 | ||
| Presence of non-OPGa | ||||||||||
| Yes | 8 (38) | 2.1 (1.03, 4.4) | .051 | 10 (56) | 1.5 (0.9, 2.5) | .117 | ||||
| No | 16 (18) | Ref | Ref | 26 (37) | Ref | Ref | ||||
| Posterior tumor | ||||||||||
| Yes | 13 (31) | 2.0 (0.94, 4.2) | .056 | 2.2 (1.1, 4.1) | .020 | 19 (53) | 1.7 (1.0, 2.8) | .036 | 1.7 (1.1, 2.7) | .030 |
| No | 9 (15.5) | Ref | Ref | Ref | Ref | 17 (31) | Ref | Ref | Ref | Ref |
| VA at initial therapy | ||||||||||
| Abnormal | 13 (24) | 1.0 (0.7, 1.4) | .615 | 21 (43) | 1.7 (0.8, 3.6) | .133 | 1.5 (0.7, 3.2) | .296 | ||
| Normal | 6 (24) | Ref | Ref | 6 (26) | Ref | Ref | Ref | Ref | ||
| Unknown | 3 (14) | 0.6 (0.2, 2.1) | .4 | 9 (50) | 1.9 (0.8, 4.4) | .106 | 1.9 (0.8, 4.3) | .136 | ||
| Initial chemotherapyb | ||||||||||
| Carboplatin-based | 19 (23) | 3.3 (0.5, 24)b | .131 | 29 (39) | 1.0 (0.5, 2.1) | .56 | ||||
| Vinblastine | 1 (7) | Ref | Ref | 5 (38) | Ref | Ref | ||||
| Bevacizumab/Irino | 1 (50) | N/A | N/A | |||||||
| Other | 1 (100) | N/A | N/A |
Abbreviations: CI, confidence interval; Irino, Irinotecan; NF1, neurofibromatosis type 1; non-OPG, non-optic pathway glioma; R/R, refractory/relapsed disease; Ref, reference; RR, relative risk; VA, visual acuity.
aThe presence of non-OPG not selected into the multivariable model due to high collinearity with age.
bChemotherapy regimen was excluded from regression analysis due to small sample size and unstable estimates.
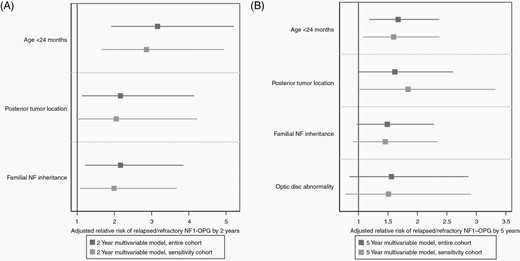
Multivariable analysis with relative risk of treatment-refractory/relapsed neurofibromatosis type 1-associated optic pathway glioma (NF1-OPG) by 2 and 5 years for the entire cohort (black lines) and the carboplatin-restricted sensitivity analysis (gray lines). (A) At 2 years from the initiation of frontline chemotherapy regimen, age less than 24 months and familial inheritance of NF1 were significantly associated with refractory/relapsed NF1-OPG in both the entire cohort and restricted carboplatin-based cohort. (B) At 5 years from the initiation of therapy, age less than 24 months and posterior tumor location were associated with refractory/relapsed NF1-OPG in both cohorts.
Assessment of Clinical Risk Features for Refractory/Relapsed NF1-OPG by 5 Years
A total of 90 subjects had completed 5-year follow-up and were included in the analysis of refractory/relapsed NF1-OPG by 5 years. In univariate analysis, posterior tumor location at initial therapy was significantly associated with refractory/relapsed disease by 5 years from the initiation of therapy (RR 1.7, 95% CI 1.01-2.8, P = .036) (Table 3). Age less than 24 months (RR 1.7, 95% CI 1.0-2.7, P = .064), familial NF1 inheritance (RR 1.6, 95% CI 0.97-2.6, P = .058), abnormal VA for age (RR 1.7, 95% CI 0.8-3.6, P = .133), and the presence of an optic disc abnormality (RR 1.7, 95% CI 0.9-3.1, P = .083) approached significance based on RR and P value and met selection criteria for inclusion into the multivariable model. In multivariable analysis, age less than 24 months (adjusted RR 1.6, 95% CI 1.2-2.3, P = .005) and posterior tumor location (adjusted RR 1.7, 95% CI 1.1-2.7, P = .030) were significantly associated with higher risk of refractory/relapsed NF1-OPG by 5 years (Table 3, Figure 1). Optic disc abnormality (adjusted RR 1.6, 95% CI 0.9-2.9, P = .107) showed modest association with refractory/relapsed disease by 5 years but was not statistically significant.
Sensitivity Analyses
In a sensitivity analysis restricted to subjects who received carboplatin-based frontline chemotherapy (N = 82), the multivariable analysis suggested that age (adjusted RR 2.9, P < .001 for 2-year analysis and RR 1.7, P = .012 for 5-year analysis) and posterior tumor location (adjusted RR 2.0, P = .051 for 2-year analysis and adjusted RR 1.8, P = .036 for 5-year analysis) demonstrated sustained association with higher risk of refractory/relapsed disease (Figure 1, Supplementary Table 1). Familial NF1 inheritance was significantly associated with refractory/relapsed disease by 2 years (adjusted RR 2.0, 95% CI 1.1-3.7, P = .028) but was not significant in the 5-year analysis.
The sensitivity analysis restricted to subjects with abnormal VA for age at initial chemotherapy yielded unstable RR estimates and very wide CIs due to small sample size (N = 54) so results were not presented.
Subjects Treated With Three or More Regimens
To determine whether clinical characteristics differ in subjects with multiply refractory NF1-OPG compared to those treated with two regimens or less, an analysis was performed between the groups. There were no significant differences between characteristics of subjects treated with 3 or more regimens (n = 19) compared to 2 or less (n = 81). Neither age less than 24 months (RR 1.5, P = .291) nor posterior tumor location (RR 1.0, P = .581) was associated with need for additional therapy beyond 2 regimens.
Visual Outcomes
Quantitative VA data were available at initial therapy for 74 subjects (147 evaluable eyes) and at last follow-up for 101 subjects (199 eyes). Of the 74 subjects with quantitative VA at the initiation of therapy, 35% demonstrated worsened VA at last follow-up (Supplementary Table 2). Not surprisingly, a higher percentage of subjects with refractory/relapsed NF1-OPG (56%) had a decline in VA from baseline to last follow-up compared with singly treated subjects (21%) (Figure 2C). In an analysis of the best eye at the initiation of therapy, 34% of subjects had normal vision (logMAR <=0.1) and 24% of subjects had moderate-severe vision loss. At last follow-up, 57% (n = 57) of subjects had normal vision and 22% (n = 22) of subjects had moderate-severe vision loss in their best eye (Table 2). Of singly treated subjects, 9% had moderate-severe vision loss in their best eye as compared to 40% of refractory/relapsed subjects at last follow-up (Figure 2). In an analysis of VA of worst eye, the overall proportion of subjects with moderate-severe vision loss decreased from 56% at initial therapy to 51% at last follow-up. Of singly treated subjects, 31% had moderate-severe vision loss in their worst eye at last follow-up compared to 79% of subjects with refractory/relapsed disease (Supplementary Table 2).
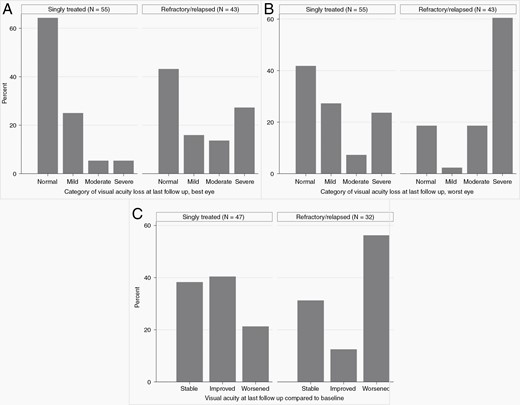
Category of visual acuity loss at last follow-up, by singly treated vs treatment-refractory/multiply relapsed status. (A) At last follow-up, 9% of singly treated and 40% of refractory/relapsed neurofibromatosis type 1-associated optic pathway glioma (NF1-OPG) had moderate-severe visual acuity loss in their best eye. (B) In the evaluation of worst eye, 31% of singly treated and 79% of refractory/relapsed NF1-OPG had moderate-severe vision loss. (C) Compared to baseline, 21% of singly treated and 56% of refractory/relapsed NF1-OPG subjects had worsened visual acuity at last follow-up, defined as a reduction in logarithm of the minimal angle of resolution by 0.2 or greater in either eye compared to baseline.
The association of baseline clinical features and moderate-severe vision loss at last follow-up was explored. Subjects with moderate-severe vision loss in their best eye at last follow-up were significantly more likely at initial therapy to have optic disc abnormality (31% vs 11%, P = .024), the presence of non-OPG (41% vs 17%, P = .02), posterior tumor location (36% vs 12%, P = .005), and abnormal VA (35% vs 0%, P < .001) (Supplementary Table 3). Familial NF1 inheritance approached significance (32% vs 16%, P = .054). For the evaluation of subject’s worst eye, only optic disc abnormality (71% vs 22%, P < .001) and abnormal VA (70% vs 24%, P < .001) achieved significance.
Discussion
In our study, young age and posterior tumor location are associated with increased risk for treatment-refractory/relapsed NF1-OPG by 2 and 5 years after the initiation of therapy. Posterior tumor location and optic disc abnormality are associated with increased risk for both refractory/relapsed NF1-OPG and poor visual outcomes. Prior studies have inconsistently reported young age, posterior tumor location, and optic disc abnormalities as risk factors for OPG progression or poor visual outcomes.5,9,14,15 This study confirms these clinical features as associated with high-risk disease for both poor clinical and visual outcomes, as well as identifying additional potentially important clinical features in a large, uniform population of subjects with NF1-OPG. Furthermore, the study sample appears to be representative of prior study populations, with proportions of subjects without refractory/relapsed disease of 78% at 2 and 60% at 5 years, which are comparable to the previously reported event free survival by Ater et al in children with NF1 and low-grade glioma.4
Previous studies have suggested young age as associated with need for initial therapy or poor long-term visual outcomes in patients with NF1-OPG.3,6 In our cohort, age less than 24 months at initial therapy confers the highest risk of difficult to treat disease, based on the sustained significance for refractory/relapsed disease in univariate and multivariable analysis at 2 and 5 years. However, as in previous studies, there was not a clear association between young age and poor visual outcomes.3,6 It is possible that young age offers some unidentified protective mechanism for visual recovery, lessening the impact of age on long-term visual outcomes. It is also possible that young children experience increased re-treatment due to perceived risks with younger age and not due to actual increased risk of vision loss. The relationship between age and high-risk disease will need to be explored in future prospective studies. Additionally, like prior studies, posterior tumor location was associated with increased risk of treatment-refractory/relapsed disease and likelihood of moderate-severe vision loss at last follow-up in this study.3,9,15,16 Previous studies have also inconsistently implicated baseline optic disc abnormalities as prognostic for poor VA outcomes.3 The identification of an association between optic disc abnormalities and poor long-term clinical and visual outcomes in our study suggests that baseline disc abnormalities are associated with poorer outcomes and likely reflect nerve damage even in the absence of concurrent decline in VA. Contrary to prior findings, our results do not suggest that females are at increased risk for treatment-refractory/relapsed disease or poor visual outcomes (Table 3, Supplementary Table 3).2,17
Although carboplatin-containing regimens are utilized as frontline therapy for NF1-OPG in most institutions, in our cohort there was significant variability in initial chemotherapy, likely reflecting the preference of a single institution for vinblastine. However, there was no significant difference in treatment-refractory/relapsed disease by 2 or 5 years between those treated initially with carboplatin-based therapy vs vinblastine (P = .131 and .56, respectively). Given the concern for effect modification by frontline chemotherapy regimen, we performed a sensitivity analysis restricted to those receiving carboplatin-based frontline therapy to generate a more homogeneous cohort with uniform chemotherapy exposure. Both the univariate and multivariable sensitivity analyses supported the importance of the clinical features identified in the entire cohort irrespective of initial chemotherapy (Supplementary Table 1).
While VA decline is now considered the strongest indication for therapy for NF1-OPG, one-third of subjects in our cohort with evaluable vision at baseline had normal quantitative VA at the initiation of chemotherapy (Table 1).3 This likely reflects the evolution of treatment indications during and since the study period, as a subset of the subjects may have been treated before the importance of visual outcomes for NF1-OPG was widely established. To address the potential influence of treatment indication on the measures of association, a second sensitivity analysis was performed restricting to subjects who had abnormal VA for age at baseline; unfortunately, the interpretation of this analysis was limited by unstable RR estimates in the setting of small sample size. Ideally, ongoing studies that prospectively record treatment indication, such as the ongoing NF1-OPG natural history study, may help confirm our results.
To our knowledge, no studies to date have described the incidence of concurrent non-OPG in children with NF1-OPG nor examined its association at the time of initial treatment with response to chemotherapy. The presence of non-OPG in combination with NF1-OPG may suggest a more aggressive phenotype. While non-OPG was significant in univariate analysis, we were limited in evaluation in the multivariable analysis due to high collinearity with age. It would be interesting to explore if these subjects demonstrated a prevalent genotype, such as whole NF1 gene deletion, which has previously been reported to be associated with a more severe phenotype of NF1.18 Alternatively, this association may reflect an increased inclination for re-treatment due to the dual indication of two separate glioma. We attempted to limit this potential misclassification by excluding subsequent chemotherapy regimens intended to treat non-OPG; however, more complex decision making regarding treatment may not have been fully captured in this retrospective study.
In addition, the association of familial inheritance of NF1 with relapsed/refractory NF1-OPG in multivariable analyses also suggests potential genotype-phenotype correlations with high-risk disease; however, the measures of association were less robust across analyses, suggesting that this may be a less reliable risk factor than age and tumor location. Importantly, prior studies evaluating patient characteristics associated with NF1-OPG clinical outcomes do not report analyses of pattern of inheritance, suggesting that it was unlikely to have been identified as significant.6,19 Unfortunately, only 35% of subjects in this study had prior NF1 germline testing conducted which did not provide adequate power for the evaluation of potential genotype-phenotype associations. Future prospective studies may consider gathering genotypic data for patients to explore the landscape of NF1 variants in sporadic vs familial patients with treatment-refractory/relapsed NF1-OPG.
Limitations of the study include the use of multiple treatment regimens as a surrogate for high-risk disease. It is possible that visual “pseudo-progression” (ie, initial loss of some vision due to ongoing axonal injury after the initiation of therapy) or lack of clinical improvement early after treatment initiation may have prompted a change in therapy. In fact, 3 of the 4 subjects transitioned to alternate treatment within 2 months of the initiation of frontline chemotherapy were reported to have progressive, clinically significant VA decline as the indication for alternate therapy; however, at present, there is no way to reliably distinguish visual progression from visual “pseudo-progression.” In all 3 cases, the VA data supporting the clinical decision making revealed >0.2 change in logMAR from the initiation of frontline to second treatment regimen; thus, while clinical pseudo-progression may have occurred, we postulate that most clinicians would consider these subjects treatment-refractory and modify therapy. In addition, VA outcomes at last follow-up were obtained at varying time points after therapy, creating complexities for statistical analysis given the varying follow-up time. For this reason, we were limited to assessing the relationship between proportions of subjects with a baseline clinical feature and the outcome of interest at last follow-up. In addition, there were significant missing data for baseline VA, due to both challenges in acquiring data in young children and missing medical records. This limited our ability to evaluate baseline VA as a potential confounder or effect modifier in the sensitivity analysis. Differential losses to follow-up can introduce bias into retrospective cohort studies; however, our losses to follow-up did not appear significant, with no differences in features of subjects who were retained vs lost, other than the inheritance pattern of NF1. It is possible that with the retention of the entire cohort, familial inheritance would have been established as a more robust or less reliable risk factor for high-risk disease.
In summary, our multi-institutional study identified young age, posterior tumor location, and optic disc abnormality at the initiation of chemotherapy as risk factors for refractory/relapsed NF1-OPG and poor visual outcomes. The identification of features associated with both poor clinical and visual outcomes in multivariable and sensitivity analyses addresses a critical knowledge gap in risk assessment for outcomes of patients with NF1-OPG. Hopefully, an ongoing multicenter NF1-OPG natural history study as well as the Children’s Oncology Group clinical trial ACNS1831 (NCT03871257) will provide prospective data for these clinical risk factors in addition to determining the efficacy of alternate therapies. Following confirmation of these results in prospective studies, the features identified in this study may identify a cohort at increased risk for refractory/relapsed NF1-OPG and guide treatment approach or surveillance following chemotherapy.
Acknowledgments
The authors thank Dr. Michael Harhay for providing STATA code for the included figures and Jacob G. Ellen for his contributions to data acquisition.
Funding
This work was supported by the National Institutes of Health Cancer Clinical Epidemiology Training [T32-CA-09679 to C.K.].
Conflict of interest statement. The authors have no conflicts of interest to disclose.
Authorship statement. Design of research approach: C.K., K.D.G., and M.J.F. Acquisition of data: C.K., R.O.A., E.B., P.D., R.L., D.H.G., M.B., C.C., and G.T.L. Data analysis: C.K., R.I.A., K.D.G., and Y.L. Draft of manuscript: C.K. All authors critically reviewed and revised the manuscript.


