


The recent publication by Girardi et al provides an insightful global overview on the histology of all brain tumors.1 The authors report a wide variation in the histological distribution of brain tumors and present large international differences in the registration of tumors with non-malignant behavior. The latter is especially notable within the pediatric population. The authors also found these differences within Europe, despite the fact that the European Network of Cancer Registries (ENCR) already recommended in 1998 to include all CNS tumors in cancer registries independent of their behavior. These findings are in line with Gatta et al2 who reported a contribution range of 24%-52% of non-malignant tumors for European countries with a declared complete coverage.
Underlying reasons are incomplete collection of non-malignant tumors as a result of inadequate notification (eg, dependency of a registry on notification sources not covering the whole CNS tumor population). Also due to incomplete sources, the correct behavior code cannot always be assigned. On a total of 22 147 European children, the authors found that almost 10% of all cases were not microscopically verified. This was especially notable within the unspecified glioma (59%) and unspecified neoplasm group (66%). Coding practices of non-microscopically verified tumors differ largely between countries and is another important contributor to the differences found in the proportion of non-malignant tumors.
Studies making use of cancer registries commonly report brain tumors according to their behavior code.2–4 This grouping scheme could potentially lead to biased estimates of incidence and survival.
To give an indication of the distorting effects that different proportions of non-malignant and malignant tumors may have, we analyzed data from The Netherlands Cancer Registry (NCR) for the period 2000-2017 for children and adolescents <18 years diagnosed with a brain tumor (N = 2705). Details on the analyzed population and the NCR are published elsewhere.5 In line with Ostrom et al6 who looked at the effect of misclassification of pilocytic astrocytomas, we reclassified a random sample of non-malignant tumors to malignant tumors to form different distributions (ie, 10%/90%, 20%/80%, 30%/70%, and 40%/60%), or vice versa for the 50%/50% distribution (real distribution 49%/51%), and estimated the effect on age-standardized incidence rates and 5-year overall survival (OS). Incidence rates were calculated as the average annual number of cases per million person-years using the annual mid-year population size as obtained from the Statistics Netherlands (CBS). For standardization of incidence for the age group 0-17, the weights of the Segi world standard population were used.7 Five-year OS was estimated by the Kaplan-Meier method.
The age-standardized incidence rates for non-malignant and malignant tumors are presented in Figure 1A and B, respectively. Incidence rates were affected equally and constant for malignant and non-malignant tumors. Depending on the behavior group, incidence changed with ~0.4 per million person-years with every 10% shift.
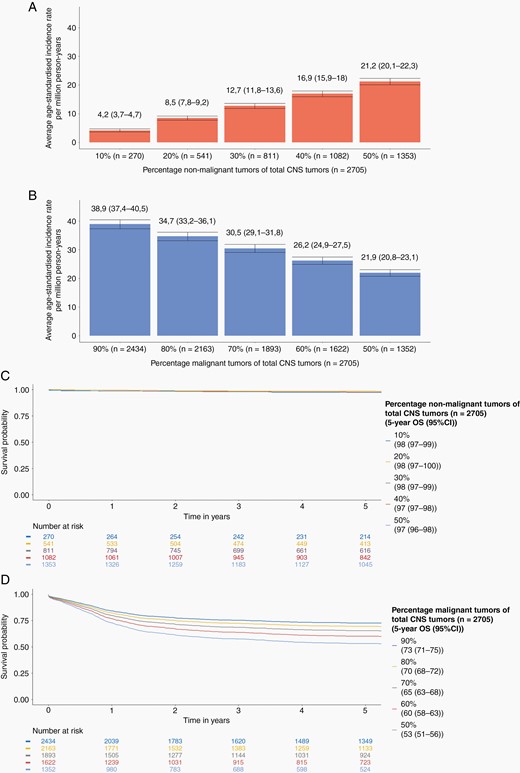
The effect of reclassification of non-malignant or malignant tumors on age-standardized incidence rates and overall survival (OS) of childhood and adolescent (<18 years) brain tumors in the Netherlands for the period 2000-2017 (Source: The Netherlands Cancer Registry). (A) Age-standardized incidence rates including their 95% confidence interval for different distributions of non-malignant tumors (B) Age-standardized incidence rates including their 95% confidence interval for different distributions of malignant tumors. OS for different distributions of non-malignant and malignant tumors for (C) non-malignant tumors and (D) malignant tumors.
No effect was found on 5-year OS for non-malignant tumors as OS rates remained stable for all presented distributions (Figure 1C). However, large differences in OS were found for malignant tumors (Figure 1D). Misclassifying 10% of non-malignant as malignant tumors showed a change in 5-year OS of malignant tumors up to +7 percent points. A 20% misclassification resulted in a further increase in OS of +12 percent points. Of note, a 20% difference is well within the contribution range of 24%-52% of non-malignant cases as reported by Gatta et al.2
In summary, our results indicate that differences in the proportion of non-malignant tumors may directly affect estimates of incidence and survival. An important contributor to the differences in the proportion of non-malignant tumors is the non-microscopically verified tumors. Recently, the ENCR initiated a working group to harmonize registration guidelines on clinical diagnoses without microscopic verification (O.V., personal communication). This will be the next step to further improve the quality of the European population-based data on brain tumors leading to less misclassifications and a more accurate comparison between countries.
Funding
This work was supported by the Stichting Kinderen Kankervrij (KiKa) (project number 207) and the Princess Máxima Center for Pediatric Oncology. The funding source had no role in study design, collection, analysis and interpretation of data, or writing of this manuscript.
Conflict of interest statement. The authors declare that they have no conflict of interest.
Authorship statement. Study design: R.H., H.K.K., J.L., and D.G.V. Data collection and analyses: Netherlands Comprehensive Cancer Organization (data collection), R.H., H.K.K. (analyses). Data interpretation and writing of the manuscript: R.H. and H.K.K. Revision of the manuscript, and final approval of the manuscript: all authors.


