


Abstract
The protein kinase ataxia telangiectasia mutated (ATM) mediates cellular response to DNA damage induced by radiation. ATM inhibition decreases DNA damage repair in tumor cells and affects tumor growth. AZD1390 is a novel, highly potent, selective ATM inhibitor designed to cross the blood–brain barrier (BBB) and currently evaluated with radiotherapy in a phase I study in patients with brain malignancies. In the present study, PET was used to measure brain exposure of 11C-labeled AZD1390 after intravenous (i.v.) bolus administration in healthy subjects with an intact BBB.
AZD1390 was radiolabeled with carbon-11 and a microdose (mean injected mass 1.21 µg) was injected in 8 male subjects (21–65 y). The radioactivity concentration of [11C]AZD1390 in brain was measured using a high-resolution PET system. Radioactivity in arterial blood was measured to obtain a metabolite corrected arterial input function for quantitative image analysis. Participants were monitored by laboratory examinations, vital signs, electrocardiogram, adverse events.
The brain radioactivity concentration of [11C]AZD1390 was 0.64 SUV (standard uptake value) and reached maximum 1.00% of injected dose at Tmax[brain] of 21 min (time of maximum brain radioactivity concentration) after i.v. injection. The whole brain total distribution volume was 5.20 mL*cm−3. No adverse events related to [11C]AZD1390 were reported.
This study demonstrates that [11C]AZD1390 crosses the intact BBB and supports development of AZD1390 for the treatment of glioblastoma multiforme or other brain malignancies. Moreover, it illustrates the potential of PET microdosing in predicting and guiding dose range and schedule for subsequent clinical studies.
The novel ATM inhibitor AZD1390 (radiosensitizer) has been designed to cross the BBB.
The present PET study confirms that AZD1390 reaches the brain in healthy subjects with intact BBB.
The study supports that AZD1390 can be developed as a candidate drug for brain malignancies.
The development of drugs for the treatment of brain tumors has often been hampered by poor brain exposure. Non-invasive molecular imaging is an efficient way to estimate brain exposure of drugs in humans and accelerate their development for the treatment of brain malignancies. ATM kinase plays an essential role in DNA damage response to radiation which is standard in the treatment of gliobastoma and other brain tumors. An ATM inhibitor (ATMi) that could reach sufficient brain exposure is of interest for drug development. The ATMi AZD1390 has been chemically designed to cross the BBB and is currently evaluated in patients with brain tumors. The present PET study confirms that AZD1390 crosses the intact BBB in humans and thus has potential for reaching therapeutic brain exposure in patients. The finding supports AZD1390 as a candidate drug for the treatment of brain malignancies.
Glioblastoma (GBM) is one of the most incurable human cancers. The current standard of care, including surgery followed by radiation therapy and adjuvant chemotherapy, still provides poor prognosis, with 2 year survival of 27%.1 Treatment failures are related to the heterogeneous biology of the tumors, diffuse infiltrative pattern, and rapid development of resistance to available treatments. In addition, the presence of the blood–brain barrier (BBB) has hampered the development of new drugs that achieve therapeutic concentrations in the CNS.2 The BBB is composed of endothelial cells with tight junctions and contains multiple efflux transporters, including P-glycoprotein (P-gp) and breast cancer resistance protein (BCRP). These transporters actively pump synthetic and toxic molecules back from endothelial cells into the bloodstream, thereby preventing access to the brain. Ideally, a novel CNS drug should not be a substrate for these transporter proteins and should achieve free brain exposure equal to that in plasma. In other words, to achieve therapeutic brain exposure the systemic concentrations do not to have to increase disproportionally in the plasma and cause unwanted toxicity outside the brain.3
New therapeutic approaches are needed to increase survival of patients with GBM. One possible avenue is the use of radiosensitizers, agents that would enhance efficacy of radiation. The ataxia telangiectasia mutated kinase (ATM) serves as a primary sensor and a master transducer of the DNA damage signal. Importantly, ATM provides a link between DNA damage recognition and multiple cellular responses to this damage, such as DNA damage repair (DDR), DNA replication, cell cycle checkpoint arrest, or cell death.4,5 Multiple studies have demonstrated that cell lines deficient in ATM are exclusively sensitive to radiation treatment (RT), and ATM inhibitors have been proposed as a strategy to sensitize tumors to radiation despite some concerns over sensitization effects on normal tissues.6 With the advent of increasingly more precise approaches to deliver RT, there is renewed interest in developing potent radiosensitizers to enhance antitumor properties of this treatment modality. Several ATM inhibitors targeting the ATM pathway in DDR are currently explored, though most efforts are still in early phases of development.7 In neuro-oncology, ATM is a particularly attractive target, since it has been shown to be upregulated in glioma stem cells and is implicated in the mechanism of glioma radioresistance.6,8
AZD1390 is a novel, highly potent (cell half-maximal inhibitory concentration, 0.78 nM), and selective ATM inhibitor developed by AstraZeneca and currently being examined in a phase I study in combination with RT for the treatment of GBM and brain metastases from solid tumours (NCT03423628). Preliminary in vitro data indicate that AZD1390 has a low efflux liability against the human efflux transporters P-gp and BCRP, supporting the suitability of AZD1390 as a CNS compound.9
PET imaging following microdose administration of 11C-labeled drug molecules is increasingly used to examine distribution of the labeled drug in brain and whole body.10–12 This PET microdosing approach has since long been supported and encouraged by European and US regulatory agencies.13,14 As part of the AZD1390 development program, an initial PET study in non-human primates has been carried out. This study demonstrated that a microdose of 11C-labeled AZD1390 administered intravenously (i.v.) enters the brain rapidly, reaching a maximum concentration of 0.68% ID (% of injected dose).9 This observation supports that [11C]AZD1390 can penetrate the intact BBB of the primate brain and is in the range of brain exposure achieved by CNS drugs used in the clinic.15
The aim of the present phase I PET study was to assess brain exposure of AZD1390 by measuring the brain concentration of a microdose of 11C-labeled AZD1390 in 8 healthy subjects with an intact BBB. The data were interpreted by simple descriptive PET image analysis as well as by a compartment analysis with a metabolite corrected arterial input function.
Materials and Methods
Design and Subjects
The study (ClinTrials.gov NCT03215381) was approved by the Regional Ethics Review Board in Stockholm, the Radiation Safety Committee at the Karolinska University Hospital, and the Swedish Medical Products Agency and was conducted in accordance with the current amendment of the Declaration of Helsinki and International Conference on Harmonization/Good Clinical Practice guidelines. Written informed consent was obtained from all subjects prior to initiation of the study. The subjects were recruited, and PET measurements were performed at the PET Centre, Karolinska Institutet, Stockholm, Sweden. MRI examinations were performed by the MRI Centre, Physician’s House at Odenplan, Stockholm. The study was carried out from October 2017 to January 2018.
Subjects were eligible if they were male, aged 20–65 years of age, had no significant medical history, and were healthy as determined by medical history, physical examination, electrocardiogram (ECG), routine blood and urine analyses, and brain MRI. Throughout the study, safety was monitored by laboratory examinations, recording of vital signs, ECG readings, and collection of adverse events (AEs), the latter also following 30 days after PET examination.
Radiochemistry
[11C]AZD1390 (molecular mass 346.48 g/mol) was prepared by reaction of the N-desmethyl precursor with carbon-11 labeled methyl triflate16 (Supplementary Figure 1). At each examination, a saline solution containing [11C]AZD1390 with a mean radioactivity 288 MBq (range 232–369 MBq, n = 8) was injected in the cubital vein as a bolus over 10 s. The mean molar radioactivity at the time of injection was 182 GBq/μmol (range 28–260 GBq/μmol), and the corresponding injected mass was 1.21 µg (range 0.46–4.67 µg) of [11C]AZD1390.
Magnetic Resonance and PET Imaging Measurements
In each subject, 2 anatomical brain MRI sequences were acquired using a 1.5 T GE Signa system (GE Medical Systems). T2-weighted images were used for clinical evaluation by a neuroradiologist and to exclude the presence of brain pathology. T1-weighted images were used for co-registration with PET and automatic delineation of the brain regions of interest.
PET examinations were performed using a high-resolution research tomograph (Siemens/CTI) over 90 minutes. A plastic helmet was made individually for each subject and used during the PET examination in order to minimize head movements.17 First, the attenuation correction was acquired with a 6-minute transmission measurement using a single 137Cs source. PET data were then acquired for 93 minutes after i.v. injection of [11C]AZD1390.
List-mode data were binned and reconstructed in 3D as previously described.18 Images were then reconstructed for a series of 38 time frames. The sequence and duration of frames was 9 × 10 s, 2 × 15 s, 3 × 20 s, 4 × 30 s, 4 × 60 s, 4 × 3 min, and 12 × 6 min. The subsequent quantitative compartmental analysis (see below) was based on PET data acquired between 0 and 93 minutes after injection.
Radioactivity Measurements in Arterial Blood and Plasma
A catheter was inserted into the radial artery and arterial blood was collected continuously during the first 10 min using an automated blood sampling system (ABSS; Allogg). Thereafter, a series of arterial blood samples (2 mL) were drawn manually at ~ 2, 4, 6, 8, 10, 15, 20, 25, 30, 40, 50, 70, and 90 min after radioligand injection. The radioactivity counts per second were immediately measured for 10 s in a well counter cross-calibrated with the PET system. After centrifugation, 0.2 mL plasma was pipetted, and plasma radioactivity was immediately measured in a well counter.
Unchanged [11C]AZD1390 and Radioactive Metabolites in Plasma
The fraction of plasma radioactivity corresponding to unchanged [11C]AZD1390 was immediately measured in arterial blood samples at 2, 4, 10, 20, 30, 40, 60, and 75 min after radioligand injection. The plasma obtained after centrifugation of blood was deproteinized with acetonitrile and analyzed by high-performance liquid chromatography (radio-HPLC system).19,20
Generation of Arterial Input Function
The time curve representing the plasma radioactivity of unchanged radioligand (ie, the metabolite corrected arterial input function) was generated based on data obtained from ABSS and manual blood and plasma samples according to previously described procedures.21 Correction for radioactive metabolites was performed using a population- based approach to fit the fraction of parent radioligand in the plasma using an empirical model consisting of a mixture of the Hill and Richards equations.22
Determination of AZD1390 Free Fraction in Plasma
The free fraction (fu, plasma) of AZD1390 in human plasma was determined in vitro via an equilibrium dialysis method using a rapid equilibrium device (Thermo Fisher Scientific). Non-labeled AZD1390 in human plasma at 0.1 µM was dialyzed at 37°C for 16 h. Aliquots of each post-dialysis sample from both receiving and donating dialysis chambers were mixed with equal volumes of either buffer or human plasma, respectively. The samples were extracted via protein precipitation and then analyzed by liquid chromatography with mass spectrometric detection. The value of fu, plasma was calculated by dividing the concentration in the buffer samples by the concentration in the plasma samples. The determination of fu, plasma was performed in triplicate.
Quantification of [11C]AZD1390 Brain Exposure
The T1-weighted MR images were reoriented according to the line defined by the anterior and posterior commissures, resampled and cropped to generate a 220 × 220 × 170 matrix with 1 mm3 voxels. The MR image was segmented into gray and white matter and CSF, and spatial normalization parameters to Montreal Neurological Institute template space were obtained using SPM12 software (Wellcome Department of Cognitive Neurology, UK) and co-registered with the PET images.
Anatomical brain regions of interest (ROIs) were delineated in the space of the realigned MR image using the automated anatomical labeling (AAL) template as described before.23,24 From the available regions in the AAL template, 6 ROIs representing cortical and subcortical brain areas were selected for further evaluation and presentation: frontal cortex, caudate nucleus, putamen, thalamus, pons, cerebellum. In addition, a whole brain ROI and gray and white matter ROIs were obtained, using the MRI segment images and the ROI for choroid plexus was delineated manually on the PET summation image (for detailed ROI definitions, see Supplement).
Time-activity curves (TACs) for the regional brain and plasma radioactivity concentrations were generated from the sequence of images and expressed as the standardized uptake value (SUV = [kBq • cm−3 / (MBq injected/body weight)]). The maximum brain radioactivity concentration expressed as SUV (Cmax [brain]) and the time of maximum brain radioactivity concentration (Tmax [brain]) were calculated from the TACs. In addition, maximum brain radioactivity expressed as %IDmax[brain] was calculated using the time curve for the percentage of injected radioactivity in brain. This time curve was obtained by multiplying average radioactivity in the brain with the volume of the brain and then dividing by the radioactivity injected and multiplying by 100.
A quantitative analysis of [11C]AZD1390 brain exposure was further performed using 2-tissue and 1-tissue compartment models (2TCM, 1TCM) for reversible drug binding and the metabolite corrected arterial plasma concentration curve as input function (Fig. 1, for more detail see Supplement).21,25
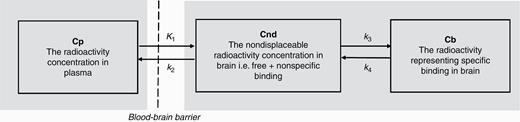
The 2-tissue compartment model used to interpret regional brain radioactivity after i.v. injection of a radiolabeled drug. K1, k2, k3, k4 are first order rate constants with the dimension 1/min.
Calculation of Kp,uu
It is of interest to compare the free (unbound) concentration in plasma with the free (unbound) concentration in brain. However, the free (unbound) concentration in brain cannot be disentangled from the total concentration obtained from a PET measurement. To calculate the brain-to-plasma partition coefficient (Kp, uu) we used the PET-derived VT values obtained using 2TCM. The reference value of fu,brain applied in the calculation of Kp, uu in humans was obtained from a previously run assay of rat brain tissue slices in vitro and was 0.0126 and was used based on reported species independence.27 Estimates of the unbound drug in human plasma (fu, plasma) were obtained from the equilibrium dialysis method described above and the reference value was 0.22.
Consequently, the free brain-to-plasma ratio (Kp, uu) was calculated based on VT and the free fractions of AZD1390 in brain and plasma (fu,brain and fu,plasma) according 15to equation (3)
Statistics
In the compartment analysis, the Akaike information criterion (AIC)28 and F statistics were used to identify the statistically preferred model configuration. All analyses were performed using Matlab R2014b (http://de.mathworks.com).
Results
Subject Disposition
Eleven subjects were enrolled. Eight male subjects aged 21–65 participated in the study and 3 were excluded due to screen failure, non-compliance, and failure of radial artery catheterization. No adverse events related to the microdose of [11C]AZD1390 were reported.
Brain Distribution of [11C]AZD1390Q
After i.v. bolus administration (10 s) of [11C]AZD1390, radioactivity rapidly reached the brain in all study subjects (Fig. 2A). Brain radioactivity was generally higher in gray than in white matter. Among the gray matter regions, the radioactivity concentration was highest in the thalamus and frontal cortex, followed by the striatum, cerebellum, and pons. An unexpectedly high radioactivity in the choroid plexus throughout the ventricular system was observed (Fig. 2B), reaching more than 10-fold higher SUV than other brain regions in all subjects (Fig. 2C, example of individual subject).
![A. Radioactivity images superimposed on MR images after i.v. administration of [11C]AZD1390 (summation 0–93 minutes) in 8 study subjects. SUV, standard uptake value. B. 3D volume rendering of [11C]AZD1390 regional distribution. C. Radioactivity time curves for different brain regions from representative subject S05. Brain regions shown were selected to represent different brain areas. Similar data were obtained across subjects.](https://oup.silverchair-cdn.com/oup/backfile/Content_public/Journal/neuro-oncology/23/4/10.1093_neuonc_noaa238/1/m_noaa238f0002.jpeg?Expires=1750367869&Signature=gnU1AoyEIDXX5BPPWbYFLDOM4QdCGRqu8kSdNawCweLQO828CQ0gEdoi~xwz3or0az2NWrOylshIyBzZnEy65ZW70VFQrcywNC0IobLdLmSbY27zjFqspch-im~wxRTW5HOp218gg7UeYTE5Sam6dtmgRXVSVMxMHHAEXZyhE7pRI4bhQQ2VO-Wv4aXJt10BWSm0WtvDdxEawo0muO1X9QEXQ-gXkrvzPAw2IOBQOPkQ~2nwVSfoEiZmPNofJNqzpIJTRwg56UKXijVaC7rRMe-0nkR0mXgQ2q8A1XBjBYhdPnjO-jq9bnJZAqUpWdoUSrxNHFLM~Q4o~4hJCA5-ug__&Key-Pair-Id=APKAIE5G5CRDK6RD3PGA)
A. Radioactivity images superimposed on MR images after i.v. administration of [11C]AZD1390 (summation 0–93 minutes) in 8 study subjects. SUV, standard uptake value. B. 3D volume rendering of [11C]AZD1390 regional distribution. C. Radioactivity time curves for different brain regions from representative subject S05. Brain regions shown were selected to represent different brain areas. Similar data were obtained across subjects.
Time Curves for Radioactivity in Plasma and Brain
After i.v. injection, radioactivity in blood reached a peak within 1 minute, followed by a rapid decrease during the initial 5 minutes of measurement. The rate of the decrease in plasma was slow at later times (30–90 min) after injection (Fig. 3A).
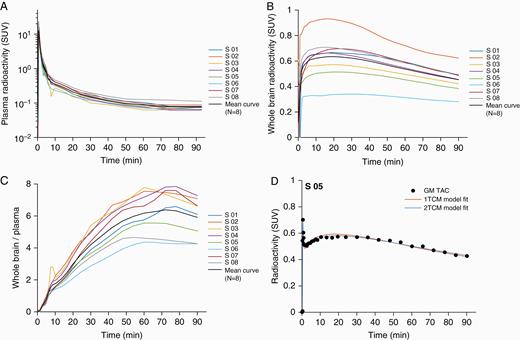
Radioactivity time curves: presentation of individual subjects and group mean curves: (A) for plasma, (B) for the whole brain, (C) for brain –to –plasma ratio and (D) single subject (S05) example showing time curves and model fit using one-tissue compartment (1TCM) and two-tissue compartment (2TCM) in gray matter.
Radioactivity in brain reached a maximum of about 1% of injected dose (range 0.5 to 1.3%ID) at 21 minutes (range 17 to 30 minutes) (Fig. 3B). At Tmax [brain], mean maximum radioactivity concentration expressed as SUV was 0.64 (range: 0.34 to 0.93) and was followed by a slow monophasic decrease (Table 1). For subject 6, who received a higher mass of [11C]AZD1390 (4.67 μg), the time-radioactivity curve showed flattened profile and reached lowest %IDmax[brain] compared with the other subjects in the study group. Over 2-fold inter-individual variability in brain distribution of [11C]AZD1390 was observed. The ratio of the brain to plasma concentration of [11C]AZD1390 leveled out at about 50–80 min after injection (Fig. 3C).
Description of brain exposure and kinetic modeling results after i.v. administration of [11C]AZD1390
| Subject no. | %IDmax[brain] (%) | Cmax[brain] (SUV) | Tmax[brain] (min) | VT_2TC (mL*cm-3) | KP,uu (mL*cm-3) |
|---|---|---|---|---|---|
| 1 | 0.83 | 0.67 | 19.6 | 4.3 | 0.19 |
| 2 | 1.33 | 0.93 | 17.4 | 4.7 | 0.21 |
| 3 | 1.13 | 0.57 | 20.6 | 9.2 | 0.42 |
| 4 | 1.31 | 0.66 | 17.0 | 7.1 | 0.32 |
| 5 | 0.74 | 0.51 | 19.9 | 5.2 | 0.23 |
| 6 | 0.54 | 0.34 | 30.3 | 3.3 | 0.15 |
| 7 | 1.04 | 0.70 | 24.3 | 5.7 | 0.26 |
| 8 | 1.05 | 0.71 | 16.9 | 2.3 | 0.11 |
| Mean (SD) | 1.00 (0.28) | 0.64 (0.17) | 20.7 (4.6) | 5.2 (2.2) | 0.24 (0.10) |
Notes: kinetic modeling based on two-tissue compartment model 2TCM
The HPLC analysis of unchanged [11C]AZD1390 and radioactive metabolites showed that the fraction of unchanged [11C]AZD1390 in plasma was >90% at 90 min (range 70–100%).
Calculation of Variables
The main outcome parameter was the total distribution volume VT obtained using the 2TC model, which converged to a solution in all cases (Fig. 3D, Table 1). The mean VT for the whole brain was 5.20 mL*cm−3 (range: 2.31–9.19 mL*cm−3). In the other brain regions, the mean VT was similar, from 3.12 mL*cm−3 in the pons, 5.38 mL*cm−3 in the caudate nucleus, 5.90–6.41 mL*cm−3 across the cortical regions, to 6.51 mL*cm−3 in the thalamus. For the choroid plexus region VT values could not be reliably estimated as time activity curves were not well conditioned to apply compartment analysis. In addition, the 1TC model was also employed and converged to a solution in all cases. However, the 2TC model provided a statistically better description of the data in gray matter ROIs and the whole brain in all subjects according to the AIC and F-statistics. The model-specific kinetic rate constants, their ratios, and the statistical model evaluations for the whole brain are presented in Table 2.
Description of whole brain exposure and kinetic modeling results after i.v. administration of [11C]AZD1390
| Subject | Model | K1 (mL/cc/min) | k2 (min−1) | k3 (min−1) | k4 (min−1) | K1/k2 | k3/k4 (BPND) | AIC | F-statistics (1TCM/2TCM; p value) |
|---|---|---|---|---|---|---|---|---|---|
| 1 | 1TCM | 0.06 | 0.01 | - | - | 3.9 | - | 193 | 1.44; 0 |
| 2TCM | 0.07 | 0.09 | 0.22 | 0.05 | 0.7 | 4.7 | 110 | ||
| 2 | 1TCM | 0.07 | 0.02 | - | - | 4.3 | - | 204 | 72; 3.8 × 10⁻¹³ |
| 2TCM | 0.08 | 0.06 | 0.17 | 0.06 | 1.3 | 2.7 | 144 | ||
| 3 | 1TCM | 0.11 | 0.01 | - | - | 8.3 | - | 184 | 142; 0 |
| 2TCM | 0.12 | 0.05 | 0.15 | 0.06 | 254 | 2.7 | 102 | ||
| 4 | 1TCM | 0.08 | 0.01 | - | - | 6.2 | - | 250 | 302;0 |
| 2TCM | 0.09 | 0.05 | 0.12 | 0.04 | 1.7 | 3.1 | 140 | ||
| 5 | 1TCM | 0.06 | 0.01 | - | - | 4.8 | - | 172 | 102; 2.6 × 10⁻¹⁵ |
| 2TCM | 0.06 | 0.07 | 0.30 | 0.06 | 0.9 | 5.0 | 101 | ||
| 6 | 1TCM | 0.03 | 0.01 | - | - | 2.8 | - | 162 | 105; 8.9 × 10⁻¹⁶ |
| 2TCM | 0.04 | 0.10 | 0.27 | 0.03 | 0.4 | 8.4 | 89 | ||
| 7 | 1TCM | 0.08 | 0.01 | - | - | 5.2 | - | 193 | 203; 0 |
| 2TCM | 0.09 | 0.10 | 0.26 | 0.05 | 0.9 | 5.5 | 91 | ||
| 8 | 1TCM | 0.03 | 0.01 | - | - | 2.1 | - | 188 | 106; 1.4 × 10⁻¹⁵ |
| 2TCM | 0.03 | 0.05 | 0.15 | 0.05 | 0.6 | 3.0 | 115 | ||
| Mean (SD) | 1TCM | 0.07(0.03) | 0.01(0.00) | - | - | 4.7(2.0) | - | 193(26) | - |
| 2TCM | 0.07(0.03) | 0.07(0.02) | 0.21(0.07) | 0.05(0.01) | 1.1(0.7) | 4.4(2) | 112(21) |
The mean unbound (free) brain-to-plasma partition coefficient Kp, uu was calculated to 0.24 mL*cm−3 (range: 0.11–0.42 mL*cm−3) (Table 1).
Discussion
PET-microdosing has long been applied to the development of drugs for neurological and psychiatric disorders. Indeed, a few PET studies have provided information on the brain exposure of epidermal growth factor tyrosine kinase inhibitors (EGFR TKIs) already used in clinical practice, such as osimertinib and lapatinib.12,29–31 To our knowledge, the present study is the first application of a PET microdose study to investigate brain distribution of an oncology drug as a first-time-in-human study, ie, even before standard phase I trials with doses at an expected therapeutic level.
The study demonstrated that [11C]AZD1390 rapidly passes the intact BBB in healthy subjects. About 1% of injected radioactivity of [11C]AZD1390 (IDmax[brain]) was in the brain at 21 minutes (Tmax[brain]). Compared with previously investigated CNS drugs, the total brain exposure of AZD1390 is, for example, higher than that of morphine or sulpiride, but lower than that of antipsychotics, antidepressants, caffeine, and nicotine.16 The findings reported here support AZD1390 as a candidate drug for the treatment of GBM or other malignancies in brain.
Over the past years, brain exposure measurements defined as the ratio between brain and plasma total concentrations have been critically reevaluated due to the lack of relationship with pharmacological activity.32 More recently, the approach to compare the free (unbound) concentration in brain to the free (unbound) concentration in plasma33 has been increasingly applied in early drug discovery and has had significant impact on brain exposure predictions and optimization of early doses in human trials. Ideally the ratio of unbound drug concentration in brain to plasma (Kp,uu) should be 1, assuming there is no transporter interaction at BBB and no active transport. The Kp,uu value for [11C]AZD1390 appeared to be lower than 1 and at the lower end of that reported for a series of reference CNS drugs.15 In vitro studies have suggested that AZD1390 is not a substrate for the human P-gp and/or BCRP efflux transporters (efflux ratio <2) but it has a higher efflux rate and lower permeability (Kp,uu 0.04–0.17) in rodent species,9 thus it is likely that some transporter activity in humans might take place. On the other hand, the reference value of fu,brain for AZD1390 used in the quantitative analysis was obtained from an assay of rat brain tissue slices (Formula 3). A recent study testing a series of drugs used in Alzheimer’s disease has found no support for the assumption of homogeneous cross-species brain tissue binding values, in particular in diseases condition.34 Thus, although indicative of brain exposure measurements, data on Kp, uu values for a new compound derived from a cross-species approach should be interpreted with caution. Nevertheless, the present PET study is to our knowledge the first attempt to use a first-in-man PET microdosing study as a method of estimating free brain concentration in vivo in humans.
Another application of PET-based analysis of brain distribution of novel drugs is to optimize dose selection and to inform dose escalation strategies during early clinical development. Here, we provide an example of predictions of free brain concentrations of AZD1390 in patients (Fig. 4). It is based on emerging pharmacokinetic plasma data in the current phase I study in patient population (see Supplement) and PET data obtained in the present study. Free drug concentrations in the brain cannot be measured directly using PET. The kinetic compartment model may not disentangle free and nonspecific binding (Fig. 1). However, knowledge of the free fraction of the drug in plasma and brain-to-plasma concentration ratio obtained by PET measurements enables direct calculations of predicted free AZD1390 concentrations in brain.
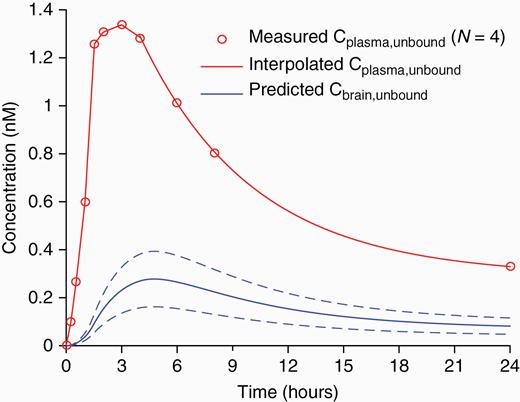
Prediction of unbound brain concentration of AZD1390 after a single (20 mg) oral dose. Prediction was based on measured time curves for the total plasma concentration in 4 dosed patients (obtained from ongoing phase I study) after obtaining the inter-individual mean curve and interpolating the curve tail by a 3-exponential decay function. Prediction of total brain concentration profiles was performed by means of the 2-tissue compartment model using rate constant parameter sets obtained in the 8 current subjects. (data not shown). Unbound concentrations in plasma and brain were then obtained using the fu,plasma and fu,brain reference values, respectively (see Methods). The mean ± SD of the predicted unbound brain concentration is plotted.
At visual inspection of TACs the kinetic profile appears similar to radioligands having specific binding in the brain; for example, [11C]raclopride.21 Moreover, on the basis of regional differences in brain distribution and the regional binding parameters obtained by compartment model, it cannot be excluded that the PET images to some degree represent specific [11C]AZD1390 binding in brain. This interpretation is discussed further in Supplement in relation to the rate constants obtained in the compartment analysis.
The concentration of [11C]AZD1390 in the choroid plexus was unexpectedly about 10-fold higher than in the other brain regions. The kinetics in choroid plexus were best described by a 1TC model (data not shown). Interestingly, similar observations of high radioligand concentration in choroid plexus have been reported for [11C]N-desmethyl-loperamide35 and in the development of markers for the serotonin 5HT2 receptor. The reasons for such accumulations in the choroid plexus are not fully understood though it has been suggested that rapid passage across the blood–CSF barrier may play a role.36 On the other hand, specific binding to the different receptors (eg, serotonin 5HT2C, oxytocin) in the choroid plexus in humans and non-human primates has been reported.37,38 Thus, higher radioactivity of [11C]AZD1390 in the choroid plexus may also result from binding to specific receptors, though potential target remains unknown. Primary pharmacology screening against multiple receptors and enzymes has not identified potential off-target binding (unpublished data, AZ), the closest affinity reported being to the H3 receptors which have not been previously described to be present in the human choroid plexus.39,40 Whether higher levels of AZD1390 in the choroid plexus have clinical relevance for the treatment of selected groups of patients (eg, patients with choroid plexus tumors)41 remains to be explored.
This study reports a non-invasive investigation of the brain distribution of a microdose of AZD1390 in healthy subjects. This is valuable information in early clinical drug development supporting further testing of the compound in patients with CNS malignancies as it suggests that the drug crosses intact BBB and likely will pass BBB also in patients with CNS tumors.12,31 Although drug concentrations have been detected in tumors even when it does not cross BBB,42 still the BBB permeability in patients with various CNS tumors may be different.43,44 Thus, drug efficacy may be significantly improved with compounds which readily cross the BBB. However, it cannot be excluded that formation of an additional heterogeneous and partially intact blood‒tumor barrier retaining or even increasing expression of efflux pumps may preclude drug distribution to all tumor areas.45–47 Thus, a direct confirmation of drug distribution to brain tumors by a PET-microdosing study in patients would be warranted.
A potential limitation of the present study is that brain exposure was examined after administration of a microdose (0.46–4.67 µg) of AZD1390. This dose is orders of magnitude lower than the starting dose of 10 mg applied in the phase I clinical study (NCT03423628). An underlying assumption of the use of microdoses is that pharmacokinetic parameters calculated after administration of microdose can be extrapolated to pharmacological doses in a linear fashion. Such linear relationships have indeed been confirmed by a number of PET studies after administration of a microdose in combination with a non-labeled pharmacological dose, for example using [11C]verapamil, or the antidepressant [11C]BMS181101.48,49 In addition, no significant difference in brain exposure between radiolabeled microdose and pharmacological dose have more recently been demonstrated for a series of reference CNS drugs studied in non-human primates using PET.15
In conclusion, this study shows that the radiolabeled ATM inhibitor [11C]AZD1390 crosses the intact BBB readily and approximately 1% of radioactivity injected i.v. bolus is in the human brain after 21 min. Those findings have been used to inform the ongoing phase I dose escalation study with AZD1390 in combination with RT in patients with CNS malignancies and support future development of this drug in GBM and other brain tumors.
Acknowledgments
We thank the volunteers and the Karolinska Institute staff who participated in this study.
The study results were presented at the annual EANM congress, October 13–17, 2019, Dusseldorf, Germany.
Funding
This study was funded by AstraZeneca.
Conflict of interest statement. A.J., Al.S., P.J., Z.C., M.S., C.D., A.S., V.P.R, N.B-B., M.P. are employees of AstraZeneca and own stock or stock options. S.D.V., M.H., M.S.M., L.F. were employees of AstraZeneca during the current study, have no conflict of interest. A.V-R., M.M.M. were employees at KI, PET Center during the current study. They have no disclosures to report. All other authors have no disclosures to report.
Authorship statement. Study conception and design: A.J., Z.C., S.D.V, Al.S., M.S., An.S., M.H., M.P., L.F. Material preparation, data collection, and analysis: P.S., A.V, Al.S, A.J., P.J., M.S., A.V.R., M.M.M, C.H., Z.C., K.V., D.C., N.B.B. V.P.R., M.H., L.F. Statistical analysis: Z.C., C.D. Writing and revision of manuscript: All authors. Have read and approved the final version: All authors.


