


Abstract
Embryonal tumors in the central nervous system (CNS) are primary, aggressive, and poorly differentiated pediatric brain tumors. We identified forkhead box R2 (Foxr2) as an oncogene for medulloblastoma through a transposon-based insertional mutagenesis screen. Foxr2 translocation has been identified in a subset of human embryonal tumors of the CNS, designated as CNS neuroblastoma with Foxr2 activation (CNS NB-Foxr2); however, the in vivo functions of Foxr2 remain elusive.
We analyzed the effect of Foxr2 overexpression in the mouse brain by generating a transgenic strain that expresses Foxr2 in the entire brain under a transformation related protein 53 (Trp53)–deficient background. We performed histological analysis of tumors and characterized tumor-derived sphere-forming cells. We investigated gene expression profiles of tumor-derived cells.
Foxr2 and Trp53 loss promoted tumor formation in the olfactory bulb (OB) and brainstem (BS). The tumors showed the common morphological features of small round blue cell tumors, exhibiting divergent, mainly neuronal and glial, patterns of differentiation, which corresponds to the definition of CNS-embryonal tumors. Importantly, all mice developed CNS-embryonal tumors. In the OB, early proliferative lesions consisting of oligodendrocyte transcription factor 2 (Olig2+) cells were observed, indicating that Foxr2 expression expanded Olig2+ cells in the OB. Tumor-derived cells formed spheres in vitro and induced tumors that recapitulated the parental tumor upon transplantation, indicating the presence of tumor-initiating cells. Gene expression profiling revealed that OB and BS tumor cells were enriched for the expression of the genes specific to CNS NB-Foxr2.
Our data demonstrate that Foxr2 plays a causative role in the formation of CNS-embryonal tumors.
1. Foxr2 overexpression with Trp53 loss resulted in the development of CNS-embryonal tumors.
2. The mouse model showed a strong and fully penetrant phenotype compared with existing models.
Forkhead box transcriptional factor, Foxr2, has been identified as a potential oncogene in medulloblastoma in Sleeping Beauty transposon-based genetic screens. More recently, Foxr2 translocation has been identified in a subset of human embryonal tumors, designated as CNS neuroblastoma with Foxr2 activation (CNS NB-Foxr2). However, functional validations of Foxr2 in vivo have been lacking thus far. In the present study, we investigated whether Foxr2 could induce tumors in vivo when expressed as a transgene in mice deficient for Trp53. Foxr2 induced proliferation of granule neuron precursors in the cerebellum, but medulloblastoma formation was rarely observed. Instead, the mice developed CNS-embryonal tumors in the olfactory bulb and the brainstem. The mice showed a strong and fully penetrant phenotype compared with existing models of CNS-embryonal tumors, indicating that Foxr2 plays a key role in the formation of CNS-embryonal tumors. The mice will be useful for investigating pathogenesis of Foxr2-driven CNS-embryonal tumors.
Primary brain tumors are the most common solid tumor in children, accounting for up to 25% of all pediatric neoplasms.1 Embryonal tumors in the central nervous system (CNS) constitute 13–15% of pediatric brain tumors2 and comprise undifferentiated or poorly differentiated cells of neuroectodermal origin. All embryonal tumors in the CNS correspond histologically to World Health Organization (WHO) grade IV. The most common embryonal tumor in the CNS is medulloblastoma (MB).3 MB occurs in the cerebellum and is divided into subgroups based on a molecular classification.4 Embryonal tumors include tumors that occur at any extracerebellar sites in the CNS, such as embryonal tumors with multilayered rosettes and the atypical teratoid/rhabdoid tumor. A poorly differentiated embryonal tumor of neuroectodermal origin that lacks the specific histopathological features or molecular alterations defining other CNS tumors are diagnosed as CNS-embryonal tumors not otherwise specified (NOS).
The current definition of a CNS-embryonal tumor NOS is more circumscribed than that in the previous WHO classification, in which the umbrella designation “CNS primitive neuroectodermal tumor” (CNS-PNET) was used.5–7 Molecular genetic advances continue to improve the classification of CNS-embryonal tumor NOS. The extensive molecular profiling of a large cohort of CNS-PNET done by Sturm and colleagues identified 4 novel CNS tumor entities, each associated with a recurrent genetic alteration.8 A molecular entity designated CNS neuroblastoma with activation of forkhead box R2 (CNS NB-Foxr2) is characterized by fusion transcripts retaining the full coding sequence of Foxr2 with upstream noncoding exons of fusion partners.8 These events suggest that activation of Foxr2 is facilitated by promoters of active genes, thus instigating oncogenic activity in CNS NB-Foxr2. Accordingly, Foxr2 may serve as a driver gene for CNS NB-Foxr2; however, this has not been tested due to the lack of animal models.
We previously identified Foxr2 as the most frequently mutated gene in MB by Sleeping Beauty (SB) transposon-based insertional mutagenesis.9 Foxr2 belongs to the forkhead box protein superfamily10 and is strongly expressed in a small subset of the sonic hedgehog (SHH) subgroup of MB. Li and colleagues reported that Foxr2 is associated with the transcription factor MYC/MYC-associated factor X (MAX) complex and promotes proliferation of cancer cells.11 Foxr2 has oncogenic activity in various cancer cell types, including malignant peripheral nerve sheath tumors, as well as breast, liver, and prostate cancers.11–14 However, the oncogenic activity of Foxr2 has not been addressed in vivo using transgenic animals.
Here, we show that overexpressing Foxr2 promoted formation of CNS-embryonal tumors in a transformation related protein 53 (Trp53)–deficient background. Importantly, Foxr2 overexpression with a Trp53 deficiency resulted in the development of CNS-embryonal tumors with 100% penetrance. Our results indicate that Foxr2 plays a causative role in the formation of CNS-embryonal tumors.
Materials and Methods
Mouse Strains and Animal Experiments
Mice with transgenic expression of Foxr2 (Foxr2KI) were generated using the strategy previously described.15Foxr2KI strain was crossed with mice expressing Cre recombinase under the Nestin promoter (Nes-cre) (RBRC02412, RIKEN BRC)16 and Trp53 floxed mice (B6.129P2-Trp53tm1Brn/J, Jackson Laboratory) (Supplementary Table 1).17 The genetic background of these animals was mixed (129SvJ/C57BL/6J). For intracranial transplantation, C57BL/6J pups (Japan SLC) at postnatal day 7 (P7) were anesthetized by hypothermia. Injected into both sides of the striatum were 1 × 10⁵ cells. Animals were monitored twice a week for signs of any neurological symptoms, head enlargement, or weight loss. Mice with the symptoms were euthanized for necropsy. EdU (5-ethynyl-2′-deoxyuridine; 50 mg/kg) was intraperitoneally administered for 3 consecutive days. On day 3, EdU was administered 2 hours before sacrifice. All manipulations were performed with institutional approval (Institute of Medical Science, University of Tokyo).
Histology and Tumor Analysis
Perfusion fixation was performed prior to dissection, and the brain was fixed in 4% paraformaldehyde. Brains were embedded in paraffin and examined using 4-µm-thick coronal sections at the following four levels: (1) the prefrontal cortex near the olfactory bulb, (2) the frontal part of the lateral ventricle, (3) the cortex and the hippocampus, and (4) the brainstem and cerebellum. The sections from the paraffin blocks were prepared according to standard procedure. The sections were stained with hematoxylin and eosin (H&E). Tumor diagnosis was determined based on the WHO criteria.
Immunohistochemical Analyses
Paraffin-embedded 4-μm-thick sections were routinely stained with H&E. Immunostaining was performed using a Bond-Max automated immunostainer (Leica). The slides underwent heat-induced epitope retrieval with Epitope Retrieval Solution 1 or 2, or proteolytic-induced antigen retrieval solution. The following standard protocols were performed using a Bond polymer Refine Detection system (Leica). The slides were incubated with primary antibodies shown in Supplementary Table 2. Horseradish peroxidase–conjugated secondary antibodies were used. Frozen sections were prepared as described previously.18 Primary antibodies used in the study are shown in Supplementary Table 2. Alexa 488-, 594-, or 680-conjugated secondary antibodies were used. EdU staining was performed using Click-iT Assay Kits (Invitrogen) according to the manufacturer’s protocol. Stained cells were observed with an inverted fluorescence light microscope (Zeiss), and images were acquired with AxioImager software. Expression of the markers was considered positive if the marker was expressed in at least 5% of tumor cells (or tumor regions) in the field of view (x400).
Quantitation of Mitotic Cells in the External Granule Layer of Cerebellum
Cells positive for phospho-histone H3 (PH3) were counted along the whole external granule layer (EGL) of the sagittal section of the cerebella vermis. The perimeter of each EGL was measured by using AxioImager software (Zeiss).
Culture Experiments
For primary culture of tumor cells, dissociated cells were cultured in serum-free medium.19 To induce differentiation, growth factors were removed from the medium, and fetal bovine serum was added. Quantitative (q)PCR and immunostaining analyses were performed on days 4 and 6, respectively. Mouse embryonic fibroblasts (MEFs) were isolated from embryos at E14.5 and infected with retrovirus expressing Cre recombinase (pMXs-Cre-IP). Puromycin-resistant cells were used for morphological analyses and western blot. Cells were stained with different markers and 100 cells were counted to determine the percentage of marker-positive cells.
Western Blot Analysis
Primary antibodies against Foxr2 (Santa Cruz), actin (Sigma), and horseradish peroxidase–linked secondary antibodies (GE Healthcare) were used.
Real-Time PCR Analysis
For gene expression analysis of SHH pathway in the cerebellum, around 1 mm of the hemisphere at both side of the cerebellum were homogenized by sonication. For gene expression comparison between tumor cells, differentiated cells, and cultured astroglia,19 1 × 10⁵ cells were seeded onto each well of a 12-well plate, harvested on day 4. For all analyses, 1 μg of RNA was used for reverse transcription. Synthesis of cDNA and qPCR were performed as described previously.19 Primers used in the study are shown in Supplementary Table 3.
RNA Sequencing Analysis
Details are described in the Supplementary Methods. Gene Expression Omnibus accession number is GSE121366.
Results
Foxr2 Overexpression Results in Prolonged Proliferation of Granule Neuron Precursors in the Cerebellum
We generated a knock-in (KI) strain, in which the CAG-LSL-Foxr2 cassette was targeted to the Rosa26 locus (Foxr2) (Fig. 1A, Supplementary Figure 1A, B). Expression of Foxr2 and green fluorescent protein (GFP) was confirmed in MEFs isolated from Foxr2 embryos after retroviral Cre transduction (Supplementary Figure 1C, D). Foxr2-expressing MEFs retained their small size compared with control MEFs, as described previously9 (Supplementary Figure 1D). We next investigated the effect of Foxr2 overexpression in the cerebellum. We used Trp53 conditional knockout mice (Trp53fl) because we previously identified Foxr2 as an oncogene for MB in the Trp53 mutant background.9Nes-cre transgenic animals were crossed with Foxr2KI and Trp53fl mice to induce recombination in neural stem and progenitor cells in the developing brain. GFP fluorescence was observed in the entire brain of Nes-cre;Foxr2;Trp53fl/fl mice on embryonic day 13 (E13) (Fig. 1B). Notably, GFP expression was relatively weak in the developing cortex. Genotyping of newborn mice at postnatal day 5 (P5) revealed that the observed frequencies of Nes-cre;Foxr2KI;Trp53fl/fl mice were lower than the expected Mendelian frequency (Fig. 1C), suggesting partial embryonic or perinatal lethality; however, Nes-cre;Foxr2KI;Trp53fl/fl mice that were alive at P5 survived into adulthood.
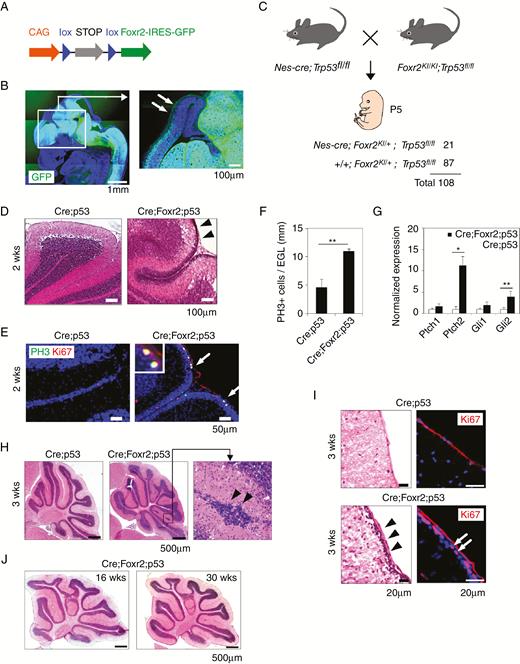
Foxr2 overexpression promoted GNP proliferation in the cerebellum. (A) Schematic of the construct. (B) GFP expression in the developing brain of Nes-cre;Foxr2KI mice at E13. Arrows, developing cortex. Bars, 1 mm and 100 µm. (C) Mating strategy and genotypic analysis of pups at P5. (D) H&E staining of the cerebellum in Nes-cre;Trp53fl/fl (Cre;p53) and Nes-cre;Foxr2KI;Trp53fl/fl (Cre;Foxr2;p53) mice at 2 weeks (2w). Arrowheads, EGL. Bars, 100 µm. (E) Expression of PH3 and Ki67 in the cerebellum of Cre;p53 and Cre;Foxr2;p53 mice at 2w. Bars, 50 µm. (F) Average number of PH3+ cells in the cerebellum of Cre;p53 and Cre;Foxr2;p53 mice (2w). Data represent mean ± SEM (n = 4 per group). (G) Expression levels of SHH target genes in the cerebellum of Cre;p53 and Cre;Foxr2;p53 mice (2w). Expression levels were normalized by SDHA. Data represent mean ± SEM (n = 3 per group). Student’s t-test (2-tail), *P < 0.05, **P < 0.01. (H) H&E staining of the cerebellum in Cre;p53 and Cre;Foxr2;p53 mice (3w). Arrowheads point to abnormal cluster of granule neurons. Bars, 500 µm. (I) Presence of the EGL in Cre;Foxr2;p53 mice at 3w (arrowheads). Arrows, Ki67+ proliferating. Bars, 20 µm. (J) H&E staining of the cerebellum of Cre;Foxr2;p53 mice at 16w and 30w. Bars, 500 µm.
Granule neuron precursors (GNPs) in the outer part of the EGL begin to differentiate and migrate to the inner part of the cerebellum around the time of birth during normal development of the cerebellum.20 Most mitotically active GNPs disappeared from the EGL of Nes-cre;Trp53fl/fl mice 2–3 weeks after birth (Fig. 1D, E). In contrast, the EGL was thicker in the cerebellum of Nes-cre;Foxr2KI;Trp53fl/fl mice than in Nes-cre;Trp53fl/fl mice, and the number of PH3+ proliferative GNPs increased significantly in the EGL of Nes-cre;Foxr2KI;Trp53fl/fl mice (Fig. 1D, F). Expression levels of the SHH pathway downstream target genes, Ptch2 and Gli2, were significantly upregulated in the cerebellum of Nes-cre;Foxr2KI;Trp53fl/fl mice (Fig. 1G).9 Immunostaining revealed that Ptch2 expression was upregulated in NeuN+ neurons in the molecular layer of the cerebellum of Nes-cre; Foxr2KI;Trp53fl/fl mice (Supplementary Figure 1E, F). Almost all GNPs differentiate into mature granule neurons at around postnatal week 3, and the EGL is diminished as a result of migration of these neurons to the internal granular layer in Nes-cre;Trp53fl/fl mice (Fig. 1H).20 However, aberrant clusters of granule neurons were observed at the surface of the cerebellum of Nes-cre;Foxr2KI;Trp53fl/fl mice (Fig. 1H, arrowheads). Ki67+ proliferating cells were occasionally observed in the EGL of Nes-cre;Foxr2KI;Trp53fl/fl mice (Fig. 1I). Taken together, these data indicate a role for Foxr2 in promoting the proliferation of GNPs and deregulating their subsequent migration into the internal granular layer.
Foxr2 Overexpression Induces Formation of CNS-Embryonal Tumors
Although Foxr2 maintained the proliferative status of GNPs at 3 weeks old, proliferative GNPs were no longer observed in the cerebellum from 4 weeks onward (Fig. 1J). Cells consisting of the abnormal clusters in the EGL and molecular layer of Nes-cre;Foxr2KI;Trp53fl/fl mice were Ki67−, NeuN+, and p27+, indicating that the cells underwent cell-cycle exit and neuronal differentiation (Supplementary Figure 1G). Thus, Foxr2 overexpression and Trp53 deficiency are insufficient to induce continuous proliferation of GNPs. Monitoring of Nes-cre;Foxr2KI;Trp53fl/fl mice revealed that Nes-cre;Foxr2KI;Trp53fl/fl mice started to show common clinical conditions associated with brain tumors, such as gait abnormality, unwillingness to move, hunched posture, and weight loss at 2–4 months of age, whereas Nes-cre;Trp53fl/fl and Nes-cre;Foxr2KI mice exhibited no obvious phenotypes until 6 months (Fig. 2A). Gross observation of the brain of Nes-cre;Trp53fl/fl and Nes-cre;Foxr2KI mice detected no tumor masses, and sectioning of the brain of these mice revealed no tumor lesions (Supplementary Figure 1I, J, Supplementary Table 1). In contrast, examinations of the brain of Nes-cre;Foxr2KI;Trp53fl/fl mice revealed strong GFP signals near the olfactory bulb (OB) and the brainstem (BS) (Fig. 2B). Histological analyses revealed the presence of tumors in the GFP+ regions, including the OB and BS (Fig. 2C). Expression of Foxr2 and GFP were observed in tumors (Supplementary Figure 1K).
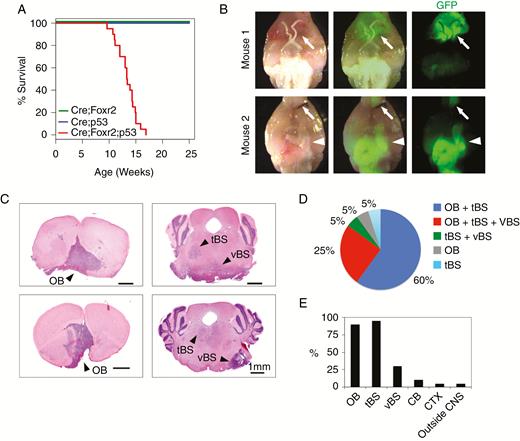
Nes-cre;Foxr2KI;Trp53fl/fl mice developed brain tumors. (A) Kaplan–Meier plot shows survival of Nes-cre;Foxr2KI mice (Cre;Foxr2) (n = 10), Nes-cre;Trp53fl/fl mice (Cre;p53) (n = 20), and Nes-cre;Foxr2KI;Trp53fl/fl mice (Cre;Foxr2;p53) (n = 20). Log-rank test, P < 0.001 (Cre;Foxr2 vs Cre;Foxr2;p53), P < 0.01 (Cre;p53 vs Cre;Foxr2;p53). (B) Whole-brain dissections of Cre;Foxr2;p53 mice showed tumors near the OB (arrows) and the BS (arrowheads). (C) H&E staining of coronal sections from the brain of Cre;Foxr2;p53 mice. Arrowheads, tumors. Bars, 1 mm. (D) Localization of tumors in 3 regions (OB, tBS, and vBS) in individual mice (n = 20). (E) Percentage of the mice that harbored tumors in different locations of the brain (n = 20).
Tumors in the BS were further divided into 2 groups based on localization: (1) the tegmental component (tBS; Fig. 2C) and (2) the ventral component (vBS; Fig. 2C), which often presented as a protruding mass. Most mice (~85%) developed tumors in both the OB and tBS (Fig. 2D), vBS tumors were observed in ~30% of Nes-cre;Foxr2KI;Trp53fl/fl mice (Fig. 2D). Two mice developed tumors in the cerebellum, and one mouse developed a tumor in the cortex (Fig. 2E, Supplementary Figure 2A, B). Importantly, all Nes-cre;Foxr2KI;Trp53fl/fl mice developed at least one tumor in the CNS outside the cerebellum. No tumor masses were observed outside the brain except in one mouse that developed a tumor in the hind leg. The leg tumor showed fibrosarcoma morphology with tumor cells expressing GFP, indicating that Cre-mediated recombination took place (Supplementary Figure 2C).
The tumors in the OB and BS were uniformly filled with small and round blue cells with oval to calotte-shaped nuclei, scant cytoplasm, as well as high nucleus-to-cytoplasm ratio (Fig. 3A), representing typical histological features of the small round blue cell tumors. None of the tumors showed astrocytic histology, which is characterized by a modest number of visible eosinophilic cytoplasmic processes with elongated, irregular hyperchromatic nuclei in dense fibrillary matrix. Ventral BS tumors often developed near the trigeminal nerve and involved the nerve roots (Supplementary Figure 2D). The tumors in the tBS showed a diffusely infiltrating pattern with nodular islands (Supplementary Figure 2E). Tumor cells in the tBS were distributed in a larger area than those in the OB and vBS (Fig. 3B, Supplementary Figure 2F). The proliferative marker Ki67 was expressed in the tumor cells (Fig. 3C). Mitotic figures were abundant, and the number of Ki67+ cells was higher in the vBS than in the OB and tBS (Fig. 3D). Tumors in the cerebellum were also composed of densely packed, small, round blue cells, showing histological features consistent with embryonal tumor (Supplementary Figure 2A), thus these tumors were considered as MBs by definition.
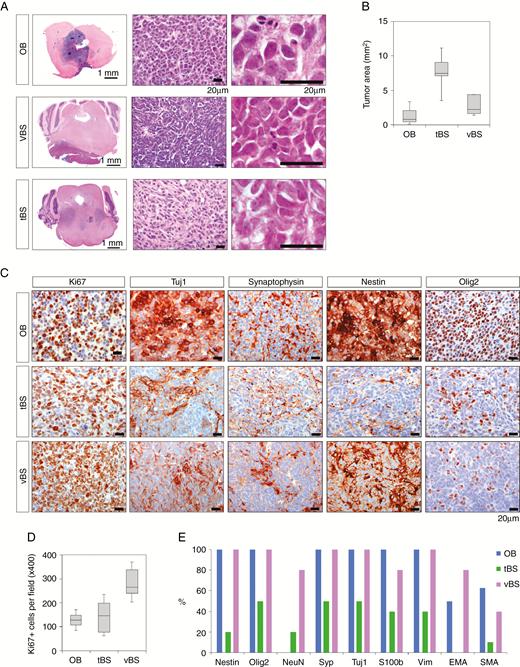
Brain tumors showed histological features of CNS-embryonal tumor. (A) H&E staining of tumors in the OB and BS. Bars, 1 mm and 20 µm. (B) Box and whisker plot of tumor area in the OB (n = 8), tBS (n = 10) and vBS (n = 5). (C) Representative images of tumor sections stained with antibodies against Ki67, Tuj1, synaptophysin, Nestin, and Olig2. Bars, 20 µm. (D) Number of Ki67+ cells per field (x400) in the OB (n = 8), tBS (n = 10), and vBS (n = 5). (E) Percentage of tumors in the OB (n = 8), tBS (n = 10), and vBS (n = 5) that showed immunoreactivity against different markers.
Heterogeneity of cellular differentiation was evident in the expression of cell-lineage markers. OB and vBS tumors consisted of cells expressing neuronal markers (Tuj1, synaptophysin, and NeuN), the neural stem cell (NSC) marker Nestin, and glial markers (Olig2 and S100b) (Fig. 3C, E, Supplementary Figure 3A). Glial fibrillary acidic protein (GFAP) expression was observed in reactive astrocytes (Supplementary Figure 3A). A subset of OB and vBS tumors expressed vimentin, smooth muscle actin, and epithelial membrane antigen (Supplementary Figure 3A). Expression of the above-mentioned markers was focally observed in tBS tumors (Fig. 3C, E, Supplementary Figure 3A), suggesting the heterogeneous characteristics of tBS tumors. Double staining experiments with EdU confirmed the expression of Nestin, S100b, Tuj1, and synaptophysin in EdU+ proliferating cells of OB and vBS tumors (Supplementary Figure 3B). The divergent differentiation along neuronal, astrocytic and mesenchymal lineages corresponds to the definition of CNS-embryonal tumors, while ruling out the possibility of astrocytomas by definition. We confirmed the absence of mutations in IDH1R132, IDH2R172, H3.1K27, H3.1G34, H3.3K27, and H3.3G34, which are commonly detected in infiltrative forms of astrocytomas, including diffuse intrinsic pontine gliomas (Supplementary Figure 3C).
Olig2+ Cells Constituted the Early Proliferative Lesion in the OB
NSCs in the subventricular zone (SVZ) continuously generate neurons in the OB. The presence of OB tumors in Nes-cre;Foxr2KI;Trp53fl/fl mice raises the possibility that these tumors may result from SVZ NSCs or their progeny. We noticed that SVZ architecture was always preserved in mice with OB tumors (Fig. 4A). Interestingly, the SVZ was expanded in one mouse; however, the RMS was not apparently continuous with the OB tumor (Supplementary Figure 4A). To evaluate the continuity between the SVZ/rostral migratory stream (RMS) and OB tumors, we labeled proliferating cells with EdU and analyzed their location. If OB tumors are derived from SVZ NSCs or neuroblasts in the RMS, both RMS and OB tumors would be continuously labeled with EdU (Fig. 4B). In control animals (Nes-cre;Trp53fl/fl), only a few EdU+ cells were observed in the outer part of the OB, whereas clusters of EdU+ cells were observed in the OB of Nes-cre;Foxr2KI;Trp53fl/fl mice at 4 weeks (Fig. 4C, D). The spatial continuity between these EdU+ cells and the RMS was not apparent at 4 and 8 weeks (Fig. 4E, Supplementary Figure 4B). Importantly, EdU+ cells located at the outer part of the OB were Olig2+ and Dcx−, whereas EdU+ cells located inside of the OB were Dcx+ and Olig2− (Supplementary Figure 4C, D), indicating that proliferative cells located in the outer part of the OB were different from those in the RMS. Nearly 80% of EdU+ cells in the OB were Olig2+, whereas Nestin expression was observed in ~20% of EdU+ cells (Supplementary Figure 4E, F). These data indicate that Foxr2 expression resulted in the expansion of Olig2+ cells in the OB.
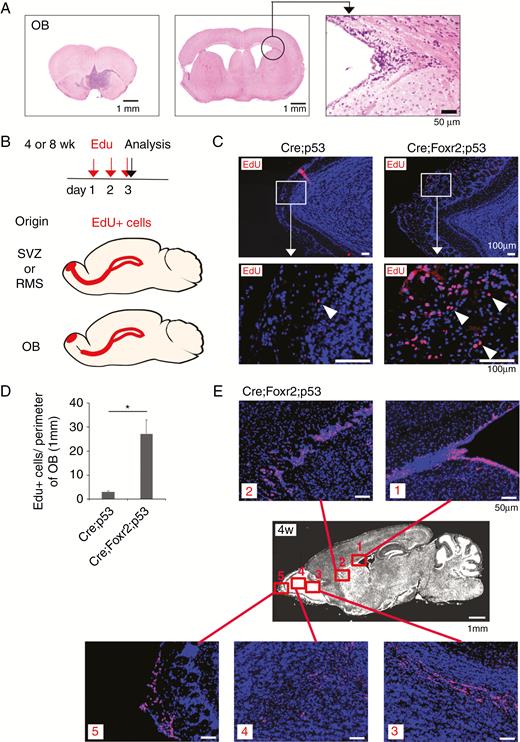
Expansion of Olig2+ cells in the OB. (A) SVZ architecture was preserved in the mouse with OB tumor. Bars, 1 mm and 50 µm. (B) Experimental design is shown. Depending on the cell-of-origin for OB tumors, EdU+ cells are expected to show different distribution patterns. (C) EdU+ cells in the outer part of the OB in Cre;p53 and Cre;Foxr2;p53 mice at 4w. Regions in white boxes are shown in the magnified view. Arrowheads, EdU+ cells. Bars, 100 µm. (D) Total number of EdU+ cells in the outer part of the OB was divided by the perimeter of the OB. Student’s t-test (2-tailed, n = 4 per group). *P < 0.05. (E) EdU-incorporated cells were visualized in the SVZ, RMS, and OB of the brain of Cre;Foxr2;p53 mice at 4w. Bars, 1 mm and 50 µm.
In Vitro Sphere-Forming Cells Serve as Tumor-Initiating Cells for CNS-Embryonal Tumors
To characterize tumor cells, we isolated GFP+ tumor cells from the OB and dissociated and cultured them in serum-free media supplemented with growth factors, which resulted in the formation of GFP+ spheres that expressed Foxr2 (Fig. 5A, Supplementary Figure 5A). The spheres consisted of proliferating cells that expressed Nestin and Olig2 (Fig. 5B, Supplementary Figure 5B). Removing the growth factors and adding serum to the media induced morphological changes in the spheres to flat and adherent cells with increased expression of the glial markers GFAP and S100b, as well as that of the neuronal marker Tuj1 (Fig. 5A, B, Supplementary Figure 5B), indicating that sphere-forming cells retain both glial and neuronal differentiation potential. We next transplanted sphere-forming cells into the brains of C57BL/6 mice. The mice showed head enlargement at approximately 6–8 weeks posttransplantation (Fig. 5C). Analysis of the brain revealed the presence of tumors that consisted of small and round blue cells (Fig. 5D), and tumor cells were positive for PH3, Nestin, and Olig2 (Supplementary Figure 5C).
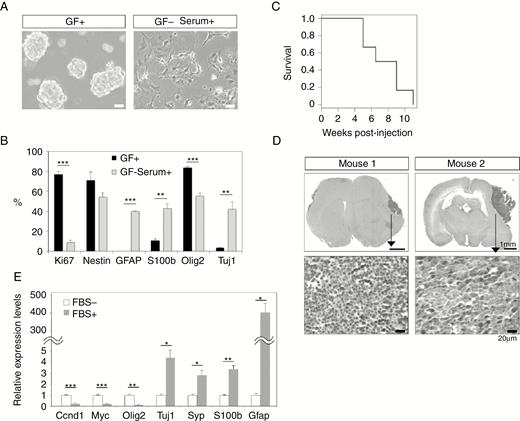
Isolation of tumor-initiating cells from CNS-embryonal tumor. (A) Tumor-derived spheres (left). Removal of growth factors (GFs) and the addition of serum induced morphological changes on day 7 (right). Bars, 50 µm. (B) Percentage of the cells that expressed markers was calculated by immunohistochemistry. Data represent means ± SEM (n = 3). (C) Kaplan–Meier plot shows survival of mice transplanted with tumor cells (n = 6 per group). (D) Tumor formation in the brain after intracranial transplantation of sphere-forming cells. Tumors in 2 animals are shown. Bars, 1 mm and 20 µm. (E) Gene expression analysis was performed using tumor-initiating cells cultured in the absence of serum or after the addition of serum. Data represent means ± SEM (n = 3). Expression levels were normalized relative to SDHA. *P < 0.05, **P < 0.01, ***P < 0.001, Student’s t-test (2-tail).
Gene Expression Analysis of Tumor-Initiating Cells for CNS-Embryonal Tumors
To identify genes specifically expressed in tumor-initiating cells, we compared gene expression patterns between tumor-initiating cells and differentiated cells. Cell cycle–related genes (CCND1 and c-Myc) were strongly expressed in tumor-initiating cells (Fig. 5E). Histological analysis confirmed c-Myc expression in tumor cells of Nes-cre;Foxr2KI;Trp53fl/fl mice (Supplementary Figure 6A). Olig2 was strongly expressed in tumor-initiating cells, whereas markers for neuron (Tuj1, Syp) and astrocyte (GFAP, S100b) were upregulated in differentiated cells (Fig. 5E). We next performed RNA-seq for comprehensive analysis of gene expression profiles in tumor cells (Supplementary Table 4). Tumor cells derived from the OB and BS formed distinct clusters compared with astroglia (Fig. 6A, B). Genes upregulated in OB and BS tumor cells were enriched for Gene Ontology terms related to nervous system development and oligodendrocyte differentiation (Fig. 6C, D, Supplementary Figure 6B, C, Supplementary Tables 5, 6). We then investigated whether OB and BS tumor cells show similar expression patterns to CNS NB-Foxr2. The top 500 genes specific to CNS NB-Foxr2 relative to high-grade gliomas (Supplementary Table 8) were significantly enriched in OB and BS tumor cells compared with astroglia (Fig. 6E, F).
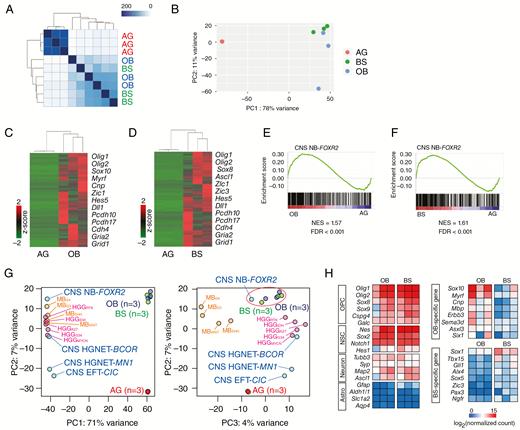
Gene expression analysis of tumor-initiating cells for CNS-embryonal tumors. (A) Heatmap of sample distance matrix showing similarities between samples. High similarities are shown in dark blue. (B) The PCA plot shows the variation among OB tumor cells (n = 3), BS tumor cells (n = 3), and astroglia (AG) (n = 3). (C, D) Heatmap with hierarchical clustering distances shows the variation in the expression levels (z-score) of the genes that were upregulated in OB (C) and BS (D) tumor cells compared with astroglia (adj. P-value < 0.01, log2(FC) > 2). Upregulated were 1258 and 1176 genes in OB and BS tumor cells, respectively (Supplementary Tables 5 and 6). Representative genes are shown. (E, F) Gene set enrichment analysis was performed for gene expression in OB and BS tumor cells compared with AG using the top 500 genes upregulated in CNS NB-Foxr2 compared with high-grade gliomas (HGGs) (Supplementary Table 8).8 (G) The PCA plot shows the variation among OB tumor cells, BS tumor cells, AG, the 4 subtypes of CNS-embryonal tumors, MBs, and HGGs.8 (H) Heatmap of expression levels of representative genes in OB and BS tumor cells.
To further compare Foxr2-induced tumors more broadly with other subgroups of CNS-embryonal tumors, we performed principal component analysis (PCA) (Fig. 6G). The PC1 component represents the difference between human and mouse samples. The PC2 and PC3 components represent the differences among tumor subtypes. Notably, OB and BS tumors showed the most similarity to CNS NB-Foxr2 compared with other subtypes of CNS-embryonal tumors (CNS HGNET-BCOR, CNS EFT-CIC, and CNS HGNET-MN1), demonstrating that Foxr2-induced tumors most closely match CNS NB-Foxr2. We next compared gene expression profiles between OB and BS tumor cells (Supplementary Figure 6D, Supplementary Table 7). Both OB and BS tumors expressed oligodendrocyte precursor cell (OPC)–associated genes, including Olig2 (Fig. 6H). OB tumor cells expressed oligodendrocyte-associated genes, such as Sox10, Myrf, Cnp, and Mbp (Fig. 6H, Supplementary Figure 6E), which may explain the stronger OPC-like phenotype in OB tumors than BS tumors (Fig. 3C). BS tumor cells were enriched for transcriptional factors (Fig. 6H, Supplementary Figure 6E). The difference may reflect distinct cell-of-origin for tumors. In summary, OB and BS tumor cells have similar expression patterns relative to astroglia even though they developed in spatially distinct regions, and OB and BS tumor cells were enriched for the expression of the genes specific to CNS NB-Foxr2.
Discussion
In this study, we focused on Foxr2, a candidate oncogene identified by SB screening in MBs, and characterized its in vivo function using a newly generated transgenic strain. Overexpressing Foxr2 promoted proliferation of GNPs in the cerebellum, which is consistent with our in vitro data.9 A small subset of Nes-cre;Foxr2KI;Trp53fl/fl mice developed MBs; however, most mice did not develop MBs, indicating that additional genetic alterations9 are required for MB formation. Unexpectedly, all Nes-cre;Foxr2KI;Trp53fl/fl mice developed tumors in the OB and/or BS with histological features of CNS-embryonal tumors. The main components of the tumors comprised small round blue cells with irregular round to oval cells accompanying abundant mitoses and highly proliferative activity. Tumor cells showed divergent differentiation into neuronal, glial, and mesenchymal lineages, which corresponds well to the definition of CNS-embryonal tumor. High prevalence of neuronal antigens and low expression level of the astrocytic marker, GFAP, in the tumors strongly suggest that the tumors differentiated toward the neuronal lineage, resembling CNS neuroblastoma or CNS NB-Foxr2. The congruence of gene expression profiles between the tumors and CNS NB-Foxr2 supported the notion that the tumors possess the characteristics of CNS NB-Foxr2. OB tumors more closely resembled CNS NB-Foxr2 than BS tumors did, as shown by the uniform expression of Olig2 and synaptophysin.8 Tumors mostly developed in the OB and BS in our model; however, CNS NB-Foxr2 mostly occurred in the cerebral cortex and rarely in the OB and BS. This could be explained by the inefficient Nes-cre recombination, as exhibited by the low GFP expression, in the cortex during embryonic development of the model studied. Another discrepancy between CNS NB-Foxr2 and Foxr2-induced tumors was that neuronal differentiation is rather premature in Foxr2-induced tumors, as we did not observe neurocytic cells and ganglion cells.
Mouse models of CNS-embryonal tumors that mimic human tumors are rare. Momota et al showed that the expression of c-Myc in SVZ NSCs in a Trp53 null background leads to formation of CNS-embryonal tumors at a frequency of ~34%.21 Jacques et al showed that inactivating Rb1, Trp53, and Pten in SVZ NSCs induces CNS-embryonal tumors at a frequency of ~51%.22 In contrast, Nes-cre;Foxr2KI;Trp53fl/fl mice developed CNS-embryonal tumors with 100% penetrance. Foxr2 plays a critical role in the formation of CNS-embryonal tumors because Trp53 deficiency alone was insufficient to induce CNS-embryonal tumors in Nes-cre;Trp53fl/fl mice.23 CNS-PNETs often harbor TP53 mutations,24,25 although it remains to be determined whether CNS NB-Foxr2 tumors harbor TP53 mutations.
Significant progress has been made in the molecular classification of CNS-embryonal tumors8,26,27; however, the cell-of-origin for CNS-embryonal tumors remains elusive. SVZ NSCs have been implicated as the potential cell-of-origin for CNS-embryonal tumors.22 Analysis of early proliferative lesions in the OB revealed the presence of Olig2+ proliferating cells outside the glomerular layer. Olig2 is a marker for OPCs. Modzelewska et al used a zebrafish model and showed that OPCs can act as the cell-of-origin for CNS-embryonal tumors that have characteristics of CNS NB-Foxr2.28 Similar to the tumors in the zebrafish model, OB tumors expressed Olig2, Sox10, and Erbb3, although activation of the Ras‒mitogen-activated protein kinase pathway was not observed (Supplementary Figure 6). These data raise the possibility that OPCs may serve as the cell-of-origin for OB tumors. To determine the cell-of-origin for OB tumors, conditional expression of Foxr2 in Olig2+ cells remains to be performed.
Taken together, these results demonstrate that Foxr2 acts as a key regulator in the development of CNS-embryonal tumor in mice. The high penetrant CNS-embryonal tumor phenotype in the present model serves as an important tool for analyzing the pathogenesis of CNS-embryonal tumor and for exploring effective therapeutic strategies to improve the clinical outcomes of patients with CNS NB-Foxr2.
Funding
Funding for this work was provided by the Japan Society for the Promotion of Science (JSPS) Grant-in-Aid for Scientific Research (C) (26430108), Grant-in-Aid for Scientific Research on Innovative Areas (15H01482), and Grant-in-Aid for Young Scientists (A) (17H04988) to HK. JSPS Grant-in-Aid for Scientific Research (C) (16K08731) to HM, and JSPS Grant-in-Aid for Scientific Research (A) (26253073) and the Platform Project for Supporting in Drug Discovery and Life Science Research (Platform for Drug Discovery, Informatics, and Structural Life Science) from Japan Agency for Medical Research and Development (AMED) (16cm0106218h0001) to TT.
Acknowledgments
The authors thank Dr Shigeru Noguchi and Dr Toshikuni Sasaoka for providing Nes-cre transgenic strain. The authors thank Dr Yoshinori Murakami for helpful suggestions and discussion. The authors thank Reiko Sakamoto for supporting ES cell work.
Conflict of interest statement. The authors disclose no potential conflicts of interest.
Authorship statement. HK conceived the idea of the project and led the project. BP, HK, and SW organized the project. BP and HK performed mouse experiments. BP performed culture experiments. BP, HK, HM, YI, and TT performed histological analysis of tumors. TK performed diagnosis of tumors. HK and NY generated Foxr2 transgenic mice. YS performed RNA-sequencing. BP and HK performed data analysis. BP, HK, and SW wrote the manuscript.


