


Abstract
Few data exist regarding the prognostic value of L-[S-methyl-11C]methionine (MET) PET for treatment-naïve gliomas.
A total of 160 glioma patients (89 men, 71 women; mean age: 45, range 18–84 y) underwent a MET PET prior to any therapy. The PET scans were evaluated visually and semiquantitatively by tumor-to-background (T/N) ratio thresholds chosen by analysis of receiver operating characteristics. Additionally, isocitrate dehydrogenase 1–R132H (IDH1-R132H) immunohistochemistry was performed. Survival analysis was done using Kaplan–Meier estimates and the Cox proportional hazards model.
Significantly shorter mean survival times (7.2 vs 8.6 y; P = 0.024) were seen in patients with amino acid avid gliomas (n = 137) compared with visually negative tumors (n = 33) in MET PET. T/N ratio thresholds of 2.1 and 3.5 were significantly associated with survival (10.3 vs 7 vs 4.3 y; P < 0.001). Mean survival differed significantly using the median T/N ratio of 2.4 as cutoff, independent of histopathology (P < 0.01; mean survival: 10.2 ± 0.8 y vs 5.5 ± 0.6 y). In the subgroup of 142 glioma patients characterized by IDH1-R132H status, METT/N ratio demonstrated a significant prognostic impact in IDH1-R132H wildtype astrocytomas and glioblastoma (P = 0.001). Additionally, multivariate testing revealed semiquantitative MET PET as an independent prognostic parameter for treatment-naïve glioma patients without (P = 0.031) and with IDH1-R132H characterization of gliomas (P = 0.024; odds ratio 1.57).
This retrospective analysis demonstrates the value of MET PET as a prognostic parameter on survival in treatment-naïve glioma patients.
Amino acid PET is an established nuclear medicine procedure in glioma imaging. Nevertheless, only few data exist regarding MET PET and its prognostic value. This study evaluated MET PET in a large and statistically robust treatment-naïve glioma population, demonstrating a significant impact on survival estimation. The calculated T/N ratio values were revealed as an independent prognostic parameter by multivariate analysis. Moreover, IDH1-R132H wildtype together with positive MET PET demonstrated a poorer prognosis in highly amino acid avid gliomas, especially in astrocytic tumors. The presented data are of clinical interest for the management of newly diagnosed glioma showing the significant impact of the amino acid metabolism visualized by radiolabeled amino acids on survival estimation.
Gliomas account for ~2% of all cancer-related deaths in the US, with 21 newly diagnosed cases in 100000 people per year.1,2 Imaging techniques are crucial for glioma diagnosis and therapeutic management. MRI is used most commonly for diagnosing brain tumors.3 However, amino acid PET has been proposed as an additional essential parameter for glioma characterization. The diagnostic accuracy of the longest established radiolabeled amino acid, L-[S-methyl-11C]methionine (MET), in the differential diagnosis of presumed gliomas has been reported with sensitivity of 83%–100%4–12 and specificity of 75%–100%4–9,12 independent of the tumor grade in the literature. Due to the very short half-life of 11C, tracer production is limited to centers having an in-house cyclotron available. Therefore, longer-lived fluorine-18–labeled amino acids such as O-(2-[18F]-fluoroethyl)-L-tyrosine (FET) and 3,4-dihydroxy-6-[18F]-fluoro-L-phenylalanine (FDOPA) have been successfully implemented.13
Besides an adequate diagnosis, the prognostic estimation of the disease is necessary for defining further therapeutic strategies. Various clinical and histopathological features, such as (i) age >40 years, neurologic deficits, tumor size >6 cm, growth of the glioma with infiltration of the opposite hemisphere, and histologic verification of an astrocytoma as negative variables and (ii) extensive tumor resection, frontal localization, and good performance status as positive variables, were shown useful for predicting survival in glioma patients.14–16 More recently, scientific advances have led to the identification of numerous molecular alterations, such as 1p/19q codeletion and isocitrate dehydrogenase 1 and/or 2 (IDH1/2) mutation, as particularly noteworthy because of their appearance early in glioma formation and their impact on patient survival.17 Lopci et al recently published for the first time a significant association between IDH1 mutation and MET PET.18 Besides biomarkers, the prognostic value of MET PET is under discussion in literature.19–29 Visual analysis of MET uptake within the glioma is reported to influence survival.21,28 For semiquantitative glioma characterization regarding prognosis, a MET tumor-to-background (T/N) ratio threshold of 2.0 or higher is reported applicable for deciding between better or worse prognosis.19–21,26,29 Other groups observed a T/N ratio value below 1.706, or even 1.51, as a significant indicator for better survival.22,23 On the contrary, other researchers could not ascertain any applicable threshold.25,27 Nevertheless, the investigated study cohorts were small and /or heterogeneous regarding their inclusion criteria. Moreover, all these studies used a region-of-interest technique for quantitative measurements disregarding volume-related information. Therefore, we aimed to analyze the prognostic value of MET PET in patients with treatment-naïve gliomas in a large, statistically robust, and homogeneous cohort for better understanding visual and volume-of-interest (VOI)–based MET uptake patterns of these tumors.
Materials and Methods
Patients
This retrospective study was approved by the local ethics committee. We analyzed treatment-naïve brain tumor patients who were referred from the department of neurosurgery for surgery planning from January 2000 to December 2014 to our institution for MET PET. Further inclusion criteria were minimum age of 18 years, histologically verified glioma, World Health Organization (WHO) grading according to the then current WHO classification, and availability of presurgical MRI data and the treatment reports of the patients. For survival analysis, we contacted the Center of Medical Statistics, Informatics, and Intelligent Systems (CEMSIIS) of the Medical University of Vienna supported by Statistics Austria. The patient’s prognosis was defined as overall survival, determined by the day of the diagnosis of a glioma documented by the medical patient reports till the date of death. Patients not defined by the cause of death query were censored for further calculations by the date of the last documented visit at the hospital.
Prognostic Parameters
Established prognostic factors, such as age at diagnosis, epileptic seizures, KPS, histologic tumor entity, WHO grading, surgical approach including resection and open or stereotactic biopsy, such as radiotherapy (RT) and/or chemotherapy (CHT), were determined based on the documented patient history. Moreover, IDH1-R132H mutation status was examined by immunohistochemistry. Formalin-fixed paraffin-embedded tumor sections were stained using the monoclonal anti–IDH1-R132H antibody and reagents on a Ventana autostainer as described previously.30 As a negative staining, the result does not rule out other rare IDH1 or IDH2 mutations; those cases are referred to as “not otherwise specified” (NOS).17 Moreover, pretherapeutic T2-weighted MR images and T1-weighted MR images before and after intravenous contrast medium application (0.1 mL/kg body weight of a gadolinium-based contrast agent) were reanalyzed for tumor localization, size, and contrast enhancement.
PET Data Acquisition
The radiotracer MET was produced in-house by the method described by Mitterhauser et al31 with a radiochemical purity higher than 97%. For PET acquisition, a dedicated full-ring GE Advance PET scanner (General Electric Medical Systems) was used for all patients (field of view: 14.875 cm, 35 slices per PET examination with a slice thickness of 4.25 mm). An average dose of 740 MBq MET was intravenously injected 20 minutes prior to the PET start. Data acquisition was performed for another 15 minutes in 3D mode. A transmission scan for attenuation correction was done afterward. Subsequently, the image reconstruction was done by filtered back projection using a Hanning filter with a cutoff value of 6.2 mm and a 128 × 128 matrix.
PET Data Analysis
All reconstructed PET data were transferred from the GE system and reevaluated by consensus of 2 experienced nuclear medicine physicians using Hermes software (Gold 3 Hermes Hybrid Viewer, Hermes Medical Solutions). For visual assessment, gliomas were analyzed for hypo-, iso-, or hypermetabolism of MET, as described by others (Supplementary Figure S1).11,28,29 Hypo- or isometabolism of gliomas was summarized as MET-negative brain tumors. For semiquantitative analysis, cuboid VOIs (20 mm × 20 mm × 20 mm) were manually generated containing the highest tracer uptake of the tumor and for background estimation in the contralateral brain. For the calculation of the T/N ratio, the maximal standardized uptake value (SUVmax) of the tumor was divided by the mean SUV of the background VOI. If no tracer uptake was seen, VOIs were drawn based on MRI.
Statistical Analysis
For statistical analysis, SPSS v22.0 (IBM) was used. A P-value < 0.05 was considered significant. Contingency tables, t-tests, and 2-way ANOVA were used for descriptive statistical analysis. The receiver operating characteristic (ROC) using the Youden index determined T/N ratio thresholds for splitting the patient contingent according to the WHO grading by means of MET PET. A detection rate over 80% was considered as most applicable. If, with respect to the error rate, a detection rate of over 80% was not reasonably achievable, a lower detection rate was chosen. Survival analysis was done using the Kaplan–Meier estimator with a log-rank test, excluding WHO grade I tumors due to the lack of events during the observation period. Common prognostic parameters were tested in a univariate Cox regression. Parameters appearing significant in univariate analysis were further tested in a multivariate Cox regression method.
Results
In this study, 160 patients were included (72 women, 88 men, mean age: 45 y, range: 18–84), revealing 46% low-grade gliomas (LGGs) and 54% high-grade gliomas (HGGs) (Table 1). During a mean observation period of 47 months, 63 of 160 patients (39%) died. The mean overall survival was 7.8 ± 0.6 years. Survival differences were found between different WHO grades and tumor entities. For astrocytomas (ACs), WHO grade II, a mean survival of 11 ± 0.8 years was observed; for WHO grade III AC, 6.7 ± 0.7 years; and for glioblastoma multiforme (GBM, WHO grade IV), 1.6 ± 0.2 years (P < 0.001). Oligodendroglial tumors (OTs; ie, oligodendrogliomas and oligoastrocytomas) showed a significantly better prognosis than ACs (OT: 10.6 ± 1 y; AC: 5.9 ± 0.7 y; P < 0.001).
Patient characteristics
| Characteristic | Value |
|---|---|
| Age, y | |
| Mean ± SD | 45±15 |
| Median | 44.5 |
| Range | 18–84 |
| Sex | |
| Male | 88 |
| Female | 72 |
| KPS | |
| Median | 85 |
| Range | 20–100 |
| Surgical approach | |
| Resection | 128 |
| Open biopsy | 11 |
| Stereotactic biopsy | 21 |
| Histology and WHO 2007 | |
| Low grade/high grade | 73/87 |
| Pilocytic astrocytoma | 2 |
| Astrocytoma (II/III/IV) | 32 / 25 / 33 |
| Oligodendroglioma (II/III) | 18 / 15 |
| Oligoastrocytoma (II/III) | 17 / 14 |
| Ganglioglioma | 4 |
MET PET and Survival
The lesions’ appearance as hypo- and isometabolic (n = 33) or hypermetabolic (n = 137) significantly influenced survival (P = 0.024). The Kaplan–Meier plot showed shorter mean survival times for patients with amino acid avid gliomas compared with visually negative tumors (7.2 vs 8.6 y; Supplementary Figure S2).
Two different T/N ratio thresholds for WHO grading were identified by ROC analysis. For significantly separating LGG from HGG a T/N ratio of 2.11 was observed (area under the curve [AUC]: 0.791, sensitivity 81%, specificity 71%), and for separating grade III gliomas from GBM a T/N ratio of 3.48 was observed (AUC: 0.772). Both thresholds were tested for their prognostic impact, observing different survival times for these 3 consecutive threshold-based groups (P < 0.001 and P = 0.035; Fig. 1, Supplementary Table S1). Moreover, distinct survival differences were seen independently of histopathology using the mean T/N ratio of 2.77 (T/N ratio <2.77: 10 y; T/N ratio >2.77: 5.1 y; P < 0.001) as well as the median T/N ratio of 2.36 as threshold (T/N ratio <2.36: 10.2 y; T/N ratio >2.36: 5.5 y; P < 0.001; Fig. 2), With respect to histology, significant survival differences were observed for AC separated by the mean as well as the median T/N ratio value (mean T/N ratio value = 2.98, P < 0.001; median T/N ratio value = 2.61, P < 0.001).
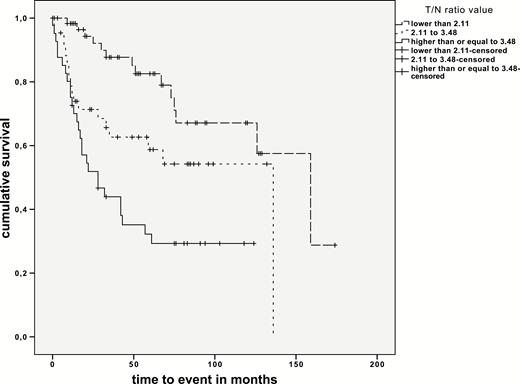
MET T/N ratios and survival.
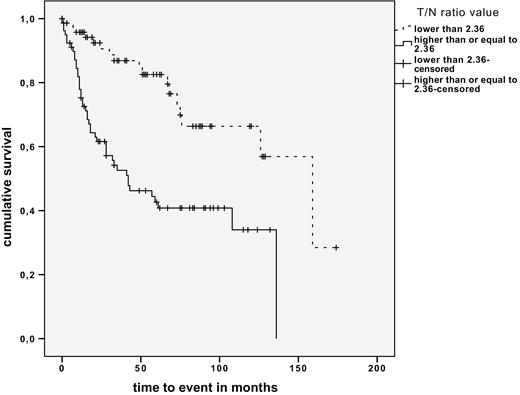
MET T/N ratio and survival independent of glioma histology.
MET PET and Other Prognostic Parameters
For estimation of MET PET as a prognostic marker, in a first step the univariate Cox regression analysis revealed visual MET uptake (P = 0.024) and the T/N ratio as a steady variable (P < 0.001) as parameters significantly influencing survival besides some others (Supplementary Table S2). Implementing all of these significant parameters (ie, age, sex, histology, WHO grading, tumor crossing midline, frontal tumor localization, parietal tumor localization, T/N ratio, visual tracer uptake, surgical approach, following therapeutic approach, tumor uptake of MRI contrast agent, KPS), multivariate analysis revealed as significantly prognostic for survival the following, by decreasing order of significance: WHO grading, surgical approach, tumor crossing midline, parietal tumor localization, T/N ratio as steady variable, and histology (Table 2).
Prognostic parameters established by multivariate analysis including WHO 2007 grading and IDH1-R132H mutation status
| Multivariate Analysis Including 2007 WHO Grading | ||
|---|---|---|
| Prognostic Parameters | P-value | OR (95% CI) |
| WHO grading | <0.001 | II vs IV: 0.05 (0.02–0.1) III vs IV: 0.17 (0.09–0.32) |
| Surgical approach | <0.001 | Resect. vs BIO: 0.20 (0.12–0.34) |
| Tumor crossing midline | 0.001 | 3.47 (1.78–6.75) |
| Parietal tumor localization | 0.029 | 2.95 (1.62–5.36) |
| METT/N ratio | 0.031 | 1.57 (1.34–1.84) |
| Histology | 0.041 | OT vs AC: 0.24 (0.13–0.45) |
| Multivariate Analysis with Respect to IDH1-R132H Mutation Status | ||
| Prognostic Parameters | P-value | OR (95% CI) |
| Surgical approach | <0.001 | Resect. vs BIO: 0.20 (0.12–0.34) |
| METT/N ratio | 0.001 | 1.57 (1.34–1.84) |
| Tumor crossing midline | 0.001 | 3.47 (1.78–6.75) |
| IDH1-R132H mutation status | 0.001 | 0.26 (0.14–0.49) |
| Therapy following surgery | 0.001 | Surgery vs RCHT: 0.17 (0.08–0.39) RT vs RCHT: 0.14 (0.04–0.54) CHT vs RCHT: not significant |
| Parietal tumor localization | 0.052 | 2.95 (1.62–5.36) |
Abbreviations: Resect. = tumor resection, BIO = biopsy, OT = oligodendroglial tumors (oligodendrogliomas and oligoastrocytomas), AC = astrocytomas including glioblastomas, RCHT = radiochemotherapy.
IDH1-R132H Status
A subgroup of 142 patients was examined for IDH1-R132H mutation by immunostaining, showing 75 patients with an IDH1-R132H mutation and 67 patients without, further specified as gliomas NOS (Fig. 3). Moreover, the IDH1-R132H mutation significantly positively influenced patient survival (P < 0.001, odds ratio [OR] = 0.26), with a mean survival of 5.4 years (range: 4.1–6.6) for patients with NOS tumors and 10.1 years (range: 8.6–11.5) for IDH1-R132H mutated tumors. Analyzing AC and OT separately based on histopathological grading, IDH1-R132H mutation status was only prognostic for survival in AC (P = 0.002, OR = 0.25). Considering MET PET data, a significantly higher T/N ratio value was seen in NOS tumors than in IDH1-R132H mutant tumors (NOS T/N ratio: 3.19; IDH1-R132H mutated T/N ratio: 2.31; P < 0.001). While no significant survival differences were seen for NOS and mutated GBM, significantly higher mean T/N ratio values were observed in GBM NOS (P = 0.022, NOS T/N ratio: 4.48 vs IDH1-R132H mutated T/N ratio: 1.49). In high-grade AC, the IDH-R132H mutation was significantly associated with longer mean survival as well as lower T/N ratios (2.1 y and 7.2 y, P = 0.004, OR 0.17; T/N ratios 4.05 and 2.40, P = 0.012). While the T/N ratio had a significant prognostic impact on NOS tumors, in IDH1-R132H mutated tumors the T/N ratio had no prognostic value (P < 0.001, OR = 1.58; P = 0.833). With availability of IDH1-R132H immunohistochemistry a second multivariate analysis based on similar significant prognostic results of univariate testing was performed replacing the 2007 WHO grading by the IDH1-R132H mutation status (Supplementary Table S3). This way the therapeutic approach following surgery was identified as an additional independent prognostic parameter. Moreover, IDH1-R132H status was found to be a strong independent prognostic parameter (Table 2).
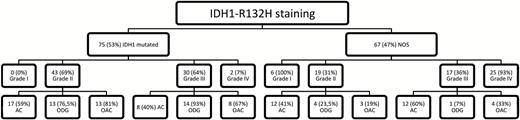
Distribution of IDH1-R132H mutation between WHO grades and histologic subgroups.
Discussion
In the presented study we aimed at evaluating the role of MET PET for predicting prognosis in therapy-naïve gliomas. For this purpose we evaluated a large and statistically robust cohort of glioma patients in line with reported survival differences in WHO grades II to IV as well as in OT compared with AC.32
In concordance with literature, most gliomas appeared as amino acid avid lesions in MET PET.11,28,29 Still, amino acid negativity indicated for a better prognosis, which is in line with results by Kim et al.28 Next to WHO grading, surgical approach, and tumor crossing midline, which were the most powerful prognostic parameters, the T/N ratio value was also found to have a significant impact on survival in our study. Observing 2 T/N ratio thresholds discriminating LGG from HGG and moreover separating grade III gliomas and GBM, significant differences in mean survival times were seen. In literature, the published thresholds for MET PET as a prognostic parameter in gliomas vary. Some authors found a threshold of 2.0 or higher as applicable,19–21,26,29 while Nariai et al23 and Singhal et al22 observed T/N ratios under 1.706 and 1.51, respectively, as significant indicators for better survival. Others did not find any prognostic value of MET uptake.25,27 Most authors used region of interest–based techniques for tracer uptake quantification bearing the risk of not sampling the maximum measured pixel within the tumor.19–25,27–29 Only Takano et al26 and Yoo et al33 utilized a 3D VOI technique. Nevertheless, the definition of the VOI and the T/N ratios differed between these 2 studies, which partly explains the different results. Furthermore, differences in scanner performance and reconstruction settings may also contribute to different findings.34,35
Differences in survival were also observed by semiquantitative analysis independent of histopathologic features in our study. This is a very important aspect, because besides histopathological diagnosis of gliomas, biomarkers have been recently introduced by the new 2016 published WHO classification for gliomas.36 Showing an independently significant prognostic value of MET PET by the T/N ratio estimation for glioma patients outlines the power of semiquantitative PET data analysis. Nariai et al also reported a prognostic relevance of MET PET using a median T/N ratio value among 73 patients.23 In contrast, the mean T/N ratio value used as a cutoff did not show any significant differences in survival as observed by Kobayashi et al in 52 patients.25 In our analysis, survival differences were seen for the mean as well as the median T/N ratio value as threshold. Investigations into fluorine-18 labeled amino acid compounds with the advantage of an independent non–in-house tracer production such as FDOPA also indicated for a value by semiquantitative analysis in newly diagnosed gliomas especially regarding progression-free survival.37 For FET, other parameters such as the minimal time to peak in dynamic imaging38 and the biological tumor volume39 were stronger prognostic parameters than the semiquantitative uptake.40 Besides T/N ratios, amino acid metabolic tumor volume estimated by quantitative analysis is also supposed to influence survival25,33 and may be especially helpful in radiotherapy planning.39,41 However, threshold-based tumor volume delineation is not applicable for amino acid tracer negative lesion or lesions with a maximum tracer uptake lower than the set threshold. Therefore, this method is not applicable in general.
Multivariate data analysis of this study suggested that WHO grade, surgical approach, tumor crossing midline, a parietal tumor localization, T/N ratio value, and histology are the most reliable prognostic parameters in newly diagnosed gliomas. In literature, potential prognostic factors are discussed controversially. Age over 40 years, neurologic deficits, tumor size >6 cm, tumor infiltration of the opposite hemisphere, and the histologic verification of an AC are indicators for a worse prognosis in LGG.14 By univariate testing, we observed similar results for our study population. More extensive tumor resection, younger age, good performance status, GBM with combined treatment with RT and temozolomide, and frontal tumor localization were seen as indicators for better prognosis.15,16 Nariai et al also found pretreatment T/N ratio as well as patient age, but not KPS, predictive for patient survival.23 Others even identified the T/N ratio as the most important prognostic factor in AC.19 Consistently, T/N ratio as a continuous variable was a strong parameter for survival estimation in our cohort by uni- and multivariate testing. The positive prognostic value of total surgical tumor resection compared with subtotal resection biopsy only is well known supporting our results.42–44 Nevertheless, tumor size >5 cm42,45 and >6 cm14 and epileptic seizures43 seen as prognostic factors by others had no prognostic impact in our cohort, which is in concordance with the results of other groups.43,46 Some authors reported an impact of tumor localization on outcome. Colen et al found a worse outcome for patients with tumors across the midline, which matches the negative effect on survival of a tumor crossing the midline in our analysis.47 Others described a tumor localization in the periventricular occipitotemporal white matter as an indicator for poorer prognosis.48 In our analysis the majority of tumors affecting the parietal lobe were HGGs, whereas in the frontal lobe more LGGs were found (parietal lobe: 81% HGG, frontal lobe: 44% HGG). Nevertheless, Gorlia et al observed a better survival for GBM with predominant frontal tumor location.15 One possible explanation for the worse outcome of patients with parietal glioma affection in our study cohort is the lack of resectability because of the neurological functions located in this area.
With respect to the recent update of the WHO classification of CNS tumors based on molecular parameters, we did a separate multivariate analysis integrating IDH mutation status. We additionally found IDH1-R132H mutation status, age, therapeutic approach following surgery, as well as KPS as independent prognostic parameters in newly diagnosed glioma. Nevertheless, tumor histology, being an independent prognostic parameter upon multivariate analysis, lost power. This may be due to the strong association of IDH1-R132H mutation status with tumor histology, with most mutant tumors being OT. Supporting our findings, age at time of diagnosis23,42,43 as well as KPS43 were also identified as prognostic parameters by others. In case of therapeutic approach following surgical intervention, it has to be noted that no further therapy showed equal results as postoperative RT. Significant survival differences were only seen for the groups receiving CHT versus combined RT and CHT and for the groups without further postoperative treatment, respectively receiving RT only, probably explained by the choice of postoperative treatment based on WHO 2007 classified tumor grading, preferring CHT or combined RT and CHT for HGG.49
Due to the retrospective character of this study, one limitation is that the 2016 WHO classification update36 was not available. Nevertheless, we additionally performed an IDH1-R132H mutation immunostaining for better characterizing a large series of treatment-naïve glioma patients. Only very few data exist regarding amino acid metabolism in gliomas also characterized by biomarkers. Thon et al investigated 18F-FET and biomarkers such as IDH1 mutation and 1p/19q codeletion in terms of prognosis, observing the dynamic imaging findings as an independent imaging biomarker for patients with suspected WHO grade II gliomas.50 Lopci et al recently reported a statistically significant association between progression-free survival, tumor grade, IDH1 mutation, 1p/19q codeletion, O6-methylguanine-DNA-methyltransferase promoter methylation, SUVmax, and T/N ratio of MET PET in a mixed study population of nontreated and treated glioma patients.18 We demonstrated in a large series of 142 treatment-naïve glioma patients besides the known positive influence of IDH-R132H mutation for survival a significantly higher T/N ratio value for NOS tumors than IDH1-R132H mutated gliomas. Moreover, we ascertained significantly lower mean T/N ratio values in IDH1 mutated GBM. This may be also due to the higher amount of IDH1 mutated GBM examined by Lopci et al (6/28 vs 2/27 in our analysis).18 Moreover, we could demonstrate semiquantitative MET PET as an independent prognostic factor for survival, probably because of the more homogeneous study population.
In conclusion, visual as well as semiquantitative MET PET evaluation has a significant prognostic impact in treatment-naïve gliomas. In particular, the T/N ratio value was identified as an independent prognostic parameter for survival. Moreover, IDH1-R132H mutation status together with MET PET demonstrated a poorer prognosis in highly amino acid metabolically active gliomas, especially in astrocytic ones.
Supplementary Material
Supplementary material is available at Neuro-Oncology online.
Funding
This analysis was not funded by any funding agency in the public, commercial, or nonprofit sector.
Conflict of interest statement. None of the authors has any conflict of interest to declare.


