


Abstract
Brain metastases are a common complication of renal cell carcinoma (RCC). Our group previously published the Renal Graded Prognostic Assessment (GPA) tool. In our prior RCC study (n = 286, 1985–2005), we found marked heterogeneity and variation in outcomes. In our recent update in a larger, more contemporary cohort, we identified additional significant prognostic factors. The purpose of this study is to update the original Renal-GPA based on the newly identified prognostic factors.
A multi-institutional retrospective institutional review board–approved database of 711 RCC patients with new brain metastases diagnosed from January 1, 2006 to December 31, 2015 was created. Clinical parameters and treatment were correlated with survival. A revised Renal GPA index was designed by weighting the most significant factors in proportion to their hazard ratios and assigning scores such that the patients with the best and worst prognoses would have a GPA of 4.0 and 0.0, respectively.
The 4 most significant factors were Karnofsky performance status, number of brain metastases, extracranial metastases, and hemoglobin. The overall median survival was 12 months. Median survival for GPA groups 0–1.0, 1.5–2.0, 2.5–3, and 3.5–4.0 (% n = 25, 27, 30 and 17) was 4, 12, 17, and 35 months, respectively.
The updated Renal GPA is a user-friendly tool that will help clinicians and patients better understand prognosis, individualize clinical decision making and treatment selection, provide a means to compare retrospective literature, and provide more robust stratification of future clinical trials in this heterogeneous population. To simplify use of this tool in daily practice, a free online application is available at brainmetgpa.com.
This study is important because it provides a simple method to estimate survival for a markedly heterogeneous population: patients with renal cell carcinoma and brain metastases. This prognostic index, the Renal GPA, can be used to individualize clinical decision making and improve stratification of future clinical trials.
Worldwide, a diagnosis of renal cell carcinoma (RCC) will be made in an estimated 320000 patients, and 140000 will die from the disease annually.1 The incidence of the disease has been rising and now represents 2%–3% of adult cancers,2 but mortality has decreased due to the emergence of more effective systemic therapies.3 Approximately 10%–16% (32000–51200 worldwide) of RCC patients will develop brain metastases (BM).4,5 Treatment for BM has evolved in recent years, away from the use of whole brain radiation therapy (WBRT) and toward stereotactic radiosurgery (SRS) alone, in order to avoid the neurocognitive toxicity associated with WBRT.6 Our group previously published prognostic factors7 and designed a diagnosis-specific prognostic index (Graded Prognostic Assessment [GPA]) for patients with RCC and BM.8 With a sample size of 286 RCC patients with BM, we found that only 2 factors were significant for prediction of survival duration: Karnofsky performance status (KPS) and the number of BM. Recently, we updated that work and identified additional prognostic factors in a larger, contemporary cohort of 711 patients with diagnoses between January 1, 2006 and December 31, 2015.9 The purpose of this study is to update the original Renal GPA based on the newly identified prognostic factors.
Methods
An international consortium of 13 institutions created a retrospective institutional review board–approved database of 711 RCC patients with new brain metastases diagnosed from January 1, 2006 to December 31, 2015 using the Research Electronic Data Capture (REDCap) interactive software. Demographic data and clinical parameters were correlated with overall survival measured from start of treatment for brain metastases. Variables considered included the factors in the Memorial Sloan Kettering Cancer Center prognostic model10 (KPS, hemoglobin [Hgb], serum calcium, lactate dehydrogenase [LDH], neutrophil count, and platelet count) and extracranial metastases (ECM), age, number of BM, and sex.
Multiple Cox regression was used to initially select and weight variables to be included in the new Renal GPA. Continuous variables were categorized into approximate quartiles to assess potential nonlinear effects. Both effect magnitude (hazard ratio [HR]) and statistical significance were used to select variables, which were weighted in proportion to their HRs, and an updated Renal GPA index was designed such that the patients with the best and worst prognoses had Renal GPA scores of 4.0 and 0.0, respectively. The final index was chosen on the basis of separation of prognostic classes with respect to overall survival, distribution of patients, and simplicity. Log-rank tests were used to compare adjacent classes. SAS version 9.4 was used for statistical analysis.
The predictive discrimination of the original and revised Renal GPA was compared by calculation of the concordance probability (c-index). Since the same data were used to both devise and evaluate the new GPA, we used a 100-sample bootstrap to calculate a bias-corrected c-index which is more likely to reflect performance on external data. A second 100-sample bootstrap was used to generate the confidence interval for the difference.
Results
Table 1 shows median survival (MS) by patient characteristics. The original Renal GPA7,8 and its aforementioned component factors (KPS and number of BM) remain highly significant for both MS and time from primary diagnosis to BM. Additional factors were found to be significant: ECM, Hgb, and to a lesser extent, calcium, neutrophil, and platelet counts.
Patient characteristics and median survival
| Variable | Category | N (%) | Median Survival (IQR) | P |
|---|---|---|---|---|
| Overall | 711 (100) | 12 (5, 30) | - | |
| Original GPA | <0.001 | |||
| 0–1 | 106 (15) | 5 (2, 8) | - | |
| 2 | 192 (27) | 9 (4, 21) | - | |
| 3 | 262 (37) | 14 (5, 35) | - | |
| 4 | 126 (18) | 26 (11, 62) | - | |
| NR | 25 (4) | 20 (7, 47) | - | |
| KPS | <0.001 | |||
| <70 | 106 (15) | 5 (2, 13) | - | |
| 70 | 145 (20) | 6 (3, 14) | - | |
| 80 | 194 (27) | 13 (5, 26) | - | |
| 90 | 179 (25) | 20 (9, 49) | - | |
| 100 | 62 (9) | 28 (10, 102) | - | |
| NR | 25 (4) | 20 (7, 47) | - | |
| Number BM | <0.001 | |||
| 1 | 381 (54) | 17 (5, 39) | - | |
| 2 | 137 (19) | 12 (5, 24) | - | |
| 3 | 77 (11) | 9 (4, 26) | - | |
| 4 | 34 (5) | 8 (2, 14) | - | |
| >4 | 82 (12) | 6 (2, 17) | - | |
| Extracranial mets | <0.001 | |||
| Absent | 83 (12) | 36 (11, 61) | - | |
| Present | 605 (85) | 11 (4, 26) | - | |
| NR | 23 (3) | 8 (4, 19) | - | |
| Age | 0.077 | |||
| 16–54 | 183 (26) | 16 (5, 34) | - | |
| 55–61 | 169 (24) | 11 (4, 34) | - | |
| 62–68 | 171 (24) | 13 (4, 36) | - | |
| 69–88 | 188 (26) | 11 (4, 24) | - | |
| Sex | 0.217 | |||
| Male | 519 (73) | 12 (5, 32) | - | |
| Female | 192 (27) | 11 (4, 26) | - | |
| Hemoglobin | <0.001 | |||
| 5.5–11.1 | 135 (19) | 5 (2, 11) | - | |
| 11.2–12.5 | 129 (18) | 11 (4, 25) | - | |
| 12.6–14.3 | 135 (19) | 16 (8, 42) | - | |
| 14.4–512 | 141 (20) | 18 (7, 47) | - | |
| NR | 171 (24) | 15 (6, 39) | - | |
| LDH | 0.563 | |||
| 0–162 | 77 (11) | 14 (4, 35) | - | |
| 163–237 | 77 (11) | 12 (5, 34) | - | |
| 238–435 | 77 (11) | 13 (5, 30) | - | |
| 436–1665 | 76 (11) | 9 (4, 20) | - | |
| NR | 404 (57) | 12 (5, 31) | - | |
| Serum calcium | 0.021 | |||
| 1.9–8.8 | 122 (17) | 8 (3, 19) | - | |
| 8.9–9.2 | 134 (19) | 12 (4, 34) | - | |
| 9.3–9.6 | 117 (16) | 14 (6, 47) | - | |
| 9.7–15.0 | 122 (17) | 11 (5, 26) | - | |
| NR | 216 (30) | 14 (5, 38) | - | |
| Neutrophils | 0.016 | |||
| 0.6–3.9 | 122 (17) | 12 (6, 29) | - | |
| 4.0–5.6 | 127 (18) | 12 (4, 36) | - | |
| 5.7–9.5 | 122 (17) | 11 (4, 38) | - | |
| 9.6–38 | 125 (18) | 9 (3, 20) | - | |
| NR | 215 (30) | 15 (6, 40) | - | |
| Platelets | 0.010 | |||
| 35–192 | 136 (19) | 12 (6, 26) | - | |
| 193–241 | 135 (19) | 13 (5, 41) | - | |
| 242–315 | 136 (19) | 12 (5, 32) | - | |
| 316–170,000 | 132 (19) | 7 (3, 23) | - | |
| NR | 172 (24) | 15 (6, 39) | - |
NR: Not reported. Median survival is in months from start of BM treatment (Kaplan–Meier estimate). Variables were measured at time of BM diagnosis. P-values are from single variable log-rank tests of equivalence among categories, excluding NR.
Table 2 shows results of multivariable regression on overall survival. The 4 most significant factors (all with P < 0.001) (KPS, number of BM, ECM, and Hgb) were employed in the revised Renal GPA. Age and sex were not independently prognostic. Due to the high percentage of unreported data for LDH, serum calcium, neutrophil count, and platelet count, we fit a second (unreported) model that included those variables. None showed strong evidence of independent prognostic ability (P = 0.13, 0.65, 0.24, and 0.67, respectively), and because of this and the degree of incomplete data, those variables were not retained in the revised GPA. However, given the smaller subset of patients with complete data, our analysis does not preclude the possibility that one or more could have some association with survival.
Multivariable analysis and risk of death (HRs) of prognostic factors for patients with renal cell carcinoma and brain metastases
| Variable | Category | N (%) | Hazard Ratio (95% CI) | P |
|---|---|---|---|---|
| KPS | <0.001 | |||
| <70 | 106 (15) | 5.3 (3.4, 8.1) | ||
| 70 | 145 (20) | 3.7 (2.5, 5.6) | ||
| 80 | 194 (27) | 2.3 (1.6, 3.4) | ||
| 90 | 179 (25) | 1.3 (0.9, 1.9) | ||
| 100 | 62 (9) | 1.0 (Ref) | ||
| NR | 25 (4) | 1.4 (0.8, 2.7) | ||
| Number of BM | <0.001 | |||
| 1 | 381 (54) | 1.0 (Ref) | ||
| 2 | 137 (19) | 1.4 (1.1, 1.8) | ||
| 3 | 77 (11) | 1.6 (1.2, 2.1) | ||
| 4 | 34 (5) | 1.7 (1.1, 2.5) | ||
| > 4 | 82 (12) | 2.0 (1.5, 2.7) | ||
| Extracranial mets | <0.001 | |||
| Absent | 83 (12) | 1.0 (Ref) | ||
| Present | 605 (85) | 2.1 (1.5, 2.9) | ||
| NR | 23 (3) | 1.2 (0.6, 2.4) | ||
| Age | 0.417 | |||
| 16–54 | 183 (26) | 1.0 (Ref) | ||
| 55–61 | 169 (24) | 1.2 (1.0, 1.6) | ||
| 62–68 | 171 (24) | 1.2 (1.0, 1.5) | ||
| 69–88 | 188 (26) | 1.1 (0.9, 1.4) | ||
| Sex | 0.521 | |||
| Male | 519 (73) | 1.1 (0.9, 1.3) | ||
| Female | 192 (27) | 1.0 (Ref) | ||
| Hemoglobin | <0.001 | |||
| 5.5–11.1 | 135 (19) | 2.6 (1.9, 3.6) | ||
| 11.2–12.5 | 129 (18) | 1.7 (1.2, 2.3) | ||
| 12.6–14.3 | 135 (19) | 1.2 (0.8, 1.6) | ||
| >14.3 | 141 (20) | 1.0 (Ref) | ||
| NR | 171 (24) | 1.2 (0.9, 1.6) |
NR: Not reported. Hazard ratios are from multiple Cox regression of overall survival from start of treatment for BM.
Treatment
Effect of surgery, stereotactic radiosurgery, and whole brain radiation therapy
Median survival and risk of death by treatment and treatment era are shown in Table 3. Because of the rapid evolution of targeted therapies, we analyzed MS from 2006–2010 (n = 306) and 2011–2015 (n = 405) and found no difference. The MS for each sub-era was 12 months.
Median survival and risk of death by treatment and treatment era
| Overall | WBRT | SRS | WBRT + SRS | S + SRS | S + WBRT | S + WBRT + SRS | |
|---|---|---|---|---|---|---|---|
| Historical cohort N (%) Mean GPA Median survival | 286 2.6 10 | 78 (27%) 2.1 5 | 131 (46%) 2.9 11 | 46 (16%) 2.5 12 | 11 (4%) 2.8 13 | 18 (6%) 3.3 16 | 2 (1%) 3.0 9 |
| Risk of death (HR) | 1.00 | 0.82 | 0.68 | 0.76 | 0.66 | 0.76 | |
| 95% CI | 0.56, 1.21 | 0.41, 1.13 | 0.36, 1.59 | 0.36, 1.21 | 0.10, 5.68 | ||
| P-value | 0.31 | 0.14 | 0.47 | 0.18 | 0.79 | ||
| Current Study | |||||||
| N (%) | 711 | 90 (12%) | 410 (58%) | 41 (6%) | 70 (10%) | 23 (3%) | 4 (1%) |
| Mean GPA | 2.6 | 1.7 | 2.7 | 2.3 | 2.6 | 2.4 | 2.8 |
| Median survival | 12 | 5 | 11 | 11 | 24 | 16 | 11 |
| Risk of death (HR) | 1.00 | 0.84 | 0.78 | 0.38 | 0.64 | 1.29 | |
| 95% CI | 0.62, 1.12 | 0.51, 1.19 | 0.25, 0.59 | 0.38, 1.08 | 0.45, 3.68 | ||
| P-value | 0.23 | 0.25 | < 0.01 | 0.09 | 0.64 |
Hazard ratio (HR), 95% CI, and P (each treatment vs. WBRT alone within each cohort) adjusted for GPA. Median survival is unadjusted, in months. Nine patients in the current study did not have an initial treatment reported; 28 had surgery alone, and 11 had fractionated partial brain radiation alone.
Effect of drug treatment
To investigate whether any systemic therapy improved survival for RCC patients with BM, we analyzed the type and timing (before, after, or both before and after) the diagnosis of BM. Table 4 shows a multivariable analysis of the risk of death (HRs) by type and timing of drug therapy (vascular endothelial growth factor [VEGF] inhibitors, mammalian target of rapamycin [mTOR] inhibitors, immunotherapy, cytokines, anti-angiogenic agents, cytotoxic chemotherapy), adjusted for GPA. As expected, the most commonly employed drug categories were the inhibitors of VEGF (used in 70% of patients) and of mTOR (used in 33% of patients).
Multivariable analysis of risk of death (HR) by type and timing of drug therapy in RCC patients with BM
| Drug Never Used, N (%) | Drug Used, N (%) | Drug Used Before BM Only, N (%) | Drug Used After BM Only, N (%) | Drug Used Before & After BM, N (%) | Drug Used: Unknown Timing, N (%) | HR for Drug Use Before BM (95% CI) | HR for Drug Use After BM (95% CI) | |
|---|---|---|---|---|---|---|---|---|
| VEGF targeted TKI | 216/711 (30%) | 495/711 (70%) | 72 (10%) | 142 (20%) | 145 (20%) | 136 (19%) | 1.5 (1.3, 1.8) | 1.0 (0.7, 1.3) |
| mTOR targeted TKI | 477/711 (67%) | 234/711 (33%) | 43 (6%) | 73 (10%) | 30 (4%) | 88 (12%) | 1.8 (1.3, 2.3) | 1.4 (1.1, 1.9) |
| Immunotherapy | 661/711 (93%) | 50/711 (7%) | 6 (1%) | 33 (5%) | 7 (1%) | 4 (1%) | 1.0 (0.5, 2.0) | 0.9 (0.5, 1.7) |
| Cytokines | 602/711 (85%) | 109/711 (15%) | 54 (8%) | 21 (3%) | 11 (2%) | 23 (3%) | 0.9 (0.7, 1.2) | 0.5 (0.3, 1.0) |
| Anti-angiogenic drugs | 623/711 (88%) | 88/711 (12%) | 25 (4%) | 33 (5%) | 6 (1%) | 24 (3%) | 1.7 (1.1, 2.5) | 2.5 (1.7, 3.7) |
| Cytotoxic chemotherapy | 643/711 (90%) | 68/711 (10%) | 15 (2%) | 15 (2%) | 4 (1%) | 34 (5%) | 1.4 (0.8, 2.2) | 1.9 (1.1, 3.4) |
TKI = tyrosine kinase inhibitor. The number and percentage of patients who received each class of drug is given, overall and within time intervals relative to BM diagnosis/start of treatment. Overall survival (mortality) HRs from BM diagnosis/start of treatment are calculated as follows. The HR for drug use before BM represents the relative rate of death following BM for patients who had been treated with the respective drug before BM versus those who had not (ie, it compares the “Before” and “Before and After” groups versus “After” and “Never”; unknowns excluded). The HR for drug use after BM uses a time-dependent variable for initiation of drug treatment after BM, excluding anyone who started drug treatment before BM. It represents the relative rate of death for patients following initiation of the drug after BM versus those who had not been treated with the drug by a given time. For example, for anti-VEGF TKI, patients who had initiated the drug before BM had a higher mortality rate after BM compared with patients who did not receive a VEGF-targeted TKI before BM (HR 1.5), whereas the mortality rate remained similar if the drug was initiated after BM (HR 1.0). Both HRs are adjusted for GPA using multiple Cox regression.
Patients who received VEGF inhibitors prior to the development of BM (n = 217) had a 1.5× higher risk of death (HR: 1.5; 95% CI: 1.3 to 1.8; P < 0.01) compared with patients who did not receive VEGF inhibitors before the diagnosis of BM, whereas the mortality rate remained similar if the drug was initiated after BM (n = 142) compared with those who never received that type of drug (HR: 1.0; 95% CI: 0.7 to 1.3; P = 0.82).
For mTOR inhibitors, patients who received them prior to BM diagnosis (n = 73) had a 1.8× greater risk of death than those who did not receive them prior to BM diagnosis (HR: 1.8; 95% CI: 1.3 to 2.3; P < 0.01), and patients who received them after the diagnosis of BM (n = 73) had a 1.4× greater risk of death (HR: 1.4; 95% CI: 1.1 to 1.9; P = 0.02) compared with those who did not receive them after BM diagnosis.
Regarding immunotherapy, patients who received immunotherapy prior to the diagnosis of BM (n = 13) had the same risk of death as those who did not receive immunotherapy before BM (HR: 1.0; 95% CI: 0.5 to 2.0; P = 0.96), and patients who received immunotherapy after BM diagnosis (n = 33) had essentially the same risk of death as those who did not receive immunotherapy after BM (HR: 0.9; 95% CI: 0.5 to 1.7; P = 0.74).
Patients who received anti-angiogenic drugs before BM diagnosis (n = 31) had a 1.7× higher risk of death than those who did not (HR: 1.7; 95% CI: 1.1 to 2.5; P = 0.01), and those who received anti-angiogenic drugs after BM diagnosis (n = 33) had a 2.5× greater risk of death than those who did not receive those drugs after BM diagnosis (HR: 2.5; 95% CI: 1.7 to 3.7; P < 0.01).
Regarding cytotoxic chemotherapy, patients who received chemotherapy before diagnosis of BM (n = 19) had a 1.4× greater risk of death than those who did not receive it before BM (HR: 1.4; 95% CI: 0.8 to 2.2; P = 0.23), and patients who received chemotherapy after the diagnosis of BM (n = 15) had a 1.9× greater risk of death than those who did not receive chemotherapy after the diagnosis of BM (HR: 1.9; 95% CI: 1.1 to 3.4; P = 0.02).
Cytokines (high-dose interleukin-2, interferon, granulocyte-macrophage colony-stimulating factor) appear to be the exception—the only drug category with a favorable HR. While the risk of death was similar for patients who received cytokines before BM (n = 65) compared with those who did not (HR: 0.9; 95% CI: 0.7 to 1.2; P = 0.44), patients who received cytokines after the BM diagnosis (n = 21) had a risk of death that was only half (HR: 0.5; 95% CI: 0.3 to 1.0; P = 0.04) that of those who did not receive them after the BM diagnosis. Of those 21 patients, 17 received SRS.
These estimates were adjusted for GPA but could still be subject to selection and timing bias.
Table 5 illustrates the scoring criteria and elements of the revised Renal GPA, and a worksheet for calculation of the revised Renal GPA is included. The 4 most significant factors (all with P < 0.001) (KPS, number of BM, ECM, and Hgb) were employed in the revised Renal GPA. The scoring criteria, weighted in proportion to their HRs, were assigned scores of 0.0, 0.5, 1.0, and 2.0. Patients with unreported Hgb were assigned a score of 0.5 for that component. A user-friendly, free, online application is available at brainmetgpa.com to facilitate the use of this tool. Overall survival plots (Kaplan–Meier) by GPA groups demonstrate clear separation and are illustrated in Figure 1. Statistical comparison of adjacent GPA classes strongly indicated distinct survival distributions (P < 0.001 for 0–1 vs 1.5–2 and 2.5–3 vs 3.5–4; P = 0.01 for 1.5–2.0 vs 2.5–3.0).
Definition of the updated GPA for RCC patients with BM (Renal-GPA) and worksheet for Renal GPA score calculation
| Factor | Renal GPA Scoring Criteria | Patient Score | |||
|---|---|---|---|---|---|
| 0 | 0.5 | 1.0 | 2.0 | ||
| KPS | < 80 | 80 | 90–100 | _____ | |
| ECM | Present | Absent | _____ | ||
| Hgb | ≤11 | 11.1–12.5 | >12.5 | _____ | |
| # of brain mets | >4 | 1–4 | _____ | ||
| Total score | _____ | ||||
Median survival (mo) by GPA: GPA 0–1.0; 4 months, GPA 1.5–2.0; 12 months, GPA 2.5–3.0; 17 months, GPA 3.5–4.0; 35 months.
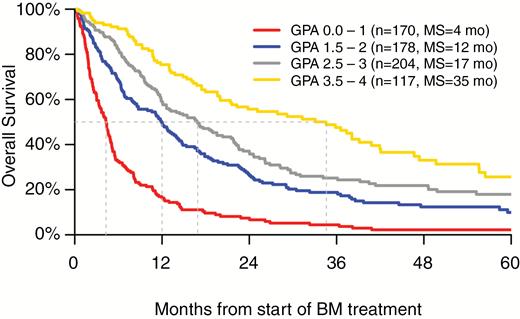
Kaplan–Meier curves showing overall survival by GPA groups.
Table 6 shows patient distribution and median survival by GPA scores. The patient distribution was 25%, 27%, 30%, and 17% for GPA 0–1.0, 1.5–2.0, 2.5–3.0, and 3.5–4.0, respectively. Corresponding median survival by GPA grouping was 4, 12, 17, and 35 months, respectively. Notably, the interquartile range (IQR) for the best GPA group (3.5–4.0) ranges from 13 months to over 5 years (61 mo).
Distribution of Renal GPA scores
| Distribution of GPA scores | N (%) | MS (mo) | IQR (mo) |
|---|---|---|---|
| 0–1 | 170 (25%) | 4 | 2, 8 |
| 1.5–2 | 178 (27%) | 12 | 5, 24 |
| 2.5–3 | 204 (30%) | 17 | 8, 36 |
| 3.5–4 | 117 (17%) | 35 | 13, 61 |
| Distribution of GPA scores | N (%) | MS (mo) | IQR (mo) |
|---|---|---|---|
| 0–1 | 170 (25%) | 4 | 2, 8 |
| 1.5–2 | 178 (27%) | 12 | 5, 24 |
| 2.5–3 | 204 (30%) | 17 | 8, 36 |
| 3.5–4 | 117 (17%) | 35 | 13, 61 |
Discussion
This study confirms the substantial heterogeneity of RCC patients with BM, with the median survival of the best and worst prognostic groups being radically different at 35 versus 4 months, and even in the best group, the IQR is substantial at 13 to 61 months, implying that a small cohort of RCC BM patients experience prolonged survival, and this group, GPA 3 and 4, is not trivial, cumulatively representing 47% of this patient cohort; this is clearly a cohort where the risk of delayed cognitive deficits from WBRT must be considered seriously. In contrast, the lowest GPA group, accounting for almost a quarter of this cohort, experiences a dismal median survival of only 4 months, and in this group, supportive care and hospice should be considered.
The need for such data has been recently highlighted by the QUARTZ trial, a randomized trial of dexamethasone and supportive care versus WBRT in lung cancer patients with BM, which showed no difference in survival or quality of life.11 Even though WBRT is now used less than in the past, a trend also reflected in the treatment patterns reported here between the 2 eras (1985–2005 and 2006–2015), the QUARTZ trial raises the question of when to treat and when to refer to hospice. This and the other updated diagnosis-specific GPA indices inform that decision.12,13,16 This larger contemporary cohort has provided us the opportunity to update the Renal GPA to better distinguish prognostic subgroups of RCC patients with BM and facilitate decision making regarding aggressive treatment versus hospice.
Although we demonstrated an improvement in MS between the 2 eras, the overall gain in MS is modest (2 mo), in spite of routine use of more effective systemic therapies, even though there are subsets with markedly improved outcomes as described above. This relatively small improvement in MS is in stark contrast to the dramatic survival improvement observed in patients with breast cancer,12 non–small cell lung cancer,13,14 and melanoma15,16 with BM. Despite the modest improvement in MS, we are now able to identify the subsets that will survive 4 months (GPA 0–1.0) versus 35 months (GPA 3.5–4.0).
One crucial observation from this analysis is that the number of BM remains a rather important marker of survival; this is a phenomenon observed in lung cancer13,14 and melanoma15,16 but not in breast cancer12 or gastrointestinal cancers.7 In both our prior8 and current GPA evaluations for RCC patients with BM, we have found that patients with a larger number of BM continue to experience inferior overall survival.
This study, as expected from its retrospective nature, has limitations. The data could have inherent selection bias, and therefore they cannot be used to conclude that one treatment is superior to another. Also, the type, timing, combination, and sequence of chemotherapy and targeted therapies, both before and after the diagnosis of BM, varied widely, thus precluding the ability to assess the effect of these agents on the study patients.
In conclusion, the updated Renal GPA defined in the present study provides improved prognostic ability compared with the original Renal GPA by incorporating 4 prognostic factors identified in this larger contemporary cohort. The updated Renal GPA is a user-friendly tool that will be useful in guiding patient and family counseling, refining clinical decision making and treatment choice, interpreting retrospective series, and stratifying future clinical trials in this heterogeneous patient population. To simplify use of this index, a free user-friendly online application is available at brainmetgpa.com.
Funding
This work was supported by National Institutes of Health (NIH) grant number UL1TR000114 from the National Center for Advancing Translational Sciences (NCATS). Study data were collected and managed using REDCap electronic data capture tools hosted at the University of Minnesota. NIH grant number P30 CA77598 utilizing the Biostatistics and Bioinformatics Core shared resource of the Masonic Cancer Center, University of Minnesota and the NCATS. The design and conduct of the study; collection, management, analysis, and interpretation of the data; preparation, review, or approval of the manuscript; and decision to submit the manuscript for publication were solely the responsibility of the authors and do not necessarily represent the official views of the funders/sponsors (National Center for Research Resources or the NIH).
Acknowledgments
Database support and management: Susan Lowry, Database Programmer/Analyst and REDCap Administrator, Biostatistical Design and Analysis Center, Clinical and Translational Science Institute (CTSI), University of Minnesota, 717 Delaware St SE, Room 140-21, Minneapolis, MN 55414. All authors were involved in data entry or data analysis and/or manuscript preparation. Paul Sperduto and Ryan Shanley had full access to all the data in the study and take responsibility for the integrity of the data and the accuracy of the data analysis.
Conflict of interest statement
Reported relationships: A.A. (AstraZeneca), A.S. (Elekta, Varian, Accuray), J.P.K. (Varian), H.A.S. (Genentech), D.R. (Varian, Siemens, Accuray, BrainLab, Elekta, Pfizer, EMD Serono), M.P.M. (Agenus, Insys, Remedy, IBA, Varian, Oncoceutics, Astra-Zeneca, Monteris).


