


Abstract
Management of lung cancer patients who suffer from brain metastases represents a major challenge. Considering the promising results with immune checkpoint inhibitor treatment, evaluating the status of immune cell (IC) infiltrates in the prognosis of brain metastasis may lead to better therapeutic strategies with these agents. The aim of this study was to characterize the distribution of ICs and determine the expression of the checkpoint molecules programmed death protein 1 (PD-1) and its ligand, PD-L1, in brain metastasis of lung adenocarcinoma (LUAD) patients and to analyze their clinicopathological correlations.
We determined the presence of peritumoral mononuclear cells (mononuclear ring) and the density of intratumoral stromal mononuclear cells on brain metastasis tissue sections of 208 LUAD patients. PD-L1/PD-1 expressions were analyzed by immunohistochemistry.
Mononuclear rings were significantly associated with better survival after brain metastasis surgery. Cases with massive stromal IC infiltration also showed a tendency for better overall survival. Lower expression of PD-1 and PD-L1 was associated with better survival in patients who underwent surgery for the primary tumor and had multiple brain metastases. Steroid administration and chemotherapy appear not to influence the density of IC in brain metastasis.
This is the first study demonstrating the independent prognostic value of mononuclear rings in LUAD cases with brain metastasis. Our results also suggest that the density of tumor-associated ICs in addition to PD-L1 expression of tumor cells and ICs as well as PD-1 expression of ICs may hold relevant information for the appropriate selection of patients who might benefit from anti–PD-L1 or anti–PD-1 therapy.
Our study population consisted of the largest and most homogeneous cohort of lung adenocarcinoma patients with brain metastasectomy examined so far, in which cerebral peritumoral and intratumoral tumor infiltrating immune cells and the potential predictive markers of immunotherapy (ie, PD-1/PD-L1 expressions) were analyzed. This is the first study demonstrating that IC infiltration, especially in peritumoral location, is associated with better survival in LUAD patients with brain metastasis. Of note, steroid administration and chemotherapy appeared not to influence the density of ICs in brain metastasis. These results should be taken into account in the future, when designing predictive marker analyses in lung cancer patients with immune checkpoint inhibitor therapy. The relatively high number of patients without IC infiltrates within the brain metastasis might suggest that in those cases the combination of PD-1/PD-L1 inhibitors and other immune checkpoint (ie, cytotoxic T lymphocyte antigen 4) inhibitors could be a better choice of treatment.
Lung cancer, the leading cause of cancer death, is associated with the highest incidence of brain metastasis of all epithelial tumors.1,2 The outcomes of patients with brain metastasis are poor even with a multidisciplinary approach; therefore, development of novel, more effective therapies for preventing or stratifying patients for appropriate treatment of brain metastasis is particularly important.3
Immune checkpoint inhibitor therapy, which is based on the fact that tumors may express proteins that dampen the host immune response, is being actively developed in several malignancies, including melanoma and non–small cell lung cancer (NSCLC).4–6 Different checkpoint inhibitors vary significantly in their mechanism of action and whether they are able to recruit immune cell (IC) infiltration into the tumor or not.7 Therefore, assessing the status of IC infiltrates and their expressed targets of immune checkpoint inhibitors may provide important information for the appropriate selection of patients for this class of therapeutic agents. Tumors have been shown to be infiltrated by ICs with different density and distribution, varying across tumor types and from patient to patient.8–11 IC infiltration in primary tumors has been reported to be associated with a predominantly favorable impact on survival.8,10,12–14 The prognostic role of IC infiltration in brain metastasis, however, is less clear, since most studies investigated mixed cohorts of brain metastases of different primary tumors, and no large cohorts of brain metastasis originating from a single primary tumor type have been studied yet.15–18 In brain metastasis tissues, 3 distinct lymphocyte infiltration patterns are found: stromal, peritumoral, and diffuse, the latter most typically seen in melanomas.17 Whether any of these patterns of immune infiltrate have more of an association with tumor progression than others is not clear. Since cancer cells often evade antitumor immunity by blocking its function via expression of inhibitory proteins such as programmed cell death ligand 1 (PD-L1),19,20 the expression analysis of these proteins in brain metastasis is also highly relevant.
Recently, the immune checkpoint proteins, programmed cell death protein 1 (PD-1) and PD-L1, have emerged as important targets for immunotherapy in lung cancer besides other malignancies.4–6,21–23 In addition, the effect of anti–PD-1/PD-L1 inhibitors is currently being evaluated in clinical trials in patients with asymptomatic brain metastasis of melanoma and NSCLC.24–26 Despite promising results, proper patient selection for immunotherapy has not been fully established so far, nor have consensus criteria for testing PD-1 and/or PD-L1 as predictive biomarkers been settled.27 It is also not clear whether tumor types where PD-1 and/or PD-L1 expression is prognostic tend to benefit more from anti–PD-1/PD-L1 therapy.6,28 Such a correlation could help to design the appropriate clinical trials with immune checkpoint inhibitors. According to current data, PD-L1 expression strongly correlates with unfavorable prognosis in kidney, bladder, gastric, and pancreatic cancer, but such studies in NSCLC indicate either no or even favorable prognostic value, as was recently demonstrated in squamous cell lung cancer.14,28–31 The prognostic impact of PD-L1 on survival has been studied recently in melanoma brain metastasis, but no significant correlation was found,32 only a tendency for better survival with high PD-L1 levels.17 No association with survival was found in brain metastasis from other sites, including NSCLC.17,18,33
The effect of systemic chemotherapy or steroid treatment on the density of tumor infiltrating lymphocytes (TILs) and PD-1/PD-L1 expression in either primary tumor or brain metastasis of lung cancer is poorly understood.34 In a recent study, corticosteroids were found to affect neither the amount of ICs nor PD-L1 expression in melanoma brain metastasis.32 The effect of these treatments on brain metastasis of lung cancer is not known, although it can be of clinical relevance when designing the place of immunotherapy in lung cancer management.
Most studies on lung cancer regarding tumor infiltrating ICs and PD-1/PD-L1 expression have been performed in NSCLC as a single cohort comprising at least both adenocarcinomas and squamous cell carcinomas.14,30,35–38 Moreover, studies on brain metastasis also included metastases pooled from various sites of origin,16,17 so the well-known biological and therapeutic differences among the various histological subtypes may have a strong influence on the results. Therefore, in our present work we focused exclusively on brain metastasis cases from lung adenocarcinoma (LUAD) to create a more homogeneous cohort.
Taken together, evaluating the prognostic role of IC infiltration, PD-1 and PD-L1 expression may help to evaluate the potential role of immunological response in controlling brain metastasis of LUAD and thus provide useful information for designing the appropriate clinical trials of immune checkpoint inhibitor treatment in this disease.
Materials and Methods
Formalin-fixed paraffin-embedded brain metastasis tissue samples of 208 patients with LUAD were studied from the archive of the First Department of Pathology, Semmelweis University, Budapest. Permissions to use the archived tissue were obtained from the Regional Ethical Committee (#510/2013, #86/2015). Tumors were classified according to the International Association for the Study of Lung Cancer/American Thoracic Society/European Respiratory Society.39
The amount of mononuclear cells, including lymphocytes, histiocytes, and plasma cells associated with brain metastasis, was determined on hematoxylin and eosin stained sections by 2 independent pathologists. We investigated the presence of peritumoral mononuclear ICs (mononuclear ring) and created 2 groups: (i) present and (ii) absent. Mononuclear ring was considered present if a thick or thin layer of mononuclear cell infiltrate was detected at least focally within the brain parenchyma surrounding the metastasis. In contrast, mononuclear ring was considered absent when only very few scattered or no mononuclear cells were present around the tumor (Supplementary Figure S1). The amount of intratumoral stromal mononuclear infiltration (stromal IC) was also recorded by a semiquantitative method whereby (i) <20% or (ii) ≥20% of the tumor stroma contained ICs.40 There is no widely accepted recommendation for a clinically relevant TIL threshold for LUAD; however, in a recent study on breast cancer, >20% of stromal TILs was proven to be associated with better prognosis40; therefore, we used this cutoff in our analysis.
Immunohistochemistry for PD-L1 (dilution 1:100; SP142, Spring Bioscience) and PD-1 (dilution 1:100; ab52587, Abcam) was performed on 3-µm-thick sections of tissue microarray blocks; each case was represented by 3 cores. The amounts of positive tumor cells (TCs) and ICs were determined by a semiquantitative method as percentage of positive cells. For TC 1%, 5%, and 50%, for IC 1%, 5%, and 10% cutoff levels were recorded, which are the various thresholds used in different studies.28,41 In addition, cases were grouped into 4 categories based on the PD-L1 expression of TCs and ICs (“non-expressors,” “any-expressors,” “medium- and high-expressors,” and “high-expressors”) as described in the POPLAR study,42 in which percentage of positive TCs and percentage of tumor area containing positive ICs are encountered in combination.
Statistical Analysis
Categorical variables were compared using Pearson chi-square tests, and Pearson’s R value was used as a measure of correlation.
Survival analysis was performed on both overall survival (OS) times and survival time from brain metastasis surgery for either the whole cohort of patients or one of the subgroups described below.
For certain analyses, in order to examine clinically more homogeneous cohorts, we subdivided the patients into 4 different groups, including cases with (i) surgery of primary tumor and solitary brain metastasis (n = 51), (ii) surgery of primary tumor and multiple brain metastases (n = 25), (iii) no surgery of the primary tumor and solitary brain metastasis (n = 90), and (iv) no surgery of primary tumor and multiple brain metastases (n = 42).
Statistical tests were executed with SPSS version 20.0 (IBM) and P < .05 was considered statistically significant. Model selection was performed with the “survival” R package (for details, see Supplementary File 1).
Results
Patients’ Characteristics
Brain metastases from 208 LUAD patients were selected for this study. One hundred forty-one patients had solitary brain metastasis, including 29 infratentorial and 112 supratentorial lesions, and 67 patients had multiple brain metastases (Table 1). All patients underwent neurosurgical resection. For patients with multiple brain metastases, symptomatic lesions were resected for palliative reasons. In 142 cases, postoperative cerebral radiotherapy was applied. The clinical data including the stage at the time of lung cancer diagnosis and management of the primary tumor are summarized in Table 1.
Clinical characteristics of lung adenocarcinoma patients with brain metastasis included in this study
| Characteristic | Patients (N = 208) | |
|---|---|---|
| No. | % | |
| Age, y | ||
| Mean (±SD) | 59.28 (±8.96) | |
| Range | 25–79 | |
| Sex | ||
| Male | 104 | 50 |
| Female | 104 | 50 |
| Clinical stage at time of lung cancer diagnosis | ||
| IA | 6 | 2.9 |
| IB | 24 | 11.5 |
| IIA | 12 | 5.8 |
| IIB | 8 | 3.8 |
| IIIA | 26 | 12.5 |
| IIIB | 15 | 7.2 |
| IV (brain) | 110 | 52.9 |
| Unknown | 7 | 3.4 |
| Location of brain metastasis | ||
| Solitary | 141 | 67.8 |
| Supratentorial | 112 | 79.4 |
| Infratentorial | 29 | 20.6 |
| Multiple | 67 | 32.2 |
| Management of primary tumor | ||
| Surgical resection (±chemotherapy) | 76 | 36.5 |
| Chemotherapy | 95 | 45.7 |
| Best supportive care | 37 | 17.8 |
| Steroid treatment before brain surgery (≤1 mo) | ||
| Yes | 137 | 65.9 |
| No | 52 | 25 |
| Unknown | 19 | 9.1 |
| Chemotherapy before brain surgery | ||
| Yes | 75 | 36.1 |
| No | 132 | 63.4 |
| Unknown | 1 | 0.5 |
| Cerebral irradiation | ||
| Whole brain radiotherapy | 82 | 57.7 |
| Radiosurgery | 25 | 17.6 |
| Both | 35 | 24.6 |
Intratumoral Stromal and Peritumoral Inflammatory Cells
Of the cases, 68.7% had <20% and 31.3% had ≥20% intratumoral stromal ICs; 55.7% of cases presented with peritumoral mononuclear ring and 44.3% without. Taken together, 38% of the cases had no mononuclear ring and displayed very few or no stromal ICs.
Correlation of the Amount of Mononuclear Cells and PD-L1/PD-1 Expression
Patients divided into different groups using different thresholds of protein expressions were analyzed for the amount of stromal IC and the presence of mononuclear ring (Table 2).
Correlation between the amount of mononuclear cells associated with brain metastasis of lung adenocarcinoma and PD-L1 and PD-1 expression
| Patient groups Based on Percentage of Positive Cells | Stromal Immune Cells (<20% vs >20%) | Mononuclear Ring (not present vs present) | |||
|---|---|---|---|---|---|
| P-value | Pearson’s R | P-value | Pearson’s R | ||
| PD-L1 tumor cells | <1% vs ≥1% | .021 | 0.180 | ns | — |
| <5% vs ≥5% | .028 | 0.172 | ns | — | |
| <50% vs ≥50% | .009 | 0.203 | ns | — | |
| PD-L1 immune cells | <1% vs ≥1% | <.001 | 0.315 | .011 | 0.212 |
| <5% vs ≥5% | <.001 | 0.341 | <.001 | 0.323 | |
| <10% vs ≥10% | .013 | 0.196 | .006 | 0.231 | |
| PD-1 immune cells | <1% vs ≥1% | .004 | 0.226 | .003 | 0.242 |
| <5% vs ≥5% | ns | — | ns | — | |
| <10% vs ≥10% | ns | — | .044 | 0.166 | |
| Groups used in the POPLAR study | |||||
| PD-L1 tumor cells or immune cells | Non-expressors vs any-expressors | <.001 | 0.302 | .026 | 0.185 |
| Lower-expressors vs high/medium-expressors | <.001 | 0.338 | .001 | 0.275 | |
| Lower-expressors vs high-expressors | <.001 | 0.361 | <.001 | 0.292 | |
There was a positive correlation between the amount of stromal ICs and the presence of mononuclear ring (P = .001; chi-square, Pearson’s R = 0.324).
Sparse stromal ICs in a brain metastasis sample correlated with low levels of PD-L1 positivity of TCs at any cutoff level (P = .021, .028 and .009 and Pearson’s R = 0.180, 0.172, and 0.203 at 1%, 5%, and 50% cutoff, respectively) (Table 2).
Regarding PD-L1 positivity of ICs, ≥20% stromal ICs correlated with higher levels of PD-L1 positive ICs for every cutoff level (P < .001, P < .001, and P = .013 with Pearson’s R = 0.315, 0.341, and 0.196 at 1%, 5%, and 10% cutoff, respectively). In addition, the presence of mononuclear ring correlated with more PD-L1+ ICs at every cutoff level as well (P = .011, P < .001, and P = .006 with Pearson’s R = 0.212, 0.323, and 0.231, respectively) (Table 2).
More than 1% PD-1+ ICs showed significant correlation with ≥20% of stromal ICs (P = .004, Pearson’s R = 0.226) and the presence of mononuclear ring (P = .003, Pearson’s R = 0.242) (Table 2).
Regarding the groups used in the POPLAR study, “higher PD-L1 expressors” were associated with the presence of mononuclear ring and ≥20% stromal ICs of brain metastases compared with “lower PD-L1 expressors” (or “non-expressors”) (Table 2).
Interestingly, positive correlations were found between the amount of PD-1+ ICs and PD-L1+ TCs and ICs using any cutoff levels, except for 10% cutoff for PD-1+ ICs and 1% cutoff for PD-L1+ ICs (Table 3). Moreover, “higher PD-L1 expressors” according to the POPLAR study were associated with more PD-1+ ICs at any cutoff level (Table 3).
Correlation between PD-L1 and PD-1 expression in brain metastasis of lung adenocarcinoma
| Percentage of Positive Cells | PD-1 Immune Cells | ||||||
|---|---|---|---|---|---|---|---|
| <1% vs ≥1% | <5% vs ≥5% | <10% vs ≥10% | |||||
| P-value | Pearson’s R | P-value | Pearson’s R | P-value | Pearson’s R | ||
| PD-L1 tumor cells | <1% vs ≥1% | .024 | 0.179 | <.001 | 0.300 | <.001 | 0.276 |
| <5% vs ≥5% | .040 | 0.163 | <.001 | 0.314 | <.001 | 0.282 | |
| <50% vs ≥50% | .023 | 0.179 | <.001 | 0.291 | <.001 | 0.311 | |
| PD-L1 immune cells | <1% vs ≥1% | <.001 | 0.367 | .005 | 0.224 | ns | — |
| <5% vs ≥5% | <.001 | 0.398 | .001 | 0.258 | .037 | 0.167 | |
| <10% vs ≥10% | <.001 | 0.308 | <.001 | 0.285 | .011 | 0.203 | |
| Groups used in the POPLAR study | |||||||
| PD-L1 tumor cells or immune cells | Non-expressors vs any-expressors | <.001 | 0.343 | .002 | 0.248 | .008 | 0.210 |
| Lower-expressors vs high/ medium- expressors | <.001 | 0.404 | <.001 | 0.285 | <.001 | 0.279 | |
| Lower-expressors vs high-expressors | <.001 | 0.355 | .006 | 0.218 | .001 | 0.269 | |
Correlation of Mononuclear Ring or Stromal ICs and Clinical Characteristics
Importantly, the proportion of patients with abundant stromal ICs or mononuclear ring was similar with or without receiving chemotherapy or steroid before brain metastasis surgery (P = .997 and P = .452; P = .186 and P = .879, respectively; chi-square).
Correlation of the Expression of PD-L1 and PD-1 and Clinical Characteristics
Steroid administration significantly correlated with less PD-L1 expression of ICs at 10% cutoff value compared with patients without steroid use (P = .021; chi-square, Pearson’s R = 0.208); however, no correlation was revealed with PD-L1 expression of TCs and PD-1 expression. No difference was detected in PD-L1 or PD-1 expression comparing patients having received chemotherapy or not before brain metastasis surgery (data not shown).
Correlation of Clinical Characteristics with Survival
Kaplan–Meier survival curves of different variable values were tested for significant differences with log-rank tests. Following the general steps of model selection described in Supplementary File 1, the final set of variables included in the Cox proportional hazards model of the whole cohort for OS and survival from brain metastasis surgery prediction are listed in Table 4. Both results of univariate analyses and the final multivariate models are presented below.
Multivariate proportional hazards Cox models for OS and survival from brain surgery in the investigated patient groups
| Variable | P | HR | CI |
|---|---|---|---|
| Whole cohort, OS | |||
| Later stages | .282 | 1.675 | 0.655–4.284 |
| Surgery | .004 | 0.318 | 0.145–0.701 |
| Lack of chemotherapy | <.001 | 3.139 | 1.715–5.745 |
| Age <60 y | .032 | 0.554 | 0.323–0.949 |
| Solitary metastasis | .174 | 0.796 | 0.573–1.106 |
| Lack of MR | .089 | 1.635 | 0.928–2.881 |
| No expressor (POPLAR) | .546 | 0.816 | 0.421–1.581 |
| PD-1 immune cells >1% | .840 | 0.930 | 0.456–1.893 |
| Supratentorial localization | .440 | 1.267 | 0.695–2.313 |
| Whole cohort, survival from brain surgery | |||
| Later stages | .161 | 1.595 | 0.831–3.062 |
| Lack of chemotherapy | .224 | 1.430 | 0.804–2.543 |
| Solitary metastasis | .010 | 0.656 | 0.476–0.905 |
| Lack of MR | .050 | 1.731 | 0.578–2.994 |
| Medium- and high-expressor (POPLAR) | .102 | 1.604 | 0.910–2.825 |
| PD-1 immune cells >5% | .840 | 0.941 | 0.524–1.691 |
| PD-L1 tumor cells >50% | .090 | 0.562 | 0.288–1.095 |
| Supratentorial localization | .357 | 0.739 | 0.388–1.407 |
| Subgroup 1, OS | |||
| Later stages | .375 | 1.634 | 0.552–4.837 |
| Lack of chemotherapy | .999 | 2.717 | 0.829–8.901 |
| Lack of MR | .027 | 3.054 | 1.137–8.202 |
| No expressor (POPLAR) | .731 | 0.829 | 0.285–2.414 |
| PD-1 immune cells >1% | .526 | 0.722 | 0.264–1.974 |
Early clinical stages (I–II) at the diagnosis of LUAD, surgical resection of the primary tumor, and chemotherapy showed a significant association with better OS with the univariate log-rank test (P < .001, P < .001, P = .027, respectively). Multivariate Cox regression analysis identified both surgery and the lack of chemotherapy as independent prognostic factors (P = .004, hazard ratio [HR] = 0.318, CI = 0.145–0.701; P < .001, HR = 3.139, CI = 1.715–5.745, respectively). These parameters did not significantly correlate with survival after brain surgery by log-rank test (P = .064, P = .063, P = .151, respectively), and Cox regression analysis only revealed a tendency toward worse survival from brain surgery for patients in advanced clinical stages (Table 4).
Patients with solitary brain metastasis showed better survival after brain metastasis surgery compared with patients with multiple brain metastases (P = .012; log-rank), which remained significant with multivariate Cox regression analysis (P = .010, HR = 0.656, CI = 0.476–0.905). Regarding OS, however, no significant difference was observed (P = .095; log-rank; and P = .174, HR = 0.796, CI = 0.573–1.106; Cox).
Patients also showed better OS and survival after brain metastasis surgery in cases of supratentorial solitary metastasis compared with infratentorial solitary metastasis (P = .012 and .001, respectively; log-rank). With multivariate Cox regression analysis, however, the location of the brain metastasis did not appear to be an independent prognostic factor.
Younger patients (≤60 y) showed better OS and survival after brain metastasis surgery (P = .029 and P = .019, respectively; log-rank). In the case of OS, age remained significant with Cox analysis (P = .032, HR = 0.554, CI = 0.323–0.949). Gender had no influence on OS or survival after brain metastasis surgery (data not shown).
Correlation of the Amount of Mononuclear Cells with Survival
The lack of peritumoral mononuclear ring was associated with worse survival after brain metastasis surgery (P = .01; log-rank) (Fig. 1), and a borderline significant tendency toward worse survival remained with multivariate Cox regression analysis (P = .050, HR = 1.731, CI = 0.578–2.994). Cases with ≥20% of stromal ICs only showed a tendency for better OS (P = .066; log-rank).
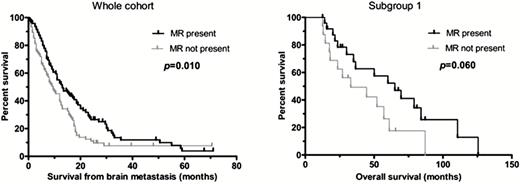
Kaplan–Meier analysis. The presence of mononuclear ring (MR) around the brain metastasis of lung adenocarcinoma is associated with better survival after brain metastasis surgery. The presence of MR is also associated with a tendency for better OS in patients with solitary brain metastasis who underwent primary tumor resection (subgroup 1).
Due to the strong influence of surgical resection of the primary tumor, chemotherapy, and multiplicity of brain metastasis on survival, we also performed multivariate Cox regression analysis on the clinically more homogeneous 4 subgroups described in the Materials and Methods section. In subgroup 1 variables POPLAR “no versus any expressor” category, PD-1 IC “<1% versus ≥1%” category, presence of MR, stage category, and chemotherapy were included in the Cox analysis for OS (Table 4). The lack of mononuclear rings correlated with worse OS with a multivariate model (P = .027, HR = 3.054, CI = 1.137–8.202), while Kaplan–Meier analysis only showed a tendency for better OS (P = .060) (Fig. 1). No significant association was found in the other subgroups.
Correlation of PD-L1 and PD-1 Expression with Survival
No correlation was observed by log-rank test between PD-L1 expression of TCs or ICs, and PD-1 expression of ICs at any cutoff level and OS or survival after brain metastasis surgery (data not shown). Similarly, no correlation was detected with OS or survival after brain metastasis surgery in the groups used in the POPLAR study, and the results remained nonsignificant with multivariate Cox regression analysis (data not shown).
Performing our analysis separately on the previously described subgroups, we found the following correlations for patients who underwent removal of the primary tumor and had multiple brain metastases (subgroup 2). Less than 10% PD-1 expression of ICs was associated with a tendency toward better OS with Kaplan–Meier analysis (P = .055) (Supplementary Figure S2); however, the variable did not meet the proportional hazards assumption criteria. In addition, lower PD-L1 expression of TCs at any cutoff level in subgroup 2 was associated with better survival after brain surgery, but Kaplan–Meier analyses revealed significantly better post brain metastasis surgery survival only by using a 1% cutoff level (P = .023) (Supplementary Figure S2). The analysis of different PD-L1 expressor groups used in the POPLAR study showed better survival after brain metastasis surgery in the “non-expressors” compared with the “any-expressors” (P = .008; log-rank) (Fig. 2). Kaplan–Meier analyses also showed better OS in the “lower-expressors” compared with the “high-expressors” (P = .046) (Fig. 2).
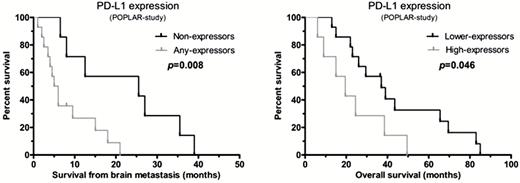
Kaplan–Meier analysis of the different PD-L1 expressor groups used in the POPLAR study. Among patients who underwent primary tumor resection and had multiple brain metastases (subgroup 2), “non-expressors” showed better survival after brain metastasis surgery compared with the “any-expressors”; and “lower-expressors” showed better OS compared with the “high-expressors.”
Discussion
In this study we presented a comprehensive analysis of immune cell infiltration, PD-1 expression of immune cells, and PD-L1 expression of tumor cells and immune cells and their clinical relevance on a large cohort of lung adenocarcinoma patients with brain metastases. The importance of analyzing LUAD and squamous cell carcinoma separately in this context is emphasized by results that showed that PD-L1 expression has a significant effect on survival limited to the adenocarcinoma only, which was not present in squamous cell carcinoma.43
This is the first study demonstrating that mononuclear cell infiltration, especially in peritumoral location, is associated with better survival in LUAD brain metastasis, therefore reactivation of the immune response by immune checkpoint inhibitors will likely add further clinical benefit. We also showed, however, that a significant portion of LUAD brain metastasis is without IC infiltrates, suggesting that a significant number of patients lack any significant local immune response in association with their brain metastasis. While several prior publications on brain metastasis of mixed primary origin reported a higher proportion of brain metastasis with ICs present, our results suggest that this question should be reevaluated on more homogeneous cohorts. Agents acting on the PD-L1/PD-1 axis will be unlikely to recruit immune cells into the metastases7 and thus will probably not provide clinical benefit, while other agents, such as cytotoxic T lymphocyte antigen (CTLA-4) inhibitors, increase T-cell recruitment into tumors. Therefore, the relatively high number of cases without IC infiltrates into brain metastasis of LUAD may suggest that combination of PD-L1 and CTLA-4 inhibitors may be a better choice of treatment.
Even if TILs are present in primary tumors or brain metastases, immune checkpoint pathways are regularly targeted by tumors to escape immune-mediated destruction, therefore the mere presence of TILs may not always be sufficient to ensure better survival.23 Since tumor cells often inactivate immune cells by activation of the PD-1 pathway, we decided to evaluate the prognostic value of PD-1 and PD-L1 expression in brain metastasis of LUAD patients. It is generally accepted that in tumors where the PD-1 activation dampens the otherwise potentially active antitumor immune response, and therefore portends worse prognosis, anti–PD-1/PD-L1 therapy might be rather effective by reactivating the already present therapeutic response. In light of this, it is important to point out that PD-1 or PD-L1 expression had no prognostic power in the entire cohort, therefore anti–PD-1/PD-L1 therapy alone may have limited clinical value in brain metastasis LUAD patients in general. Considering the significant impact of removal of the primary tumor and solitary versus multiple brain metastasis on survival, we subdivided the patients into 4 different groups based on these criteria and reanalyzed the prognostic value of PD-1/PD-L1 expression in those subcohorts separately as well. In subgroup 2, where the primary tumor was removed and the patients had multiple brain metastases, low expression of PD-1 and PD-L1 was associated with significantly better survival. This suggests that in these cases, activating the PD-1/PD-L1 axis may actively suppress antitumor immune suppression, therefore these cases may benefit the most from treatments containing checkpoint inhibitors targeting this regulatory pathway.
A positive correlation could be demonstrated between the amount of stromal ICs and the presence of mononuclear ring, which suggests a potentially similar mechanism for attracting ICs to different areas of brain metastasis.
We also found positive correlations between the amount of PD-1+ ICs and PD-L1+ TCs and ICs, arguing for a dynamic communication among tumor cells and immune cells and supporting the concept that exhausted PD-1 expressing T cells would induce PD-L1 expression in the microenvironment.44
Considering the increasing importance of immune response in cancer therapy, it is important to clarify the impact of steroid and chemotherapy treatment on the status of the ICs in brain metastasis. Steroid administration before brain metastasis surgery had no significant influence either on stromal immune cell infiltration or on peritumoral mononuclear rings in our LUAD cases, which is concordant with earlier findings on cohorts with mixed histology,15–17,32 indicating that steroids have no major effect on IC recruitment. Likewise, chemotherapy prior to brain metastasis surgery appears not to affect IC recruitment. In recent studies steroid was found to have no influence on PD-L1 expression in brain metastasis associated with various types of primary tumors.17,32 In our cohort, steroid administration before brain metastasis surgery significantly correlated with less PD-L1 expression of ICs at 10% cutoff, suggesting that steroid may have some impact on PD-L1 expression of ICs in brain metastasis LUAD; however, it did not affect PD-L1 expression of TCs and PD-1 expression of ICs. The effect of chemotherapy on PD-1/PD-L1 has been investigated in vitro with contrary results depending on the agent and cell type used.45–47 Interestingly, our brain metastasis cases with or without prior chemotherapy showed similar PD-L1 and PD-1 expressions, suggesting that systemic chemotherapy may not lead to PD-L1/PD-1 expression change in LUAD brain metastasis.
We have analyzed our data with the scoring system suggested by the POPLAR study,42 because their PD-L1 biomarker selection measuring the protein on both TC and IC could be biologically more relevant. In our LUAD brain metastasis cohort, 26.4% of the cases were “non-expressors” (see Supplementary File 2), in which neither TCs nor ICs expressed PD-L1. According to the results of the POPLAR study, these patients are unlikely to benefit from anti–PD-L1 therapy. In contrast, 41.7% of our cases were “high-expressors,” who probably could benefit from anti–PD-L1 therapy. According to our findings, “higher PD-L1 expressors” showed significant association with the presence of mononuclear ring and ≥20% stromal ICs compared with the remaining “lower-” or “non-expressors.” In addition, “higher PD-L1 expressors” were characterized by more PD-1+ ICs. No association was found with OS or survival after brain metastasis surgery in the different PD-L1 expressor groups in the whole cohort; however, better survival after brain metastasis surgery was seen in the “non-expressors” compared with the “any-expressors” in subgroup 2. Moreover, Kaplan–Meier analyses also showed better OS in the “lower-expressors” compared with the “high-expressors” in subgroup 2.
In summary, this is the first study demonstrating the independent prognostic value of peritumoral mononuclear cells in LUAD brain metastasis cases. Besides, massive stromal ICs in brain metastasis also showed a strong tendency for favorable prognosis. Steroid may have some impact on reducing PD-L1 expression of ICs without affecting their recruitment. Chemotherapy appears not to disturb either the density of ICs or PD-1/PD-L1 expression in LUAD brain metastasis.
Our findings in the largest cohort of LUAD brain metastasis cases indicate a significant impact of the host immune system on controlling brain metastasis, thus modern immunotherapies could support the ICs in tumor destruction in a subset of patients. However, appropriate patient selection, especially in LUAD cases, for a potentially successful immunotherapy is still debated; moreover, consensus criteria for testing PD-1 and/or PD-L1 as predictive biomarkers have yet to be settled.
Supplementary Material
Supplementary data are available at Neuro-Oncology online.
Funding
This work was supported by the Research and Technology Innovation Fund (KTIA_NAP_13-2014-0021 to L.R., L.V., Z.S., SNN114490 to B.D.); Hungarian Science Foundation (OTKA-PD115792 to L.R., OTKA-K116151 to L.R., J.T., L.V., B.D., OTKA-K112371 to J.T., OTKA-K109626 to B.D., OTKA-K108465 to B.D.); Semmelweis University Start-Up grant (40148-11658 to B.D.), and the Vienna Fund for Innovative Interdisciplinary Cancer Research (to B.D.); Breast Cancer Research Foundation and the Novo Nordisk Foundation Interdisciplinary Synergy Programme Grant (NNF15OC0016584 to Z.S.). C.S. is a senior Cancer Research UK clinical research fellow. Support also came from the Francis Crick Institute, which receives its core funding from Cancer Research UK (FC001169), the UK Medical Research Council (FC001169), and the Wellcome Trust (FC001169); by the UK Medical Research Council (grant reference MR/FC001169/1); C.S. is funded by Cancer Research UK (TRACERx), the CRUK Lung Cancer Centre of Excellence, Stand Up 2 Cancer (SU2C), the Rosetrees Trust, Novo Nordisk Foundation (ID16584), EU-FP7 (projects PREDICT and RESPONSIFY, ID:259303), the Prostate Cancer Foundation, the Breast Cancer Research Foundation, the European Research Council (THESEUS). Support was provided to C.S. by the National Institute for Health Research, the University College London Hospitals Biomedical Research Centre, and the Cancer Research UK University College London Experimental Cancer Medicine Centre.
Conflict of interest statement. None declared.
Acknowledgment
We thank Anna Tamási, Mónika Szilágyiné Paulusz, and Zsuzsanna Kaminszky for excellent technical assistance.
References
Author notes
Corresponding Author: Judit Moldvay MD, PhD, National Koranyi Institute of Pulmonology, Budapest, Piheno u. 1. H-1121 Hungary ([email protected]).
* These authors contributed equally.


