


Abstract
Glioblastomas (GBMs) are a heterogeneous group of primary brain tumors. These tumors are resistant to therapeutic interventions and invariably recur after surgical resection. The multifunctional protein transglutaminase 2 (TG2) has been shown to promote cell survival in a number of different tumors. There is also evidence that TG2 may be a pro-survival factor in GBMs. However, the roles that TG2 plays in facilitating GBM survival and proliferation have not yet been clearly delineated .
The functions of TG2 are often cell- and context-specific. Therefore, in this study we examined the ability of TG2 to facilitate GBM proliferation using colony formation assays and 5-ethynyl-2ʹ-deoxyuridine (EdU) incorporation in several different GBM cell lines as well as neurospheres derived from patient tumors representing the 3 major subtypes of GBM tumors (mesenchymal, proneural, and classical) and maintained in the absence of serum. TG2 knockdown or selective TG2 inhibitors were used to modulate TG2 expression and activity.
We show that TG2 plays differential roles in the proliferative process depending on the cell type. In most, but not all, GBM models TG2 plays a crucial role in the proliferative process, and some but not all TG2 inhibitors were highly effective at reducing proliferation in a large subset of the GBM models.
Our results show that TG2 plays an important–but notoriously context-specific–role in GBM cell biology. Nonetheless, as future studies unravel the genetic “fingerprints” that make TG2 inhibitors effective, this information could be exploited to develop TG2 inhibitors into personalized GBM therapies.
Gliomas are intrinsic tumors of the central nervous system and are classified by the type of cell from which they arise as well as their potential for growth and spread. Astrocytomas develop from astrocytes. Grade IV astrocytomas, often referred to as glioblastomas (GBMs), are the most common and aggressive type of primary brain tumor.1-3 Almost all GBM tumors invariably recur following resection since there is no effective therapy for preventing relapse; the median survival time for patients with GBM is approximately 12–14 months.4
Three different subtypes of GBM have been defined.5 Increased expression or abnormality in epidermal growth factor receptor (EGFR), platelet-derived growth factor receptor/isocitrate dehydrogenase I (PDGFR/IDH1), and neurofibromatosis type 1 (NF1) are associated with the classical, proneural, and mesenchymal subtypes, respectively.5,6 A neural subtype, characterized by high expression of neuronal markers (eg, NEFL, GABRA1, SYT1, and SLC12A5), has also been described.7 Given the distinct differences in gene expression signatures between the subtypes, it is not surprising that differences have been observed in the efficacy of intensive treatment among the GBM subtypes.7 These and other findings clearly indicate that the different tumor subtypes will likely require distinct treatment strategies; therefore, it is crucially important to characterize tumors in terms of subtypes.5,7
Serum-cultured GBM cell lines have been extensively used as model systems in GBM research. However, some data indicate that these serum-cultured GBM cells have very different gene expression profiles compared with the tumors from which they were derived.8 In order to increase the relevance of cell models, some groups have proposed that culturing GBM cells as spheroid (neurospheres) in defined medium may provide a better model system.8 Although other reports suggest that serum-fed GBM cell monolayers are as good a model as neurospheres, 9,10 it would be prudent to use both model systems in parallel.
Transglutaminase 2 (TG2) is a multifunctional protein. The 2 primary activities of TG2 are catalyzing calcium-dependent transamidation reactions and binding and hydrolyzing guanosine-5ʹ-triphosphate (GTP).11 In the calcium-bound state, TG2 is a highly extended molecule; however, GTP-bound TG2 exists in a compact and closed state. The closed state decreases accessibility of the active site; thus, GTP binding inhibits the transamidation activity.12-14 Therefore, calcium binding and GTP binding inversely regulate the transamidation activity and the conformational state of the protein. TG2 also has significant nonenzymatic functions because it can function as a scaffold or linker to mediate protein-to-protein interactions.11,15
There is growing awareness that TG2 likely plays a significant role in tumor cell biology, including gliomas.3,15–17 For example, a 2-fold increase in TG2 expression in gliomas is associated with a decrease in survival time, while a 2-fold decrease in TG2 expression is associated with an increase in length of survival.18,19 TG2 is expressed at high levels in CD44-high GBMs and glioma-initiating cell lines derived from these tumors. Pharmacological inhibition of TG2 reduced ID1 expression and increased cell death of CD44(+) glioma stem cells.20 Additionally, 2 different TG2 inhibitors (monodansylcadaverine [MDC], a nonspecific alternative substrate, and Z-DON, an active site-directed inhibitor) reduced proliferation in 2 out of 3 GBM cell lines tested.19 It was suggested that the inhibition of proliferation was due to the effect of the inhibitors on TG2 conformation and thus its interactions with other proteins.19 Therefore, the effect of inhibitors on TG2 conformation, as well as on transamidating activity, is an important variable that needs to be taken into consideration. Nonetheless, the mechanisms by which TG2 affects GBM cell proliferation is still an open question. More importantly, whether the role played by TG2 is common among different subtypes or is subtype-specific needs to be determined.
In this study, we show that TG2 indeed plays a crucial role in most–but not all–GBM models. Also, most–but not all–TG2 inhibitors were highly effective for reducing proliferation in a subset of the GBM models. Overall, although TG2 likely plays a crucial role in promoting proliferation in a subset of GBM tumors, further studies are required to elucidate relevant biomarkers to identify the tumors that would be responsive to TG2-inhibitor therapies.
Materials and Methods
Monolayer Cell Cultures
For these studies, U87, U251, 1321N, T98G, and C6 cells were cultured using standard protocols as well as the human neuroblastoma SH-SY5Y cells stably expressing R580A.21-23 Mouse primary astrocytes were prepared and maintained as described previously24 and as approved by the University of Rochester Committee on Animal Resources.
Immunoblotting
Blots were probed with one of the following antibodies: EGFR, phospho-EGFR, or phospho-P65 rabbit monoclonal antibodies from Cell Signaling Technology, TG2 mouse monoclonal antibody (CUB7402) from Life Technologies, or P65 rabbit polyclonal antibody from Santa Cruz Biotechnology.
Lentiviral Vectors
Lentiviral knockdown vectors were prepared and used as previously described.23,25
Agarose Colony Formation Assay
The agarose colony formation assay was carried out as described26 using 6-well plates and 5,000 cells in each well.
5-ethylnyl-2ʹ-deoxyuridine (EdU) Incorporation Assay
After treatment, cells were incubated with 10 μM EdU in 10% fetal bovine serum for 90 minutes and then fixed and permeabilized. Detection of EdU was performed as directed in the Click-iT EdU Alexa 647 kit (Life Technologies). Nuclei were stained with Hoechst.
Neurosphere Cultures and Treatments
TS543, TS565, and TS676, representing the mesenchymal, proneural, and classical glioblastoma subtypes, respectively, were obtained from Dr. C. Brennan5,27,28 and were maintained in NeuroCult NS-A Proliferation Kit (Human) (Stem Cell Technologies) according to the manufacturer’s instructions. Neurospheres were subsequently treated with 25 µM TG2 inhibitor or dimethylsulfoxide( DMSO) control for 2 weeks prior to measurement of the number and size of the spheres.
Native Polyacrylamide Gel Electrophoresis (PAGE)
Native gel electrophoresis experiments were performed using a method similar to those described previously.12,14
BODIPY FL GTP-γ-S Binding Assay
GTP binding was measured using a similar method as reported previously.29
Quantitative Reverse Transcription PCR (Q-RTPCR)
After RNA isolation, cDNA was synthesized using the verso cDNA kit (ThermoFisher) with oligo-dT primers following the manufacturer’s instructions. Q-RTPCR was carried out using SYBR green mix (Agilent Technologies).
In Situ and in Vitro Transglutaminase Assays
In situ and in vitro transamidating activities were measured as described previously.23,30
Hypoxia Response Element Luciferase Reporter Assay
U87 and T98G cells were transfected with hypoxia response element (HRE) firefly luciferase and TK renilla. Cells were then incubated overnight in normoxic or hypoxic (0.1% O2) conditions in the presence or absence of the inhibitors. Cells were harvested, and luciferase activity was measured.
Methodological details are provided in the supplementary material.
Results
TG2 Is Differentially Expressed
To initiate our studies, we used 4 astrocytoma cell lines (1321N, U87, U251, and T98G); except for 1321N, these cells have all been used for GBM cell models. TG2 expression varied considerably in these cell lines (Fig. 1A). TG2 was not detectable in 1321N cells, whereas U87 cells expressed extremely high levels of TG2 (Fig. 1A). U251 and T98G cells expressed relatively moderate levels of TG2 (Fig. 1A); however, these expression levels were higher than that of untransformed astrocytes (Fig. S1). TG2 messenger RNA (mRNA) levels (Fig. 1B) and in situ transamidating activities (Fig. 1C) in these cell lines correlated well with TG2 protein levels.
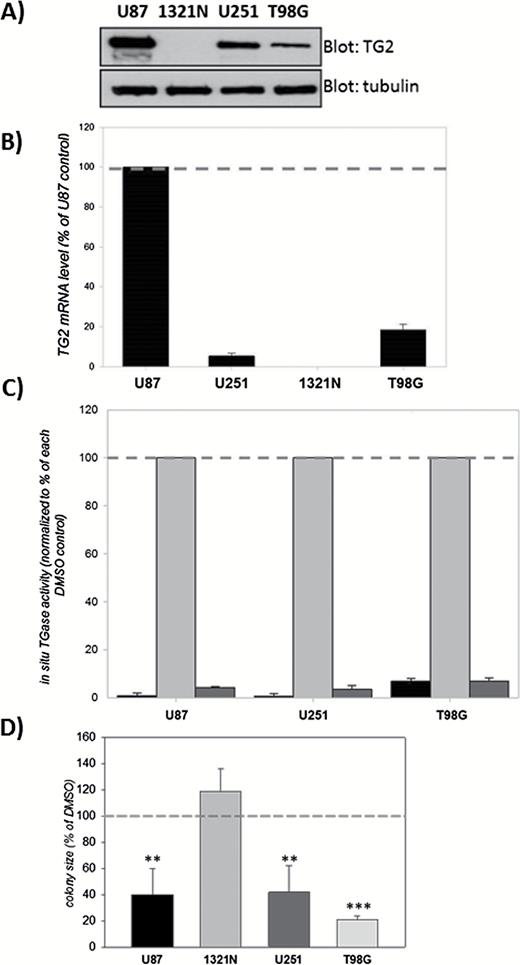
Effects of the TG2 inhibitor NC9 on colony formation by glioblastoma (GBM) cells.
(A) TG2 expression levels vary among GBM cell lines. Lysates (20 µg) from U87, 1321N, U251, and T98G cells were blotted for TG2 and tubulin. (B) TG2 mRNA levels correlate with TG2 protein levels. Results are normalized to actin mRNA and shown as a percent of U87 (±SEM) (N=3). (C) In situ transamidating activity correlates with TG2 protein levels. Cells were pretreated with NC9 for 1 hour followed by 1 µM ionomycin treatment for 3 hours in the presence of 10 µM NC9. Dimethylsulfoxide (DMSO) was used as control. Results are shown as a percent of ionomycin-induced transglutaminase activity for each cell line (±SEM) (N=3) BAP, biotinylated polyamine. For each cell line the first bar is BAP alone, the second bar is BAP + ionomycin and the third bar is BAP + ionomycin + NC9. (D) NC9 significantly reduces the average colony size of the TG2-expressing glioblastoma cells. Results are shown as a percent of DMSO control (±SEM) (N=3). Statistical significance compared with control was tested using Dunnett’s test; *P<0.05, **P<0.01, ***P<0.005.
The complete lack of TG2 in 1321N cells was unexpected, given that TG2 is detectable in almost all cell types.11 Although it is possible that the expression of TG2 can be regulated epigenetically through methylation,18 complete epigenetic silencing has not been reported to the best of our knowledge. Nonetheless, we wanted to determine if methylation of the TG2 gene could be responsible for the lack of TG2 in 1321N cells; therefore, we used a methylation inhibitor (5’-azacytidine). Treatment with 5’-azacytidine increased TG2 expression in U251 and T98G cells but not in 1321N cells (Fig. S2). This suggests that TG2 is not silenced through DNA methylation in 1321N cells, and the reason why there is no expression remains unknown. However, this TG2-negative cell line proved to be useful as it provided important insights about the TG2-dependence of our treatment paradigms.
The Inhibitory Effects of NC9 on Colony Formation Are TG2-dependent
NC9 is an effective, irreversible TG inhibitor that locks TG2 in its open conformation.31,32 Ten micromolar NC9 completely inhibits the in situ transamidation activity of TG2 induced by ionomycin-mediated calcium influx (Fig. 1C).
The colony-formation assay was used to determine the effect of TG2 inhibition on the growth of GBM cells. NC9 treatment (10 µM) significantly reduced the growth of U87, U251, and T98G colonies but not 1321N (Fig. 1D and Fig. S3). The fact that NC9 had no effect on the growth of TG2-null 1321N colonies strongly suggests that the reduction in colony growth was not due to a general NC9 toxicity but rather due to its effect on TG2. Nonetheless, although TG2 expression was necessary for NC9 to inhibit colony growth, the expression level was not a direct determinant.
To fully understand the role of TG2 in GBM biology, we knocked down TG2 in the GBM cell lines using a lentiviral TG2 short hairpin RNA (shRNA)22 (Fig. 2A). Transduced cells and colonies were visualized by fluorescence microscopy as the lentiviral vector carrying the shRNA or scrambledRNA (scrRNA) constructs also expressed green fluorescent protein (GFP) (Fig. 2C).
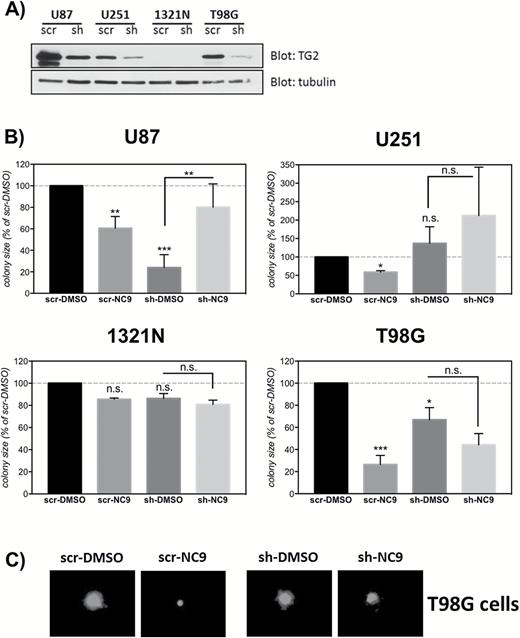
The suppressive effect of NC9 on the colony formation capacity of glioblastoma (GBM) cells is TG2-dependent.
(A) Knockdown of TG2 using shRNA. GBM cell lines were transduced with a shRNA construct for TG2 (sh) or a scrambled RNA control (scr). Six to 8 days later, the cells were collected, and 10 µg of lysates were blotted for TG2 and tubulin. (B) Silencing TG2 expression decreases colony growth in some cell lines, and NC9 loses its suppressive effect on colony growth when TG2 expression is silenced. Cells were transduced with sh or scr lentiviruses expressing GFP, and 6–8 days later cells were seeded in agarose and treated with 10 µM NC9 for 2 weeks. DMSO was used as control. Colonies were visualized using fluorescent microscopy for GFP (ex: 490nm, em: 520nm). For each experiment, the NC9 group was normalized to DMSO control. Results are shown as a percent of DMSO control (±SEM) (N=3). (C) Representative images showing the effect of TG2 knockdown and/or NC9 treatment in T98G cells. Statistical significance compared with control was tested using Dunnett’s test; *P<0.05, **P<0.01, ***P<0.005 not significant.
The colony-formation assay was carried out using shRNA- or scrRNA-transduced cells. As expected, there was no difference between any treatment groups in 1321N cells because these cells do not express TG2 (Fig. 2A and 2B). Moreover, the response to NC9 in scrRNA-transduced cells was very similar to that in untransduced cells: NC9 reduced colony growth in scrRNA-transduced U87, U251, and T98G cells (Fig. 2B). Knockdown of TG2 in U87 cells markedly reduced colony growth, modestly reduced colony growth in T98G cells, and did not change colony growth in U251 cells (Fig. 2B). These data suggest that the NC9-TG2 complex in the U251 and T98G cells inhibits proliferation, not the loss of TG2 function per se. Indeed, the growth-retarding effect of NC9 was completely lost in shRNA-transduced U87, U251, and T98G cells (Fig. 2B). This observation, in addition to the lack of effect on TG2-null 1321N cells, strongly suggests that TG2 is the target of NC9’s antiproliferative effect in GBMs cells.
Two Analogues of NC9 Differentially Affect Colony Formation
Considering these results, we examined how different TG2 inhibitors (all analogues of NC9) affected GBM proliferation. Molecular modeling was performed to mimic the covalent binding of NC9 to the active site of TG2. Although NC9 effectively inhibits TG2 and maintains the protein in a more open conformation,32 the binding model from this docking experiment (Fig. S4) suggested that the length and flexibility of the polyethylene glycol linker of NC9 was not ideal because of its binding affinity. Derivative inhibitors were therefore designed in which this linker was replaced with functional groups that were shorter and more conformationally rigid. The structures of 2 of these derivatives, VA4 and VA5, as well as NC9 are shown in Fig. 3A, and their syntheses are reported in the supplementary material. Kinetic studies were carried out in vitro using purified recombinant human TG233 and a direct, continuous spectrophotometric activity assay.30 The time-dependent, irreversible inhibition observed by this kinetic method was characterized as previously described.34 These data provided kinetic inactivation parameters for VA4 (kinact = 1.6min-1, KI = 9.0 µM) and for VA5 (kinact = 2.2min-1, KI = 10 µM) (Fig. S5 and Table S1). All compounds tested inhibited ionomycin-induced in situ transamidating activity almost completely in U87 cells (Fig. 3B). To determine the effects of the inhibitors on TG2 activity in cells without the addition of an ionophore, human neuroblastoma SH-SY5Y cells stably expressing R580A-TG2, which does not bind GTP and thus exhibits a high basal transamidating activity, were used.21-23,35 NC9, VA4, and VA5 all inhibited basal transamidating activities significantly in the R580A-TG2 cells (Fig. 3C).

The TG2 inhibitors NC9, VA4, and VA5 have similar effects on the transamidating and GTPase activities of TG2.
(A) Molecular structures of NC9, VA4, and VA5. (B) NC9, VA4, and VA5 inhibit ionomycin-activated transamidating activity of TG2 in U87 cells. U87 cells were pretreated with the inhibitors for 1 hour and followed by 1 µM ionomycin treatment for 3 hours in the presence of the inhibitors (10 µM). DMSO was used as control. Results are shown as a percent of DMSO control (±SEM) (N=3). (C) NC9, VA4, and VA5 inhibit resting transamidating activity of R580A-TG2 in SHSY5Y cells. SHSY5Y cells that stably overexpress R580A-TG2 were treated with the inhibitors (10 µM) for 16–20 hours. DMSO was used as control. Transamidating activities are shown as a percent of DMSO control (N=3). (D) NC9, VA4, and VA5 inhibit GTP binding to TG2 almost completely. TG2 was preincubated with 1 µM GTP-ɣ-S FL BODIPY in 100mM MOPS (pH = 7.0) and 5mM MgCl2 for 10 minutes, followed by addition of H2O (first bar), inhibitor alone (second bar), or inhibitor plus 0.5mM CaCl2 (third bar). The concentrations for the inhibitors used were 120 µM for NC9, 40 µM for VA4, and 40 µM for VA5. Fluorescence (ex: 490nm, em: 520nm) was measured after 45 minutes on a microplate reader. Results are shown as corrected relative fluorescence unit (RFU) values (±SEM) (N=3). Statistical significance compared to control was tested using Dunnett’s test; ***P<0.005.
TG2 has been shown to exist in 2 distinct conformations: a guanine nucleotide-bound “closed” form13 and an “open” form that binds calcium.14 We therefore examined the effects of the inhibitors on both GTP binding and conformation. Based on the results obtained from native PAGE, all of the inhibitors in this study stabilized TG2 in the open conformation (Fig. S6). Using a BODIPY FL GTP-γ-S binding assay, we determined that the inhibitors completely abolished binding of GTP to TG2 when the protein was activated with calcium (Fig. 3D). These data strongly suggest that the inhibitors are very similar in terms of their effect on protein structure; however, the methods we used did not allow us to distinguish potential differences between the precise structures of the inhibited enzymes but only to classify them among the family of open conformers.
We next tested the effect of VA4 and VA5 on GBM growth. In the colony formation assay, VA4 inhibited colony growth in a manner similar to NC9, whereas VA5 had a completely different effect (Fig. 4A). VA5 either had no effect on colony growth (T98G cells) or promoted it (U87 cells) (Fig. 4A). Because this result was unexpected, we carried out additional studies. In most cases, chemical agents suppress colony growth by promoting cell death and/or slowing proliferation. In a SYTOX-orange assay, we observed minimal toxicity with these inhibitors at the concentrations used (data not shown); therefore, we focused on the possibility of slower proliferation. In an EdU incorporation assay,36 NC9 and VA4 slowed the proliferation of GBM cells; however, VA5 had no effect (Fig. 4B). These results indicate that NC9 and VA4 both suppressed colony growth by slowing the cell cycle in GBM cells. VA5, despite being structurally similar to NC9 and VA4, did not have the same suppressive effect.
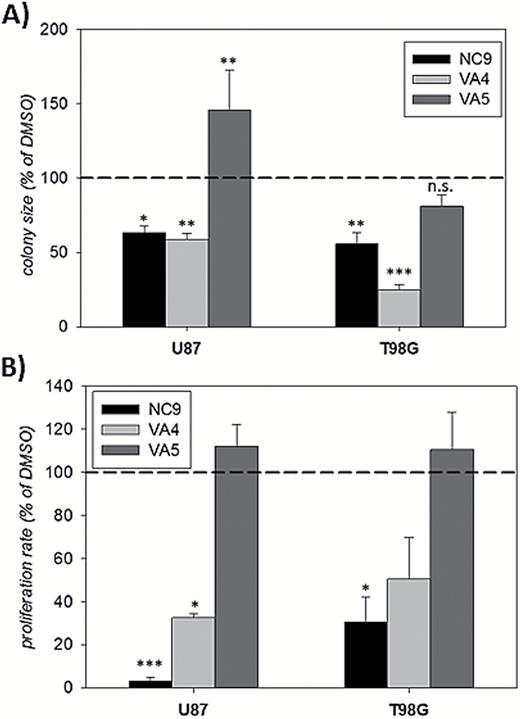
NC9 and VA4, but not VA5, decrease the growth rate of GBM cell lines.
(A) NC9 and VA4, but not VA5, significantly reduced the average colony size of U87 and T98G cells. Cells were seeded in 0.35% agarose and treated with the inhibitors (10 µM) or dimethylsulfoxide (DMSO) control for 2 weeks. For each experiment, inhibitor groups were normalized to DMSO control. Results are shown as a percent of DMSO control (±SEM) (N=3). (B) NC9 and VA4, but not VA5, significantly reduced the proliferation rate of U87 and T98G cells. Cells were treated with NC9, VA4, VA5 (10–20 μM) or DMSO control for 24 hours. At the end of the treatment, cells were pulsed with EdU, fixed, and EdU-positive nuclei were counted. Results are shown as a percent of DMSO control (±SEM) (N=3). Statistical significance was tested using Dunnett’s test; *P<0.05, **P<0.01, ***P<0.005, not significant.
NC9 and VA4 Inhibit the Growth of Mesenchymal and Proneural Neurospheres
We next examined the effects of the inhibitors on the number and growth of neurospheres from mesenchymal (TS543), proneural (TS565), and classical (TS676) GBM subtypes.4-7,27,28 TG2 expression varied considerably in these cell lines but was much higher overall than that observed in T98G cells (Figs S7). The inhibitors did not affect the number of spheres in any of the lines (Fig. 5A), but did decrease the size of spheres in the mesenchymal and proneural subtypes (Fig. 5B, C), thus mimicking the effect seen in the U87 and T98G cells, respectively (Fig. 4A and 5A). The lowest expression level of TG2 was observed in the classical TS676 line, and spheroid growth in this cell line was not affected by the inhibitors (Fig. 5B, C).
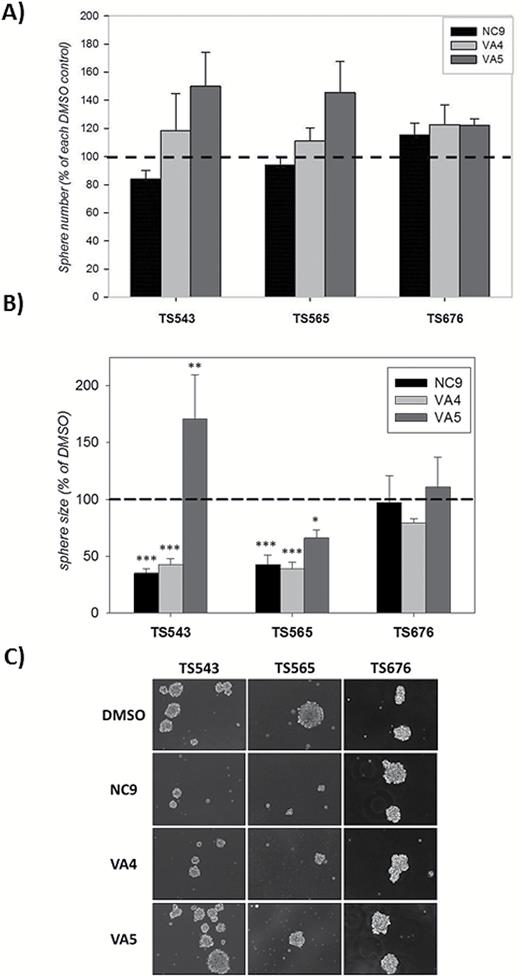
NC9 and VA4, but not VA5, decrease neurosphere growth but not numbers in a subtype-specific manner.
(A) NC9, VA4, or VA5 did not reduce sphere number in glioblastoma-derived neurospheres. Neurospheres were grown in the presence of the inhibitors for 2 weeks. For each experiment, inhibitor groups were normalized to dimethylsulfoxide (DMSO) control. Results are shown as a percent of DMSO control (±SEM) (N=4–7). (B) NC9 and VA4, but not VA5, significantly reduced the growth rate of some neurospheres but not all. Neurospheres were grown in the presence of the inhibitors for 2 weeks. Inhibitor groups were normalized to DMSO control. Results are shown as a percent of DMSO control (±SEM) (N=4–7). C) Representative images showing the effect of the inhibitors on the growth of neurospheres. Statistical significance was tested using Dunnett’s test; *P<0.05, **P<0.01, ***P<0.005.
NC9 Does not Affect EGFR or HIF Signaling but Does Inhibit NFκB Activity
A recent study reported that TG2 inhibitors suppressed growth in U87 but not T98G cells and that treatment for 24 hours reduced EGFR levels in these 2 GBM cell lines. Furthermore, a 30-minute pretreatment with the nonspecific alternative substrate TG2 inhibitor MDC greatly reduced the extent of EGFR phosphorylation (activation) in response to EGF treatment in U87 cells. It was suggested that this effect was dependent on the inhibitors maintaining TG2 in an open conformation.19 We tested this model in the same cell line (U87) with the inhibitor NC9, which has been shown to favor the open conformation of TG2.31,32 In contrast to what was previously observed, NC9 treatment did not result in a decrease in EGFR or phospho-EGFR levels (Fig. 6A).
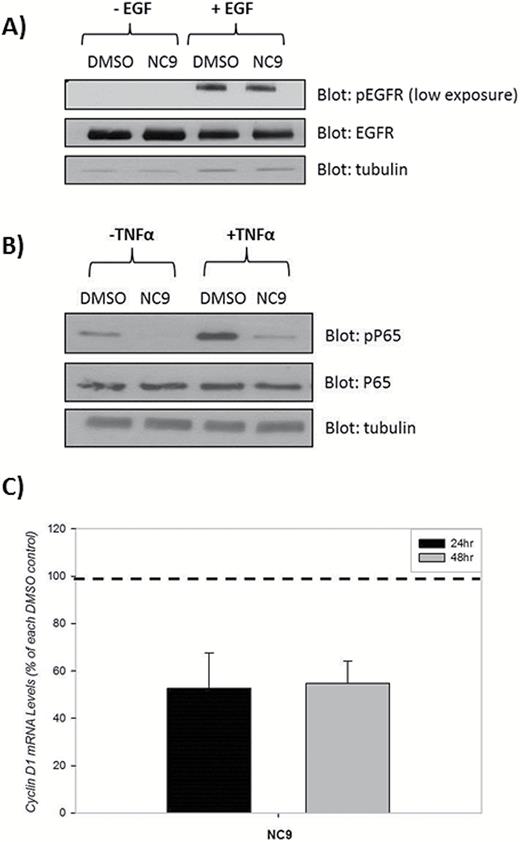
Inhibition of TG2 does not attenuate epidermal growth factor receptor (EGFR) levels or activity but does decrease NF-κB activation. (A) U87 cells were treated with 10 µM NC9 or dimethylsulfoxide (DMSO) control for 24 hours followed by 10 minutes of incubation with 100ng/mL EGF or DMSO. Twenty micrograms of lysates were blotted for phospho-EGFR (pEGFR), EGFR, and tubulin. (B) U87 cells were treated with 10 μM NC9 or DMSO for 15 hours, and 50ng/mL of TNFα was used in 2 groups to activate NF-κB (N=3). (C) U87 cells were treated with 10 μM NC9 for 24 or 48 hours. Messenger RNA levels were quantified using Q-RTPCR (N=3). Statistical significance was tested using Dunnett’s test; *P<0.05, **P<0.01, ***P<0.005.
Previous studies in breast cancer cells have shown that TG2 increased hypoxia-inducing factor 1α (HIF1α) and thus increased HIF activity.37 Therefore, we measured HIF activity; treatment with NC9, VA4, or VA5 did not affect HRE signaling in either the U87 or T98G cells (Fig. S8). Given that activation of NFκB by TG2 has been shown to contribute to increased proliferation in both breast and ovarian cancer cells,3,37 we examined this pathway next. Treatment of U87 cells with NC9, in the absence or presence of TNFα, decreased pP65 levels (Fig. 6B). Additionally, mRNA levels of a downstream target of NFκB, cyclin D1, were decreased in the presence of NC9 (Fig. 6C). Together, our results suggest that TG2 is likely increasing proliferation (at least in part) through the NF-κB pathway in U87 cells. Moreover, the proposed role of TG2 in the EGFR-dependent pathway in GBM proliferation may be a contributing event in certain situations, but it is unlikely to be the most prominent mechanism through which TG2 regulates GBM proliferation.
Discussion
The purpose of this study was to begin delineating the role of TG2 in GBM proliferation. To this end, we initially used 4 established astrocytoma cell lines with varying TG2 expression levels. Some reports suggest a negative correlation between TG2 expression in the glioma tumors and patient survival.18,19 This might well be the case in vivo; however, in this study, a cell line that does not express TG2 (1321N) formed colonies just as well as those expressing TG2 (Fig. 1D and Fig. S3). Furthermore, knocking down TG2 significantly decreased colony growth rate in U87 and T98G cells but did not significantly change colony growth in U251 cells (Fig. 2). These combined results suggest, at least in these ex vivo models, that there is not a readily recognizable correlation between TG2 expression level and the rate of tumor growth. It should be noted, however, that knocking down extremely high levels of TG2 in U87 cells to merely moderate levels dramatically reduced the colony growth rate (Fig. 2).
We next determined if inhibiting TG2 activity had an effect on GBM proliferation. Our initial studies provided encouraging results with the TG2 inhibitor NC9 as colony formation was inhibited in the TG2-expressing GBM cell lines (Fig. 1 and Fig. 2). The fact that NC9 did not inhibit growth when TG2 was naturally absent (Fig. 1) or artificially knocked down (Fig. 2) was particularly promising in terms of the TG2 dependence of the pharmacological response. To extend these studies, we synthesized 2 additional, but related inhibitors VA4 and VA5.
NC9, VA4, and VA5 have very similar profiles in terms of in vitro inhibition kinetics (38 and Table S1). They also showed similar profiles in inhibiting the transamidating activity of TG2 in situ when the glioma cells were treated with ionomycin and in basal conditions in SH-SY5Y cells that stably overexpressed a TG2 mutant, R580A-TG2. Using these cells, we were able to show that inhibition without calcium stimulation was incomplete after 16–20 hours as expected, yet there was no difference between the inhibitors (Fig. 3C).
The different effect of VA5 on GBM proliferation compared with that of VA4 and NC9 was puzzling given their similar inhibitory profiles and general effect on TG2 conformation (Fig. 4 and 5). NC9 and VA4, generally speaking, inhibited GBM proliferation to similar extents, but VA5 did not in most cases. The most straightforward explanation would have been that NC9 and VA4 have other targets and that they suppress GBM growth by acting on these other targets. However, this possibility is extremely unlikely since we showed that NC9 requires TG2 in order to suppress colony growth of GBM cells (Fig. 2). There are several other explanations for this observation. First, it is possible that VA5 may not be as cell-permeable or as stable as the other inhibitors inside the cell. Also, VA5 could be affecting TG2 conformation differently, but this difference could be well below the detection limit of the methods we used. As an example of this possibility, the open conformation of VA5-bound TG2 could be different from that of VA4-bound TG2, but the electrophoretic mobility of the drug-TG2 complex could be very similar (Fig. S6). This would suggest that classifying TG2 conformations into distinctly open and closed forms is likely an oversimplification. Lastly, VA5 could react with targets other than TG2, and the resulting decrease in its concentration or its effect on these targets could prevent or counteract its effect on TG2. The fact that VA5 actually promoted colony growth in U87 (Fig. 4A) and TS543 lines (Fig. 5A), instead of just failing to retard growth, supports this possibility. Regardless, further studies are needed to understand the reasons for the observed differences of the TG2 inhibitors on GBM proliferation.
To extend our studies, we used tumor-derived cells that have never been exposed to serum: the neurospheres. Intriguingly, there was a striking similarity between the TS543 and U87 lines, as well as the TS565 and T98G lines, in terms of their response to TG2 inhibitors. NC9 and VA4 suppressed colony (or sphere) growth in these lines. VA5, on the other hand, had either no effect or a growth-promoting effect. The TS676 line was not affected by any of the inhibitors (Fig. 5). The question of whether this is due to the fact that the TS676 line expresses lower levels of TG2 (Fig. S6) or because of its subtype remains to be answered. Further, the inhibitors had no effect on sphere number, indicating that inhibiting TG2 does not result in decreased ability of the cells to initiate sphere formation, which may be reflective of the fact that they do not significantly decrease viability of GBM cells.
Overall, our results clearly show that TG2 plays an important, but notoriously context-specific, role in GBM cell biology and that the variability is likely due to specific gene profiles of the tumor cells. These differences are reflected in the differential responses to the TG2 inhibitors. Due to this complexity, TG2 is unlikely to be a good drug target using conventional pharmacological approaches. However, with further studies, it should be possible to unravel the genetic “fingerprints” that make TG2 inhibitors effective, and this information could be exploited to develop targeted therapy. In addition, it is encouraging that the TG2 inhibitors, which were very efficacious in reducing GBM proliferation in most cell types (NC9 and VA4), do not cause toxicity in neurons (Fig. S9).
Supplementary Material
Supplementary material is available at Neuro-Oncology online.
Funding
This work was supported by NIH grant NS065825 (GVWJ) and NSERC Discovery Grant 184034 (JWK).
Conflict of interest statement. A patent application has been submitted for the synthesis and use of the inhibitors VA4 and VA5 by GVW Johnson and JW Keillor. The authors have no other competing financial interests in relation to the work described herein.
Acknowledgements
We thank Dr. C. Brennan and staff at the Monoclonal Antibody Core Facility of Memorial Sloan Kettering Cancer Center for the neurospheres lines, Dr. R. Jope for the 1321N cells, Dr. E. Benveniste for the U87 and U251 cells, and Dr. R.S. Freeman for providing the HRE luciferase reporter. We thank Dr. C. Clouthier for input and advice on the inhibitors and C. Brizzee for assisting with preparation of lentiviruses and the colony formation assays.
References
Author notes
Corresponding author: Gail V.W. Johnson, Ph.D., Department of Anesthesiology, University of Rochester Medical Center, University of Rochester, 601 Elmwood Ave., Box 604, Rochester, NY ([email protected]).
*These authors contributed equally.


