


Abstract
Meningiomas are common intracranial tumors in adults, yet the genetics and cause of sporadic meningiomas are not well understood. Few familial clusters have been reported. The aim of this study was to investigate the familiality of meningiomas within the Utah Population Database.
Meningioma cases reported in the Utah Cancer Registry were identified. Relative risk of their relatives was calculated. All possible cases were assessed with the Genealogical Index of Familiality (GIF), which measures average pairwise relatedness of all possible pairs using the Malecot coefficient of kinship. Clusters of cases descending from a common ancestor were identified.
Eight hundred fifty-eight meningioma cases were reported. The relative risk of a first- or second-degree relative was 3.13 (95% CI: 1.67, 5.36) or 2.28 (1.30, 3.70), respectively. The GIF statistic demonstrated a clear excess of relationships for genetic distance <4 (closer than first cousins). We identified 920 pedigrees, including 2–21 meningioma cases. One hundred eighty-nine of these pedigrees, including 2–15 cases, had a significant excess (P < 0.05) of meningioma cases over what was expected.
This Utah population–based analysis of meningiomas shows clear evidence of familial clustering and supports both a familial and a germline variant basis for meningioma. These clusters may allow identification of genes likely to contribute to tumorigenesis in high-risk pedigrees. These relative risk data provide the basis for further investigations of genetic contributions to meningioma. These data may contribute to developing a basis for determining screening criteria of higher-risk pedigrees for the presence of meningiomas.
Meningiomas are the most common intracranial primary tumor in adults, but the genetics and causes of sporadic meningiomas are not well understood, and few familial clusters have been reported. This study demonstrates that there is familial clustering of meningiomas identified in a Utah population. This increases the relative risk of meningiomas in patients’ family members. The relative risk data presented here may enable improved counseling of relatives of patients with meningiomas regarding their risk of developing these tumors. Furthermore, these data provide a basis for developing screening criteria of higher-risk pedigrees for the presence of meningiomas and for identifying genes likely to contribute to tumorigenesis in high-risk pedigrees.
Meningiomas are the most common intracranial primary tumor in adults, comprising over 35% of intracranial tumors, as noted in the Central Brain Tumor Registry of the United States.1 The strong risk factors of previous radiation and some inherited syndromes such as neurofibromatosis (NF2), where the inherited genes are rare and penetrant, have been well established.2 Given that meningiomas may represent a significant disability for those patients who require treatment and can occur in locations that induce significant neurological deficits, identifying and understanding the genetic contribution to meningioma development would be important in counseling at-risk populations and in designing appropriate surveillance for individuals who carry a higher risk. In sporadic meningioma, NF2 is deleted or mutated in up to 50% of cases.3 In addition to NF2, chromosomes 1p, 3p, 6q, 10, and 14q are suspected locations for tumor suppressor genes.4 More detailed genetics and the cause of sporadic meningiomas are not well understood.5–12
Although meningiomas may occur in up to 3% of individuals, families with multiple affected members are rare and most of these diagnoses are attributed to NF2 mutation.13 Previous studies have shown some evidence indicating a genetic origin,14–16 but studies of germline variant associations with meningioma are limited. Identification of families with higher incidence of meningioma would indicate likely genetic contribution to the development of such tumors and enable identification of genes important in their development. We used a Utah population–based resource to describe the observed familial clustering of meningiomas and to test our hypothesis that there is a genetic contribution to predisposition to these tumors. This method can provide data to support both a familial and a germline variant basis for meningioma.
Methods
The University of Utah Institutional Review Board approved this study.
Utah Population Database
A unique resource, the Utah Population Database (UPDB) combines the genealogy of the descendants of the pioneer founders of Utah with statewide cancer data and other population data. The genealogy of Utah was compiled in the early 1970s from original “family group sheets”17 and has since been expanded with genealogy from Utah vital statistics data (eg, trios of mother, father, child from birth certificates). The resource includes records for more than 7 million individuals. The approximately 3 million of these individuals who have genealogy data for both parents and grandparents that connect to the original Utah genealogy were analyzed here.
Utah Cancer Registry
The Utah Cancer Registry (UCR) was established in 1966 and became a National Cancer Institute Surveillance, Epidemiology, and End Results (SEER) registry in 1973. By law, with few exceptions, all independent primary cancers diagnosed or treated in Utah are reportable. Meningioma was not reportable to SEER before 2004. Benign brain cancer was reportable under state guidelines pre-2004, so UCR does have some data; however, since these data are not complete and do not have the same level of quality assurance as 2004 forward, they were excluded for our analysis. All other meningioma cases were identified using primary site codes 700–709 and histology codes 9530–9538 as described in the International Classification of Disease for Oncology (ICD-O).
Relative Risks in Relatives
Relative risks (RRs) in relatives compare the observed number of affected relatives, by relative type, to the expected number of affected relatives, which is based on population rates for the disease of interest. All individuals in the UPDB were assigned to a cohort based on sex, 5-year birth year range, and birth state (Utah or not). Cohort-specific rates of meningiomas were estimated by dividing the number of meningioma cases in each cohort by the total number of UPDB individuals in the cohort. These estimated rates do not represent Utah population rates, but rather the rates for the UPDB population analyzed; they are unbiased for consideration of an excess among a set of individuals (see Cannon Albright18 for more details). The observed number of meningioma cases in each set of relatives was counted, without duplication. The expected number of meningioma cases in each set of relatives was calculated by counting the relatives by cohort (without duplication) and multiplying the number of relatives in each cohort by the cohort-specific rate for meningioma, and summing over all cohorts. RR was calculated as observed number of cases divided by the estimated number of cases. The distribution of the number of observed meningioma cases is assumed to be Poisson distributed with a mean equal to the expected number of cases; 95% confidence intervals for the RR were calculated as described previously.19
Test of Excess Familial Clustering
The combination of genealogic with cancer data allows us to consider the hypothesis of excess familial clustering, or relatedness, among meningioma cases. This is accomplished using the Genealogical Index of Familiality (GIF) method, developed for use with the UPDB.18 The GIF test measures the average pairwise relatedness of all possible pairs of cases using the Malecot coefficient of kinship, a standard measure estimating the biological relationship between 2 individuals, representing the probability that 2 genes, sampled at random from each individual, are identical.20 The GIF test compares the average pairwise relatedness of all pairs of meningioma cases to the expected pairwise relatedness of a similar (matched) group of individuals randomly selected from the UPDB. This expected pairwise relatedness of the cases is estimated from the mean pairwise relatedness of 1000 sets of matched controls (matched on sex, 5-year birth year range, and birth state; each set containing 1 matched control for each of the cases). The statistical significance of the test for excess familial clustering is measured empirically as the number of times one of the 1000 control GIF statistics exceeds the case GIF statistic. The overall GIF statistic tests for excess relationships between pairs of cases versus pairs of controls, considering all relationships; the distant GIF (dGIF) test statistic is calculated similarly but excludes relationships closer than third degree, and therefore provides a strong test for a genetic contribution to a phenotype, by ignoring close relationships among which shared lifestyle and risk factors are more likely.
The contribution to the GIF statistic can be quantified separately for the different genetic distances observed among pairs of cases and controls (see example in Fig. 1). Genetic distance measures are 1 for parent/offspring, 2 for siblings or grandparent/grandchild, 3 for avunculars or similar, 4 for first cousins or similar, and 6 for second cousins or similar, and so forth.

GIF analysis of pairwise relatedness for 858 meningioma cases and 1000 sets of matched controls showing the contribution to the overall GIF statistic by the pairwise genetic distance. The distribution for the matched controls shows the expected pairwise relatedness for randomly selected individuals from the Utah population who are similar in sex, birth year, and birthplace to the meningioma patients.
High-Risk Meningioma Pedigrees
All clusters of meningioma cases descending from a common ancestor can be identified in the UPDB. We identify all such clusters, or pedigrees, that are not completely overlapping; individuals can appear in more than one such cluster. To determine whether any observed cluster (or pedigree) is high risk, the observed number of meningioma cases among the descendants is compared with the expected number of meningioma cases. The expected number of meningiomas among the descendants is calculated by counting all descendants by cohort, multiplying the number of descendants in each cohort by the cohort-specific rate of meningioma (estimated as described above), and summing over all cohorts. An excess of observed to expected affected descendants of P < 0.05 is used to classify a pedigree as high risk.
Results
Relative Risks in Relatives
A total of 858 meningioma cases reported in the UCR were identified using ICD-O codes. Table 1 shows the estimated RRs for meningioma in the first-, second-, and third-degree relatives of meningioma patients (genetic distance ≤4). For a first- or second-degree relative of an affected individual, the RR of harboring a meningioma was 3.13 or 2.28, respectively. No meningioma cases were observed in the 679 spouses of meningioma patients (0.4 expected).
Estimated RR for meningioma in relatives of 858 individuals with diagnoses of meningiomas
| Relative | n | Cases Observed | Cases Expected | Relative Risk | P | 95% CI |
|---|---|---|---|---|---|---|
| First degree | 7156 | 13 | 4.2 | 3.13 | 0.0004 | 1.67, 5.36 |
| Second degree | 22188 | 16 | 7.0 | 2.28 | 0.003 | 1.30, 3.70 |
| Third degree | 57696 | 18 | 19.0 | 0.95 | 0.47 | 0.56, 1.50 |
| Spouses | 679 | 0 | 0.4 | — | — | — |
Genealogical Index of Familiality Test of Excess Familial Clustering
In the GIF test for excess relatedness, we evaluated 858 meningioma cases. A case GIF of 3.12 and a mean control GIF of 2.57 were observed (empirical P = 0.006). Figure 1 shows the contribution to the GIF statistic by the genetic distance for all case pairs observed compared with the average for all control pairs observed. There is a clear excess of case relationships compared with control relationships at genetic distances less than 4 (distance 1 = parent/offspring, 2 = grandparents/children and siblings, and 3 = avunculars or great grandparents/children). For more distant relationships, the observed clustering for cases was similar to that expected as estimated from matched controls (dGIF empirical P = 0.525).
High-Risk Meningioma Pedigrees
Analysis of all relationships among meningioma cases in the UPDB identified 920 pedigrees including between 2 and 21 meningioma cases. Analysis for an excess of cases among the descendants of these pedigrees identified that 189 of these pedigrees, including 2 to 15 cases, had a significant excess (P < 0.05) of meningioma cases. Figure 2 shows an example of high-risk meningioma pedigree. The figure does not include all descendants but shows only the descending lines to all known meningioma cases. The top generation shows a single male with his 3 different spouses, and from each spouse multiple meningioma cases are observed among the descendants. There are a total of almost 9500 descendants of this male founder in UPDB (not all shown), and meningioma has been diagnosed in 7 since 2004 (2.5 expected; P = 0.01).
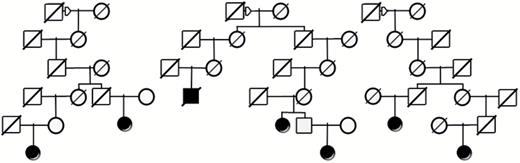
Example of a high-risk meningioma pedigree from UPDB showing a founder male (square) with descendants from 3 different female spouses (circles). Among the total of almost 9500 descendants of this male represented in UPDB (but not all shown), 7 meningioma cases (solid symbols) were observed and only 2.5 were expected (P = 0.01). Diagonal lines through symbols indicate the individual is deceased.
Discussion
Reports of familial clustering of meningiomas are rare. A review of familial clustering observed for meningiomas in the Utah Population Database has not previously been reported. The observed clustering of 858 histologically confirmed meningiomas in patients who have at least 3 generations of genealogy has been analyzed to define the familial clustering observed in the Utah population. A significant excess of meningioma was observed in both first- and second-degree relatives of patients, although not in third-degree relatives. Significant excess pairwise relatedness was observed for relationships closer than first cousins (genetic distance <4), and though an excess of cases compared with control relationships was observed for most genetic distances >4, the difference was not significant. Multiple high-risk pedigrees with both close and distantly related meningioma cases were observed. Although these results are not overwhelmingly supportive of a strong genetic contribution to all cases of meningioma, they suggest that there is elevated risk to relatives that likely represents both environmental and genetic components, and there are some high-risk pedigrees that suggest a segregating predisposition to meningioma.
Few studies on familial meningiomas have been reported, and there are few populations for which both close and distant relationships can be analyzed.21 One other such population is in Iceland; Amundadottir et al22 have summarized RRs in relatives out to fifth-degree relationships for 291 cancers of the meninges and observed results very similar to those reported here, including first-degree RR = 3.15 (1.50, 6.84); second-degree RR = 1.36 (0.54, 4.03), and third-degree RR = 1.60 (0.94, 2.70).
It is also apparent that these observations are distinct from any germline basis for meningioma, which is deduced from the presence of NF2 and sporadic familial cases. Occurrence of familial multiple meningiomas outside of the context of NF2 disease is uncommon.11 Recently, germ line loss-of-function mutations in the SMARCE1 chromatin remodeling factor were identified in a small number of families with multiple spinal clear cell meningiomas,23 and SMARCE1 mutations have also been identified in cranial clear cell subtype meningiomas.24 Furthermore, a mutation in the Shh-Gli1 pathway gene, SUFU, was identified as the cause of multiple meningiomas in a single large Finnish family.5
There are some limitations to the present analysis. Although the UCR has some data for meningioma cases prior to 2004, there is not complete ascertainment or assured quality before that date. For this reason, the analysis presented here was limited to cases diagnosed after 2003. This narrow window of less than the size of a typical generation (~20 y) results in censoring of cases, and thus relationships. Cases not diagnosed in Utah or diagnosed before 1966 are censored, as are cases that did not record link to genealogy data. Although we can assume that such censoring does not bias results, as it should occur equally in all groups, it does impact power to detect effects. In addition, access to UPDB data is tightly controlled within each study. Thus, the analysis does not specifically include or exclude cases associated with ionizing radiation or NF2. The large number of cases identified, together with the low prevalence of NF2, should reduce this influence.
Regardless, this Utah population–based analysis of meningiomas shows clear evidence of familial clustering in excess of that expected. Whether this clustering is the result of shared genes, shared environment, or a combination is not clear; however, the absence of any observed cases in spouses of meningioma patients and the multiple extended high-risk pedigrees observed, in combination with the GIF and RR results, strongly suggest that there is some inherited contribution to meningioma predisposition. The Utah high-risk pedigrees identified provide a powerful resource for the identification of such genes.
We believe that, with further supporting data, the RR data presented here may enable improved counseling of relatives of patients with meningiomas regarding their risk of developing these tumors. Furthermore, these data may ultimately provide a basis for determining screening criteria of higher-risk pedigrees for the presence of meningiomas. Future studies will focus on identification of genes likely to contribute to tumorigenesis in high-risk pedigrees.
Conclusions
This Utah population–based analysis of meningiomas shows clear evidence of familial clustering and supports both a familial and a germline variant basis for meningioma.
Funding
Data access was supported by the Utah Cancer Registry, which is funded by contract no. HHSN261201000026C from the National Cancer Institute’s SEER Program with additional support from the Utah State Department of Health and the University of Utah. Partial support for all datasets within the UPDB, and to Dr Cannon-Albright, was provided by Huntsman Cancer Institute, Huntsman Cancer Foundation, the University of Utah, and the Huntsman Cancer Institute’s Cancer Center Support grant P30 CA42014 from the National Cancer Institute.
Conflict of interest statement. The authors have no conflicts of interest to report.
Acknowledgment
We thank Kristin Kraus, MSc, for editorial assistance.
References


