


Abstract
Gliomas are primary brain tumors that are associated with a poor prognosis. The introduction of new treatment modalities (including immunotherapy) for these neoplasms in the last 3 decades has resulted in only limited improvement in survival. Gliomas are known to create an immunosuppressive microenvironment that hampers the efficacy of (immuno)therapy. One component of this immunosuppressive environment is the myeloid-derived suppressor cell (MDSC).
We set out to analyze the presence and activation state of MDSCs in blood (n = 41) and tumor (n = 20) of glioma patients by measuring S100A8/9 and arginase using flow cytometry and qPCR. Inhibition of T cell proliferation and cytokine production after stimulation with anti-CD3/anti-CD28 coated beads was used to measure in vitro MDSC suppression capacity.
We report a trend toward a tumor grade-dependent increase of both monocytic (M-) and polymorphonuclear (PMN-) MDSC subpopulations in the blood of patients with glioma. M-MDSCs of glioma patients have increased levels of intracellular S100A8/9 compared with M-MDSCs in healthy controls (HCs). Glioma patients also have increased S100A8/9 serum levels, which correlates with increased arginase activity in serum. PMN-MDSCs in both blood and tumor tissue demonstrated high expression of arginase. Furthermore, we assessed blood-derived PMN-MDSC function and showed that these cells have potent T cell suppressive function in vitro.
These data indicate a tumor grade-dependent increase of MDSCs in the blood of patients with a glioma. These MDSCs exhibit an increased activation state compared with MDSCs in HCs, independent of tumor grade.
Glioblastomas (GBMs) are the most malignant primary brain tumors. Despite multimodal treatment including surgical resection, irradiation, and chemotherapy, median survival is about 14.5 months.1,2 Immunotherapy offers the opportunity to specifically target residual tumor cells without damaging healthy neighboring brain cells.3 Multiple immunotherapeutic treatment strategies have been exploited to treat glioma patients.4 Data from phase 1 and 2 trials suggest that immunotherapy can result in a meaningful, and sometimes durable, response for GBM patients. So far, however, immunological responses could only be measured in a limited number of patients (as reviewed in3,5,6). Probably, the occurrence of limited responses in patients is the result of an immunosuppressive network implemented by the tumor.3,7–9
We and others have previously described the presence and suppressive activity of regulatory T cells within glioma.10–12 More recently, the increase of cells with a myeloid-derived suppressor cell (MDSC) phenotype (CD33+MHC-II−), both the monocytic (M-)13 and polymorphonuclear (PMN-) MDSCs13,14 subpopulations has been described. MDSCs within tumor tissue have also been described; the findings are not consistent, however, and additional data are required.13,15,16 Therefore, it is unknown if MDSC numbers in blood are correlated with MDSC numbers within the tumor.
We have previously reported the expression of various myeloid markers on MDSCs of healthy controls (HCs) and patients with glioma.13 Additionally, there are intracellular markers that are important for MDSC development, recruitment, and activation. One of these factors is heterodimer S100A8/9 (calprotectin).17,18 S100A8/9 can be expressed by various myeloid cells and tumor cells, including glioma, where it can promote tumor cell growth and migration at low concentrations (5 or 10 µg/mL) or apoptosis at high concentration.19–21
MDSCs can suppress T cell function by several mechanisms (as reviewed elsewhere7) with the expression of arginase being the most frequently investigated mechanism. Arginase acts by decreasing the level of L-arginine, an amino acid critical for the re-expression of the T-cell co-receptor CD3zeta and thereby T cell function.22 The activation status of MDSCs may therefore be an important prognostic factor for response to immunotherapy. Furthermore, interference with MDSC presence of function may enhance immune-mediated tumor-cell killing.
Here we studied MDSC prevalence and expression of S100A8/9 and arginase in blood, serum, and tumor tissue of glioma patients. In addition, we determined the immunosuppressive capacity of MDSCs from glioma patients. Further elucidation of such glioma-initiated suppressive mechanisms will be important for improving the efficacy of immunotherapeutic protocols.
Materials and Methods
Blood and Tumor Samples
Peripheral blood samples were collected from 17 HCs and 41 patients undergoing neurosurgical resection or biopsy for intracranial tumors at the Radboud University Medical Center (Radboudumc), Nijmegen, the Netherlands. Donor characteristics can be found in Supplementary material, Table S1 and Supplementary Materials. Serum samples were obtained from 46 participants and tumor tissue samples from 21 participants. Most patients had started a 3 × 5 mg dexamethasone regime the day before surgery, while others received dexamethasone at an earlier time point to reduce edema. All donors signed an informed consent, and the study was approved by our Institutional Review Board. Processing of these samples was started immediately after blood and tumor tissue samples were obtained.
Tissue Handling
Fresh brain tumor material was obtained by excision and by ultrasonic aspiration. Tumor cell suspensions were prepared as described previously.10 Briefly, tumor fragments were filtered, washed, and incubated with collagenase type-IA (50 µg/mL; Sigma-Aldrich), DNAse type-I (10 μg/mL; Roche), and trypsin inhibitor (1 μg/mL; Sigma) in Hank's Balanced Salt Solution (Gibco, Invitrogen, Leek) at 37°C followed by mechanical disruption. Tumor cell suspensions were placed on a Ficoll gradient (Lucron Bioproducts,) to remove death cells and potential mature granule-rich neutrophils. Similarly, a Ficoll gradient was used to obtain peripheral blood mononuclear cells (PBMCs) from freshly obtained blood, where samples from the HCs and the patients with glioma were processed abreast when possible.
Fluorescence-activated Cell Sorting: Analysis and Sorting
Fluorescence-activated cell sorting (FACS) stainings were performed as described elsewhere13 and can be found in Supplementary Materials. Briefly, PBMCs or single cell tumor tissue suspensions were stained with fixable viability dye eFluor 780 (eBioscience). After washing, cells were stained with directly conjugated monoclonal antibodies. Cells were washed, fixed, and permeabilized according to manufacturer's instructions (eBioscience 00-5523-00). Intracellular staining was performed with S100A8/9 (Hycult) followed by anti-IgG-A563 (Life Technologies) staining. Cells were resuspended in PBS containing 0.5% bovine serum albumin (Roche, Indianapolis, IN), 0.01% sodium azide and 2% human serum, and measured on a Cyan (Beckman Coulter) or Gallios (Beckman Coulter) flow cytometer. Data were analyzed using FlowJo 9.2, where events were gated on single viable cells for further analysis. For sorting, cells were stained with HLA-DR,DP,DQ-Fitc, CD33-APC, CD14-PE, and CD15-PE-Cy7 without fixing and sorted on a FACS Aria (BD).
Quantitative Polymerase Chain Reaction
RNA isolations were performed using the ZR RNA isolation kit (Zymo Research) according to manufacturer's instructions, and cDNA was synthesized using Moloney murine leukemia virus reverse transcriptase (Invitrogen). cDNA amplification for genes of interest was measured by SYBR Green (Applied Biosystems) using a Biorad CFX apparatus. Primers (Sigma) sequences can be found in Supplementary material, Table S2. Data were normalized against porphobilinogen deaminase (PBGD) or hypoxanthine phosphoribosyltransferase (HPRT) expression for blood or tumor, respectively, because HPRT has been found to be a representative gene in tumor tissue.23
Immunohistochemistry
Consecutive 4 µm histological sections of formalin-fixed, paraffin-embedded tissue were either subjected to hematoxylin and eosin (H&E) staining or immunohistochemistry (IHC) double-staining against CD15 (BD) and Arg-1 (Hycult HM2162) as described elsewhere.13 Briefly, slides for IHC were deparaffinized and rehydrated. Heat-induced epitope retrieval (HIER) was performed, and slides were stained with the anti-CD15 antibody (BD). Slides were subsequently washed with phosphate-buffered saline (PBS) and incubated with Poly-AP-GAM/R/R IgG (Immunologic) prior to detection with PermaRed/AP (ITK Diagnostics. Slides were then washed with PBS, and steps were repeated starting with HIER to stain with anti Arg-1, using the same secondary antibody and detection of antibody with PermaBlue/AP (ITK Diagnostics). The slides were washed with water, dried, and mounted with Kaiser’s glycerin.
Suppression Assay
PBMCs were depleted for either CD15+ or CD20+ cells by magnetic-activated cell sorting (MACS) according to manufacturer's protocol using directly FITC-conjugated antibodies (Miltenyi 130-081-101; BD 345792), anti-FITC beads (Miltenyi 130-048-701), and a LS MACS column (Miltenyi 130-042-401). Purity of isolated cells and depleted PBMCs were checked by flow cytometry. Total PBMCs or depleted PBMCs were placed in a 96-well plate in IMDM with 2% human serum. Cells were activated with anti-CD3/anti-CD28 conjugated dynabeads (Gibco 11131D), and isolated cells were added (1:1, 1:2, or 1:4 [isolated cells:PBMCs]). Supernatant was collected after 60 hours, and proliferation was measured by tritium incorporation after 4 days as described before.24
Enzyme-linked Immunosorbent Assay
IFN-γ was determined by ELISA (coating antibody: Thermo Scientific M700A; detection antibody: Thermo scientific M701B; horseradish peroxidase conjugated streptavidin: Life Technologies S911) using recombinant IFN-γ as a reference (Thermo Scientific RIFNG50). Absorbance was measured on a BioRad iMark microplate reader.
S100A8/9 was measured using the human calprotectin ELISA kit (Hycult) according to the manufacturer's instructions. Arginase activity was measured using a QuantiChrom Arginase Assay kit (BioAssay Systems) according to the manufacturer's instructions after depletion of small molecules using Amicon (Carrigtwohill) Ultra 0.5 mL 10 K centrifugal filter devices (Millipore UFC501024).
Statistical Analysis
Statistical comparison between 2 groups was performed using an unpaired t test. One-way ANOVA with a Tukey post-hoc test was used for statistical comparison between more than 2 groups. A Pearson correlation analysis was performed using Graphpad Prism.
Results
MDSC Number in Blood and Tumor Tissue of Patients With Grade IV Glioma
In our previous study, we measured and characterized cells with the MDSC phenotype in the blood of 18 patients with glioma.13 Here we extended the study with an additional 23 participants with glioma and measured changes in myeloid activation markers and functional suppression. MDSCs were defined within PBMCs as CD33+ and MHC-II− (Fig. 1A, left panel), which could be further divided into M-MDSCs (CD14+) and PMN-MDSCs (CD15+) (Fig. 1A, right panel). Both MDSC subpopulations were significantly increased in the blood of participants with grade IV glioma compared with the HCs (Fig. 1B and C). Although not significant, there was a trend toward increasing MDSC percentage with increasing tumor grade for both subpopulations.
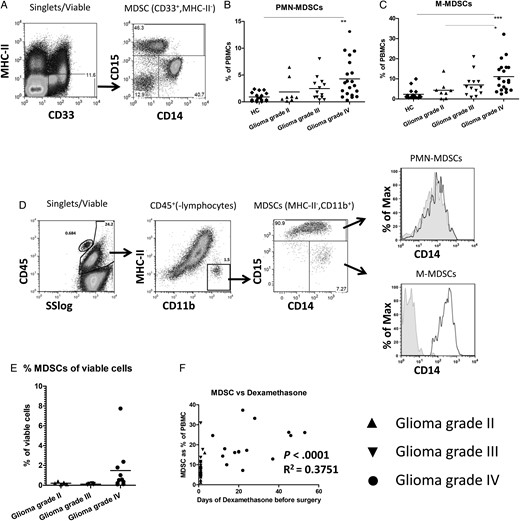
Increased myeloid-derived suppressor cell (MDSC) numbers in blood and tumor tissue of patients with high grade glioma. (A) Gating strategy for MDSCs. Peripheral blood mononuclear cells (PBMCs) were stained as described, and single, viable cells were plotted for CD33 and MHC-II expression (left panel). CD33+MHC-II− cells were further plotted for CD14 and CD15 (right panel). (B and C) The percentages of PMN-MDSC (B) and M-MDSC (C) are shown as a percentage of total PBMCs. Data points were displayed in grouped column scatters separating the healthy controls (HCs; (n = 17)) and patients with a grade II (n = 8), grade III (n = 13) or grade IV (n = 20) glioma. Asterisks represent statistical significance (*P < .05; ** P < .01; *** P < .001). (D) Tumor tissue single cell suspensions were stained as described, and single, viable cells were plotted for CD45 expression against the sideward scatter (SS)(left panel). CD45+ cells excluding lymphocytes were plotted for CD11b and MHC-II (second panel). CD11b+MHC-II− cells were plotted for CD14 and CD15 (third panel). PMN-MDSCs or M-MDSCs were plotted for CD14 expression with the isotype staining displayed in gray (CD15− MDSCs displaying the isotype of M-MDSCs). (E) Percentage of CD45+CD11b+MHC-II− cells plotted as a percentage of the total number of viable cells. (F) The percentage of MDSCs in blood plotted against the number of days of dexamethasone treatment before surgery. Relevant statistics of all glioma samples combined are incorporated within Fig. 1F.
Because CD33 is not optimal for staining tumor material, we used CD11b in combination with MHC-II to discriminate MDSCs within tumor, which were mainly PMN-MDSCs (Fig. 1D) and corroborated our previous results.13 Although the histogram of the intratumoral MDSCs suggested that PMN-MDSCs might also express CD14, we could not detect a CD14 signal over isotype for these PMN-MDSC (Fig. 1D, upper right panel), similar to PMN-MDSCs found in blood (Supplementary material, Fig. S1A). These results were confirmed by IHC of CD11b enriched tumor tissue cell suspension, in which cells with polymorphic nuclei stained positive for CD15, but no signal for CD14 was observed for these cells (Supplementary material, Fig. S1B).
There was no difference in PMN-MDSC infiltration between grade II and grade III tumors (with means of 0.2 and 0.1 percent of total viable cells, respectively), but higher PMN-MDSC numbers were found in some grade IV tumors (with a mean of 1.5 percent) (Fig. 1E), although this difference did not reach statistical significance. We did not observe a clear correlation between the number of MDSCs in blood and tumor, suggesting that MDSC numbers in blood do not necessarily reflect the situation within the tumor (Supplementary material, Fig. S1C). Since the participants received dexamethasone before sample collection, we plotted the duration of dexamethasone treatment before sample collection against the percentage of MDSCs in the blood or tumor of patients with a glioma. There was a statistically significant correlation between the duration of dexamethasone treatment and percentage of MDSCs in blood, but not in tumor, either as the total of MDSCs or the separate subpopulations (Fig. 1F, Supplementary material, Fig. S2 and data not shown). Altogether, these data showed increased numbers of MDSCs in the blood as well as in the tumor tissue, particularly from the grade IV glioma patients.
Increased S100A8/9 Protein Expression in Myeloid Cells of Patients With Glioma
To determine whether the MDSCs found in the blood of patients with a glial brain tumor are more activated compared with MDSCs from the HCs, we performed stainings for intracellular S100A8/9. MDSCs were gated as described above (Fig. 1A). A statistically significant increase of intracellular S100A8/9 was observed in MDSCs of glioma patients compared with the HCs (Fig. 2A); the increase already being present in patients with a grade II glioma and not significantly increasing with tumor grade (Fig. 2B). The lack of significant increase in MDSCs from patients with a grade III glioma was most likely caused by the small sample size. Subsequently, S100A8/9 expression was analyzed in the MDSC subpopulations and CD33+MHC-II+ cells (Fig. 2C), the latter population mainly consisting of monocytes and macrophages. Up to now, intracellular S100A8/9 has been described as a general MDSC activation marker There was no statistically significant difference in S100A8/9 expression level in PMN-MDSCs of glioma patients compared with the HCs (Fig. 2D). Strikingly, S100A8/9 was expressed at higher levels in M-MDSCs and CD33+MHC-II+ cells from glioma patients (Fig. 2E and F). These data indicate that S100A8/9 might be differentially regulated by the MDSC subpopulation.

Increase of S100A8/9 expression in myeloid cells. (A and B) CD33+MHC-II− cells were gated as in Fig. 1A. S100A8/9 mean fluorescent intensity (mfi) data are displayed in whisker plots. Data of glioma patients were either combined (A) or divided based on malignancy (B) and compared with healthy controls (HCs). Asterisks represent statistical significance (*P < .05; ** P < .01; *** P < .001). (C) myeloid-derived suppressor cells (MDSCs) from either HC (top panels) or glioma patients (PT; lower panels) were gated on PMN-MDSC (left panel) or M-MDSC (middle panel) subpopulations and plotted for S100A8/9. Additionally, CD33+MHC-II+ cells were plotted for S100A8/9 expression (right panels). Representative histograms of 17 HC and 20 patients with glioma (5 grade II; 4 grade III; 10 grade IV) are shown with the black line displaying the S100A8/9 staining and the gray histogram displaying the isotype. (D–F) Whisker plots of mfi of S100A8/9 in PMN-MDSCs (D), M-MDSCs (E) and CD33+MHC-II+ (F) cells.
Increased S100A8/9 Levels and Arginase Activity in Serum of Patients With Glioma
Since S100A8/9 can be secreted, S100A8/9 serum levels were determined. S100A8/9 serum levels were increased in the patients with a glioma compared with the serum levels of HCs (Fig. 3A). This increase seemed to be already present in the serum of patients with a grade II glioma but had a statistically significant increase in the patients with grade III or IV glioma. Arginase activity in the serum of glioma patients showed a similar increase, (Fig. 3B) and we found a correlation between these values (Fig. 3C). These data indicate a systemic immune suppression in glioma patients which, similar as the intracellular S100A8/9 expression, seems already present before the increase of MDSC numbers and was not correlated with the number of MDSCs found in tumor tissue (data not shown). Additionally, no correlation was found for the days of preoperative dexamethasone treatment and/one of the measured serum levels, viz. S100A8/9 and arginase activity (Fig. 3D and E).
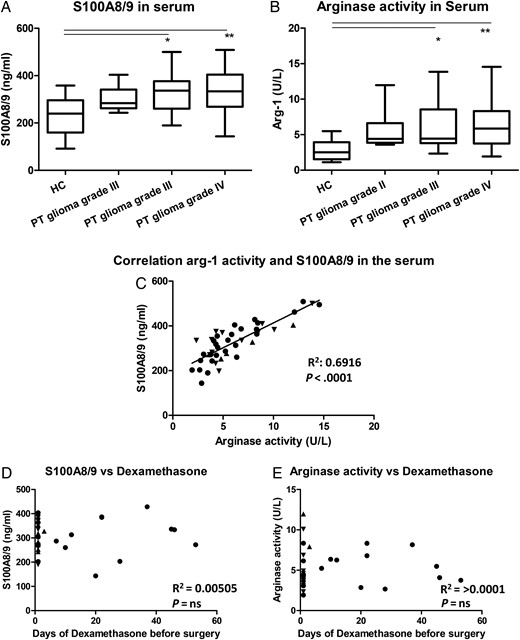
Increase of S100A8/9 levels and arginase activity in serum of patients with glioma. (A and B) S100A8/9 levels (A) and arginase activity (B) in serum was plotted in a whisker plot for healthy controls (HCs; (n = 12)) and glioma patients (9 grade II; 14 grade III; 23 grade IV). Asterisks represent statistical significance (** P < .01; *** P < .001). (C) Arginase activity was plotted against S100A8/9 serum levels. Patients with a grade II, III or IV glioma represented by straight triangle, inverted triangle or dots respectively and the line represents the correlation. (D and E) The S100A8/9 concentration (D) and the arginase activity (E) were plotted against the time of preoperative dexamethasone treatment. Relevant statistics of all glioma samples combined are incorporated into C, D, and E.
PMN-MDSCs Are the Main Arginase-expressing Population Within PBMCs
Since arginase activity was increased in the serum of glioma patients, we set out to determine which cell populations within PBMCs are the main producers of arginase. An increase in arginase-1 (Arg-1) expression was found in PBMCs from glioma patients compared with PBMCs from the HCs (Fig. 4A). Further analysis revealed that Arg-1 expression was only significantly increased in total PBMCs of patients with a grade IV glioma (Fig. 4B). Arg-1 expression of FACS-sorted myeloid cells revealed a relative low expression in CD33+MHC-II+ cells and a somewhat higher expression in M-MDSCs, (Fig. 4C). Strikingly, with expression levels >1700 times as high as M-MDSCs, PMN-MDSCs showed extremely high levels of Arg-1 mRNA. Furthermore, Arg-1 mRNA expression within PBMCs was found to be correlated with the percentage of PMN-MDSCs (Fig. 4D) but not with the percentage of M-MDSCs (Fig. 4E). Preliminary data do not suggest a difference in Arg-1 mRNA levels in PMN-MDSCs from glioma patients with different tumor grades, which would be consistent with the arginase activity in serum.
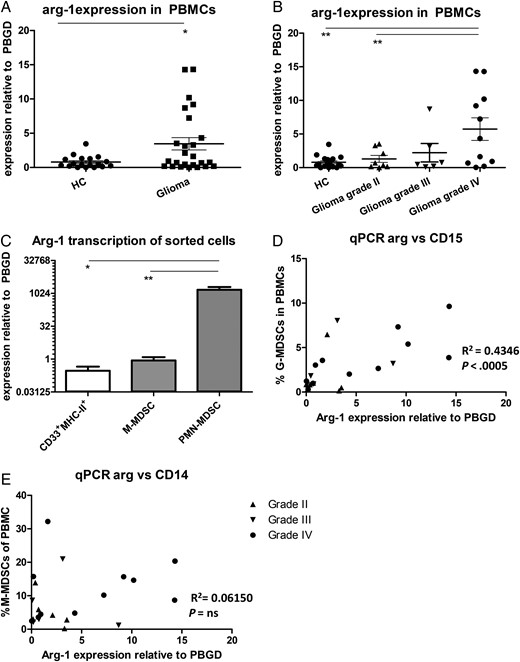
Arginase is highly expressed by PMN- myeloid-derived suppressor cells (MDSCs). (A and B) Expression measured by quantitative (q)PCR with Ct values of arginase were plotted as relative value to porphobilinogen deaminase (PBGD). Data of glioma patients was either combined (A) or divided based on tumor malignancy (B) (grade II (n = 8; straight triangles), 3 (n = 6; inverted triangles) or 4 glioma (n = 11; dots) and compared with healthy controls (HCs; (n = 18)). Asterisks represent statistical significance (*P < .05; **P < .01). (C) Arginase expression of fluorescence-activated cell sorting (FACS); sorted myeloid cells of glioma patients were measured by qPCR and plotted as relative value to porphobilinogen deaminase (PBGD). Plotted is mean with standard error of the mean (SEM) of 6 patients. (D and E) The percentage of PMN-MDSCs (D) or M-MDSCs (E) in the blood was plotted against Arg-1 mRNA expression in total PBMCs. Relevant statistics of all glioma samples combined are incorporated into D–E.
PMN-MDSCs in Tumor Tissue Express S100A8/9 and Arginase
Since S100A8/9 has been described as a chemoattractant for MDSCs, we determined the S100A8/9 protein expression in tumor tissue aspirates of 6 tumor samples by flow cytometry. Due to staining limitations, we were unable to maintain the staining strategy of Fig. 1D. We detected S100A8/9+ cells within viable cells from the tumor tissue cell suspension (Fig. 5A, left panel). Further analysis revealed that this S100A8/9 expression originated from MHC-II−CD15+ cells (PMN-MDSCs) (Fig. 5A lower right panel), since no signal for S100A8/9 above background was found in the other populations (Fig. 5A remaining panels).
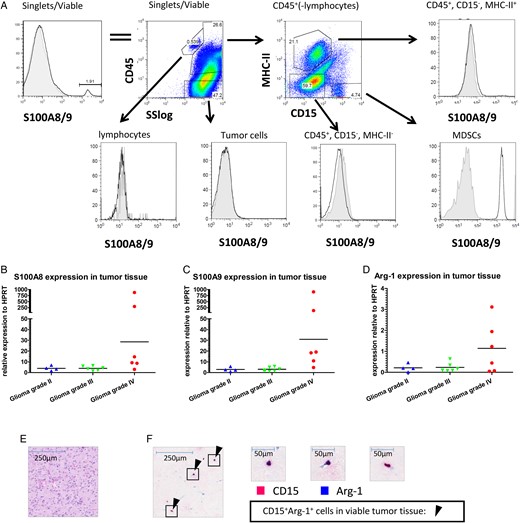
S100A8/9 and arginase expression in tumor tissue. (A) Tumor tissue single cell suspensions were stained as described and analyzed using flow cytometry. Single, viable cells were plotted for S100A8/9 (top left panel) and subsequently plotted for CD45 expression against the sideward scatter (SS; top second panel). CD45+ cells excluding lymphocytes were plotted for CD15 and MHC-II (top third panel). Lymphocytes (CD45+SSlow) (bottom left panel), tumor cells (CD45−) (bottom second panel), CD45+MHC-II+ (top right panel), CD45+MHC-II−CD15− (bottom third panel) and PMN-MDSCs (CD45+CD15+MHC-II−) (bottom right panel) were plotted for S100A8/9 expression. A representative plot from 6 donors measured is displayed. (B–D) S100A8 (B), S100A9 (C) and arginase (D) expression of tumor tissue single cell suspension was measured by qPCR with Ct values plotted relative to HPRT in a scattered plot. Grade II (n = 4; blue triangles), grade III (n = 6; green triangles) or grade IV gliomas (n = 7; red dots) were grouped. (E&F) H&E staining (E) or IHC double staining (F) with CD15 (pink) and arginase (blue) (original magnification x50) of glioma histological sections. Arrows highlight some CD15+arginase+ cells. Three frames from the IHC double staining are further enlarged (x400).
Furthermore, we found expression of S100A8, S100A9, and Arg-1 mRNA by qPCR within tumor tissue (Fig. 5B–D). S100A8 and -A9 expression was very high in tissue samples of 2 grade IV glioma patients, but the S100A8 and -A9 expression in the remaining grade IV glioma samples were more similar to those in grade II and III glioma samples. Of note, these 2 samples with the highest S100A8 and A9 expression were not the samples with the highest Arg-1 expression. Arg-1 mRNA expression measured in GBM correlated to the amount of PMN-MDSCs in the tumor (Supplementary material, Fig. S3A). Additionally, high expression of Arg-1 was found in sorted PMN-MDSCs from 2 grade IV glioma patients (data not shown), with expression levels of roughly one-fourth of Arg-1 expression blood derived MDSCs. Finally, IHC was used to observe CD15 and arginase double positive cells within tumor tissue (Fig. 5E, F and Supplementary material, Fig. S3). As observed previously,13 the majority of these cells were present in necrotic areas. These data indicated (similar to PMN-MDSCs from the blood) that tumor-infiltrating PMN-MDSCs also express arginase and S100A8/9.
PMN-MDSCs Suppress T Cell Function
Since PMN-MDSCs is the main glioma-infiltrating MDSC subpopulation and PMN-MDSC numbers are increased in the blood of GBM patients, we set out to explore their potency to contribute to a suppressive tumor microenvironment. T cells within PBMCs depleted of CD15+ cells were stimulated with anti-CD3/anti-CD28 conjugated beads (Fig. 6A, lower left panel). As a control, CD20+ B cells were depleted to correct for the MACS procedure (Fig. 6A, lower right panel). CD15-depleted PBMCs produced more IFN-γ than total PBMCs or CD20-depleted PBMCs when stimulated, showing that the CD15+ cells can efficiently suppress IFN-γ production (Fig. 6B).
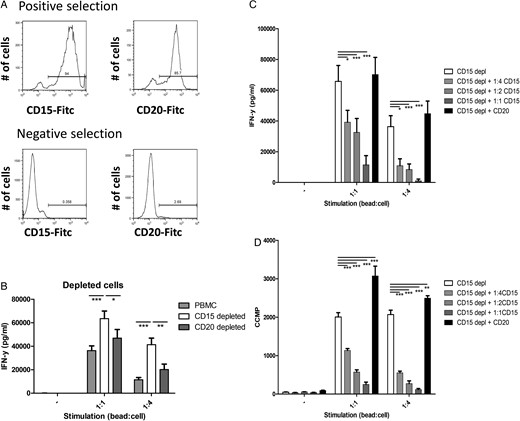
Polymorphonuclear (PMN)- myeloid-derived suppressor cells (MDSCs) from glioma patients suppress T cell function. (A) Representative histograms of positively (top panels) and negatively (bottom panels) MACS-sorted populations, sorted for CD15 (left panels) or CD20 (right panels). (B) Secreted IFN-y of peripheral blood mononuclear cells (PBMCs) not stimulated or stimulated with anti-CD3/anti-28 beads in a 1:1 or 1:4 ratio (1 bead: 4 cells). Data of total PBMCs (light gray), CD15 depleted PBMCs (white) or CD20 depleted PBMCs (dark grey) with error bars representing standard error of the mean (SEM). (C and D) Secreted IFN-y and tritium incorporation (D) of CD15 depleted PBMCs. Data are shown for CD15 depleted PBMCs (white), CD15 depleted PBMCs + CD15+ cells (1:4(light gray), 1:2 (gray) or 1:1 (dark gray)), CD15 depleted PBMC's + CD20+ cells (1:1 (black)). Cell ratio 1:2 (or 1:4) represents ratio of CD15 depleted PBMCs:CD15+ cells. Data of 3 independent experiments with each 3 replicates are combined. Asterisks represent statistical significance (*P < .05; **P < .01; ***P < .001) compared with CD15 depleted PBMC samples.
Additionally, CD15+ isolated cells (Fig. 6A, upper left panel) were used to supplement the CD15-depleted PBMCs. IFN-γ secretion by stimulated PBMCs was dose-dependently inhibited by the CD15+ cells (Fig. 6C). Adding equal amounts of isolated CD20+ cells (Fig. 6A, upper right panel) to compensate for the total number of cells did not reduce IFN-γ secretion (Fig. 6C). Proliferation data measured by tritium incorporation showed similar results for both experiments (Fig. 6D and data not shown). These data show that cells with a PMN-MDSC phenotype from the blood of glioma patients efficiently suppress T cell function in vitro.
Discussion
Induction of immune suppression by a neoplasm sustains tumor growth while hampering anticancer therapies, especially immunotherapy. In this study, the prevalence and activation status of MDSC populations in blood and tumor tissue of patients with glioma were investigated. Our data showed significant increase of both M-MDSCs and PMN-MDSCs in the blood of GBM patients and a possible trend towards increasing MDSCs with increasing tumor grade. Intracellular expression of S100A8/9 was already increased in M-MDSCs from low-grade glioma patients (similar to S100A8/9 serum values and arginase activity); however, these values were not predictable for the percentage of intratumoral MDSCs. Within tumor tissue, predominantly PMN-MDSCs were found, which express high levels of S100A8/9 and arginase mRNA and were comparable to what we found for blood-derived PMN-MDSCs. Additionally, we showed that blood-derived PMN-MDSCs potently suppressed T cell function in vitro. Our data implicate that both PMN-MDSCs and M-MDSCs might be involved in the tumor-induced immune suppression in blood, while PMN-MDSCs are most likely the MDSC subpopulation involved in the local immune suppression in the tumor. Future research should reveal whether one subset is more important than the other.
For several solid tumors, increased MDSC percentage was found to be associated with reduced survival.25–28 In our study, the mean percentages of MDSCs in blood was significantly increased in GBM patients when compared with the HCs; however, not all GBM patients had increased MDSC numbers in their blood. Although not all survival data are yet known, no statistically significant difference was observed between patients surviving longer or shorter than one year (Supplementary material, Fig. S4), although there was a trend toward higher percentage of MDSCs in the blood of patients with a shorter survival. Beside the tumor grade, it will be interesting to see whether increase of MDSCs correlates with one of the molecular subtypes of gliomas described by Verhaak et al. 2010.29,30
Dexamethasone is a strong glucocorticosteroid drug with anti-inflammatory and immunosuppressant effects. It is administered to brain-tumor patients one day prior to surgery in order to reduce edema.31 After surgery, the use is quickly tapered. Some patients received dexamethasone for a longer period of time before surgery because of symptoms resulting from extensive edema. The duration of dexamethasone treatment was correlated to the increase of MDSCs in blood of glioma patients, a phenomenon discussed by us previously,13 and also described in mice.32 It remains to be elucidated whether the dexamethasone treatment is responsible for the increase of blood MDSC observed or whether patients with a higher tumor burden who require dexamethasone longer before surgery have a higher percentage of MDSCs in their blood due to their higher tumor load. Furthermore, Liao et al. described a role for dexamethasone in MDSC recruitment and increased MDSC-suppressive activity in mice.33 We did not find a correlation between dexamethasone and MDSC accumulation within tumor tissue, nor could we find an effect of the duration of dexamethasone treatment on S100A8/9 or arginase expression. This indicates that dexamethasone might be involved in MDSC accumulation in the blood (possibly by recruitment from the bone marrow), but so far evidence for involvement of dexamethasone in activation of MDSCs or their recruitment to the tumor is lacking.
Patients with GBM had increased activity of arginase and S100A8/9 serum values and increased percentages of MDSCs in their blood. Comparably, a correlation between S100A8/9 plasma levels and circulating MDSC was already described for patients with gastric cancer.34 However, we could not find a correlation between the intracellular S100A8/9 expression and the observed serum values (data not shown). These data indicate that MDSC function may be altered before the MDSC increase in number. In non–small cell lung cancer (NSCLC), the level of S100A9 expression by CD11b+CD14+ cells correlated with their suppressive ability.35 S100A8/9 can be upregulated in a STAT-3 dependent manner, which can also regulate arginase expression.36,37 Although we found increased expression of S100A8/9, it remains elusive whether MDSCs from glioma patients are more suppressive than their counterparts in healthy controls, or that solely the increase in MDSC number contributes to the increased immunosuppressive environment.
Beside expression in MDSCs, S100A8 and S100A9 expression has also been described for various tumor cells, including glioma,38,39 and S100A8/9 levels have been measured within glioma tissue. However, it is not clear whether these proteins originated from tumor or tumor-infiltrating immune cells.40,41 In our intracellular S100A8/9 FACS staining of tumor tissue, we could only observe a signal above background in CD45+MHC-II−CD15+ cells, indicating that PMN-MDSCs are the only cells in glioma tissue expressing this heterodimer, although we cannot exclude that other cells potentially express S100A8/9 at much lower levels or have already secreted this protein at the time of staining. Indeed, low levels of S100A8/9 can be advantageous for the tumor by promoting cell growth and angiogenesis,19,42,43 whereas high concentrations cause cell death, especially in tumor cells.44,45
Beside S100A8/9, tumor-derived PMN-MDSCs express arginase, and blood-derived PMN-MDSCs are by far the dominant cell population expressing arginase and are very capable in suppressing T cell function. This is in line with arginase being an important mechanism of suppression for MDSCs, especially for PMN-MDSCs,38,46,47 and strongly suggestive that these cells can suppress T cells locally in the tumor microenvironment. Altogether, our data indicated that PMN-MDSCs are increased in blood and tumor tissue of GBM patients and that these cells are potent in suppressing T cell function, thereby hampering anticancer immunotherapy. By gaining better in-depth understanding of immune suppression in patients with a brain tumor, we may add to the increasing knowledge about the clinical effects of immunotherapy.7,48
Funding
This work was supported by grants from the STOPbraintumors Foundation, COST (EU) and the Radboud Institute for Oncology to Gosse Adema and Pieter Wesseling.
Conflict of interests statement. None declared.
References


