


Abstract
Neurocutaneous melanocytosis (NCM) is characterized by clonal nevomelanocytic proliferations in the CNS and skin. Given the scarcity of effective therapeutic targets, testing new drugs requires a reliable and reproducible in vitro cellular model of the disease.
We generated nevomelanocytic spheroids in vitro from lesions of the spinal cord, brain, and skin from 4 NCM patients. Nevomelanocytic cells were grown as monolayers or spheroids and their growth characteristics were evaluated. Cultured cell identity was confirmed by demonstration of the same NRAS mutation found in the original lesions and by immunophenotyping. Nevomelanocytic spheroids were treated with inhibitors of specific mediators of the NRAS signaling pathway (vemurafenib, MEK162, GDC0941, and GSK2126458). Drug sensitivity and cell viability were assessed.
Cultured cells were growth-factor dependent, grew as spheroids on Geltrex matrix, and maintained their clonogenicity in vitro over passages. Skin-derived cells formed more colonies than CNS-derived cells. Inhibitors of specific mediators of the NRAS signaling pathway reduced viability of NRAS mutated cells. The highest effect was obtained with GSK2126458, showing a viability reduction below 50%.
NRAS mutated cells derived from clinical NCM samples are capable of continuous growth as spheroid colonies in vitro and retain their genetic identity. Drugs targeting the NRAS signaling pathway reduce in vitro viability of NCM cells. NCM lesional spheroids represent a new and reliable experimental model of NCM for use in drug testing and mechanistic studies.
Neurocutaneous melanocytosis (NCM) is a rare congenital disease characterized by clonal proliferations of nevomelanocytes involving the skin—manifesting as large/giant congenital melanocytic nevi (L/GCMN)—and the CNS.1,2 Somatic mutation in codon 61 of NRAS3 is present in about 80% of NCM patients. Recently, our group also identified BRAF mutation (without NRAS mutation) in some patients.4 Although first described in 1861, NCM remains without effective therapy. Hydrocephalus is usually treated with surgical approaches, but progressive disease continues to be a challenge. The presence of diffuse leptomeningeal NCM deposits correlates with reduced survival and significant risk for primary CNS melanoma.5 The disease sits somewhere in between the ends of a spectrum in the biology of melanocytic neoplasia, where the normal melanocyte (in the skin or the meninges) represents the benign and fully differentiated cell, while the opposite end of the spectrum is represented by melanoma. Although many patients born with L/GCMN remain neurologically asymptomatic despite an imaging diagnosis of NCM with documentation of leptomeningeal and/or brain melanin deposits, once neurologic symptoms appear, the prognosis becomes grim, and lethal outcomes predominate in those patients. Some patients with NCM develop lesions histologically identifiable as “malignant melanoma,” although many show a more benign-looking phenotype despite clinical progression of the disease.6
Tumor-spheres are believed to preserve cancer stem cells in culture by allowing them to divide clonogenically. Tridimensional growth of cancer cells as “tumor-spheres” has been well documented in a wide range of solid tumors, including breast, lung, colon, prostate, pancreas, and ovarian cancers.7,8 The presence of clonogenic cells with proliferative and self-renewal abilities has been recently reported in lesions of L/GCMN.9 In this context, any therapeutic agent that aims to target clonogenically proliferating cells in L/GCMN or NCM would have to be tested in a model that preserves the clonogenic properties of these cells in culture. We hypothesized that if NCM lesional cells could be grown as nevospheres, they would represent a more appropriate in vitro model than monolayer cultures to study drug sensitivity of these cells.
Here we report, for the first time, the growth and culture of clonogenically growing NRAS mutated melanocytic cells as nevospheres from patients with NCM. We use this in vitro model to identify potential drug candidates for treatment of NCM and to study NCM cell viability when treated with inhibitors of specific mediators of the NRAS signaling pathway.
Materials and Methods
Reagents and Antibodies
Anticancer drugs used in this study included Raf kinase inhibitor—vemurafenib; mitogen-activated protein kinase kinase (MEK) inhibitor—MEK162; phosphatidylinositol-3 kinase (PI3K) inhibitor—GDC0941 (or pictilisib, a selective PI3K α/δ inhibitor); and PI3K inhibitor GSK2126458 (omipalisib or GSK458, selective inhibitor of p110α/β/γ/δ). All these drugs were purchased from Selleck Chemicals. Recombinant Wnt3a was obtained from R&D Biosystems. Antibodies used included anti-phospho p44/42 mitogen-activated protein kinase (MAPK) (extracellular signal-regulated kinase [ERK]1/2) (Thr202/Tyr204), anti-phospho Akt (Ser473), anti-phospho S6 ribosomal protein (Ser235/236), and anti–E-cadherin from Cell Signaling Technology. Anti–β-actin was from Sigma Aldrich. Anti–microphthalmia-associated transcription factor (MiTF) (C5/D5) was from Ventana Medical Systems.
Additional details of materials and methods can be found in the Supplementary material.
Patients and Neurocutaneous Melanocytic Tissue Samples
Clinical data and melanocytic tissue lesions from 4 patients with NCM were prospectively collected following a standardized protocol. Informed written consent was obtained from parents in all cases, and the study was approved by the institutional review board of the University of Pittsburgh (IRB- PRO10030357) after all ethical considerations were met. Fresh tissues from melanocytic lesions were received in Roswell Park Memorial Institute medium. One fragment of this tissue was fixed in 10% formalin, paraffin embedded, and sectioned for histological analysis. Hematoxylin and eosin (H&E)–stained slides were reviewed to confirm the diagnosis. Another fragment was prepared for tissue culture.
Size categorization of the congenital melanocytic nevus (CMN) was performed according to Krengel et al.10 The diagnosis of NCM in our study was established by pathological review of melanocytic lesions from the CNS and skin or was based on MRI performed in the first year of life.5
Cell Culture and Nevosphere Formation
Nevomelanocytes were isolated from patients’ tumors following previously described procedures.11,12 For nevosphere formation, monolayer cells were seeded onto Geltrex matrix (Life Technologies) and incubated for 2–4 days. The detailed method is described in the Supplementary material.
Mutation Analysis
DNA was extracted using standard techniques, and mutations at NRAS codon 61 and BRAF codon 600 were analyzed in tumor tissues as well as cultured cells using the amplification refractory mutation system–PCR method described previously13 and confirmed by Sanger. Tumor tissues from 2 patients were studied using the Ion AmpliSeq Cancer Panel confirmed by Sanger sequencing (details are described in the Supplementary material).
In vitro Cell Viability Assay
Cell survival after drug treatments was determined by assay with MTT (3-(4,5-dimethylthiazol-2-yl)-2,5-diphenyltetrazolium bromide) using the Cell Titer 96 Non-Radioactive Cell Proliferation Assay kit (Promega) according to manufacturer's instructions. The detailed method is described in the Supplementary material.
Immunohistochemistry and Immunofluorescence
Immunohistochemistry in tissue was performed on the Ventana BenchMark XT automated staining platform (with controlled and standardized conditions) following the manufacturer's instructions, with positive and negative controls. For immunofluorescence, monolayer cultured nevocytes as well as 3D cultured nevospheres were fixed in 4% paraformaldehyde for 15 min followed by 3 washes in phosphate buffered saline. Cells were blocked with 10% goat serum for 1 hr at room temperature followed by incubation with primary antibodies overnight. Antibodies used for both procedures are mentioned in the Supplementary material.
Immunoblotting
Nevospheres were lysed in lysis buffer containing 50 mM Tris-HCl, pH 7.4, 5 mM EDTA, 0.1% sodium dodecyl sulfate, 1% Triton X-100, 0.5% sodium deoxycholate with phosphatase, and protease inhibitors (Roche), and cell lysates were used to run western blot with indicated primary antibodies following standard procedures (the detailed method is described in the Supplementary material).
Statistical Analysis
All experiments were repeated at least 3 times. Paired Student's t-test or ANOVA with the Tukey test for post hoc multiple comparisons was used. The statistical significance of differences was evaluated using SPSS 20.0, and significance was set at P < .05.
Results
Clinical and Histological Features of the NCM Patients
Clinical and tissue characteristics of the 4 NCM patients from whom the cells were used in this study are summarized in Table 1.
Clinical and melanocytic lesion characteristics
| Sample | Age | Sex | Main Nevus Size* | Method for NCM Diagnosis | NCM Symptoms | Prior Therapy | Tissue Mmelanocytic Lesion Site | Tumor Mutation | Follow-up Time |
|---|---|---|---|---|---|---|---|---|---|
| P01S | 1 y 5 mo | Male | G2 | MRI/autopsy | Hydrocephalus | Sorafenib, temozolomide, and radiation | Spinal cord | NRAS p.Q61R | Autopsy |
| P09B | 6 y | Male | L2 | MRI/autopsy | Seizure | Brain surgery | Frontal lobe | NRAS p.Q61K | Autopsy |
| C76N | 1 y 9 mo | Male | G2 | MRI | No | Surgery | Skin | NRAS p.Q61K | 1 y 5 mo |
| PD1N | 2 y 5 mo | Male | G2 | MRI | Tethered cord | Surgery | Skin | NRAS p.Q61K | 2 y |
Main nevus size categorization according to Krengel et al.10
Patients C76N and PD1N are alive and have no melanoma. In both, NCM diagnosis was established by MRI and/or by the presence of neurologic symptoms (Table 1). Patient C76N has a massive garment-like nevus involving his entire trunk and multiple “satellite” lesions (Fig. 1A). The histological review of his nevus showed massive dermis and subcutaneous proliferation of nevus cells with increased amount of collagen (Fig. 1E).
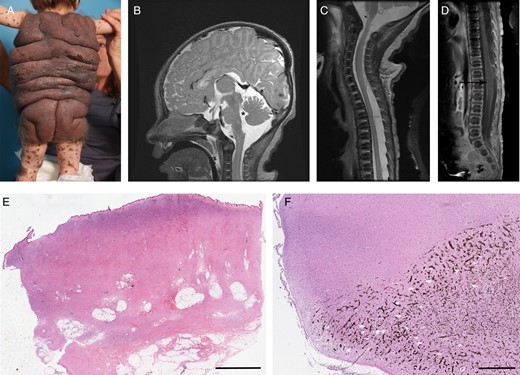
(A) Massive garment-like giant nevus (patient C76N). (B) Sagittal MRI with contrast of patient P01S showing dilatation of fourth ventricle (asterisk) and leptomeningeal melanocytic deposits (arrow). (C) Sagittal MRI image of the upper spinal cord (patient P01S). Note the increased signal around the spinal cord. (D) Sagittal MRI image without contrast of the lower spinal cord (patient P01S). A syrinx is noted at the lumbar level (arrow). (E) Skin nevus from patient C76N showing massive dermis and subcutaneous proliferation of nevus cells with increased amount of collagen (scanned image, H&E, 0.6×, scale bar = 5 mm). (F) Hippocampus with extensive pigmentation due to invading melanocytic cells in patient P09B (scanned image, H&E, 0.6×, scale bar = 1 mm).
Patient P01S was born with a giant CMN with melanocytic lesions in brain and spinal cord and a proliferative nodule in the abdomen. He had a rapidly progressive disease and died at age 1 year 5 months. A full autopsy was performed that demonstrated systemic metastatic melanoma. Lesions in the brain and spinal cord of this patient can be seen in MR images (Fig. 1B–D; a complete report of this case is in press in Melanoma Research at the time of preparation of this manuscript). Patient P09B had a large CMN, neurological symptoms (seizures), and diffuse leptomeningeal deposits. He died at 6 years of age—full autopsy was performed that showed primary brain melanoma.
Melanocytic tumor DNA from all 4 cases showed mutation in codon 61 of NRAS where glutamine in the wild type was replaced by either arginine (R) or lysine (K) (Table 1). All samples were negative for BRAF V600E mutation.
The Ion AmpliSeq Cancer Panel in melanocytic tumor from patient P01S and C76N showed no other oncogenic mutations.
Morphological Characteristics of Tumor Cells from NCM Patients
Nevomelanocytic cells from tumors of the 4 NCM patients were isolated following previously described procedures.11,12 Cells were allowed to grow in monolayer for weeks under defined conditions until reaching confluence. P01S cells were derived from a spinal cord tumor, P09B were derived from a brain lesion, and both C76N and PD1N were derived from skin lesions of NCM patients (Fig. 2, top row). Cells grown in vitro from the patients' tumors showed the same mutation, confirming their genetic identity. P01S was positive for NRAS p.Q61R and all others were positive for NRAS p.Q61K (Table 1). These monolayer cultures featured no major differences in morphology. Cells growing in monolayer were dendritic (bi- or tripolar) with occasional large multipolar cells containing big nuclei. Phase contrast photomicrographs show a phenotype similar to previously described phenotypes of congenital nevi cells grown as primary cultures,12 which contain melanin when viewed under bright field and are free from contaminating fibroblasts and keratinocytes (Fig. 2, second row). These cells continued to express melanocytic marker MiTF, similar to the parent lesion from which they were derived. MiTF was found exclusively localized in the nuclei, as determined by immunohistochemistry in the parent lesions and immunofluorescence on the in vitro cultured cells (Fig. 2, third row).
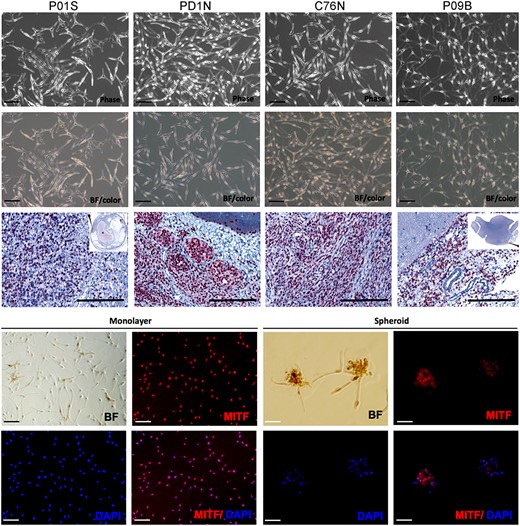
Characterization of patient-derived NCM cells. Upper panel shows phase contrast photomicrographs (Phase) of primary culture of NCM cells from melanocytic lesion of 4 patients. The second row shows bright field (BF/color) pictures of the same cells showing the presence of brown melanin pigment (scale bar = 50 μm). Third row shows MiTF immunohistochemistry with diaminobenzidine chromogen and Mayer's hematoxylin counterstain in lesional tissues from where each NCM cell line derives. P01S: spinal cord, PD1N: skin, C76N: skin, P09B: brain (scanned image, H&E, 0.6×, scale bar = 200 μm). The 2 lower rows show BF pictures and MiTF (red) immunofluorescence in nevocytes cultured as monolayer and spheroids. Nuclei are counterstained with DAPI (4′,6-diamidino-2-phenylindole). Scale bar represents 50 μm.
After an initial period of quiescence, clones of cells emerged from each culture that continued to grow with varying degree of proliferative ability. After they entered the steady period of growth, their population doubling time increased for 2–3 passages and then entered a period of constant population doublings. The cells achieved 2.5 to 4 population doublings during 6 weeks before reaching a period of constant growth (Supplementary Fig. S1A). For all the NCM cell lines, the time it took for the cells to start dividing after the initial period of quiescence (referred to here as the culture initiation time) was between 2 and 2.5 weeks (Supplementary Fig. S1A, inset). The population doubling time of these cells ranged 7–15 days during the period of constant growth (Supplementary Table S2), and all experiments were performed during this period. These cells, derived from NCM lesions, are greatly dependent on the set of growth factors and mitogens, in agreement with previous observations in congenital nevi.9,11,12 The cells demonstrated a sharp drop in the expression of G1/S cell cycle mediator cyclin D, as well as MiTF, when deprived of the defined growth factors and mitogens for 48 h. Reduced phosphorylation of protein kinase C and c-Jun N-terminal kinase, both known to be upregulated during growth factor stimulation, was also observed (Supplementary Fig. S1B, right panel). Cell division was halted and cell viability reduced to ∼50% in the basal medium compared with the complete medium, as revealed by MTT cell viability assay (Supplementary Fig. S1B, left panel). NCM cells in culture could be induced to proliferate at a higher rate by exogenous Wnt3a at 40 ng/mL dose, compared with vehicle-treated control. All cell lines examined here showed ∼1.2- to 1.4-fold increase in cell viability when treated at the mentioned dose. However, increasing the dose to 100 ng/mL did not further increase proliferative ability (Supplementary Fig. S1D).
Neurocutaneous Melanocytic Cells Grow as Nevospheres
The presence of clonogenic cells with proliferative and self-renewal abilities has been recently reported in L/GCMN.9 We demonstrate that NCM lesional cells exhibit anchorage-independent growth in a 3-dimensional culture environment when allowed to grow on Geltrex matrix. Geltrex LDEV (lactate dehydrogenase-elevating virus)–free reduced growth factor basement membrane matrix allows anchorage-free growth of cells. NCM cells from all 4 cell lines showed, on phase contrast photomicrographs, tightly packed cells forming compact colonies when grown in the presence of complete medium over a period of 4 days. Bright field images show the presence of brown melanin in the cells within the colony (Fig. 3, upper row). NCM lesional cells did not show any significant difference in their colony-forming ability when allowed to grow on soft agar in comparison with Geltrex matrix (Supplementary Fig. S2). This self-assemblage was a biological phenomenon and not just simple aggregation, as indicated by redistribution of E-cadherin: from predominantly nuclear in monolayer cells to a much more diffuse cytosolic to membranous localization in the spheroid colonies. Figure 3 (second row) shows differential localization of E-cadherin from one of the NCM cell lines.
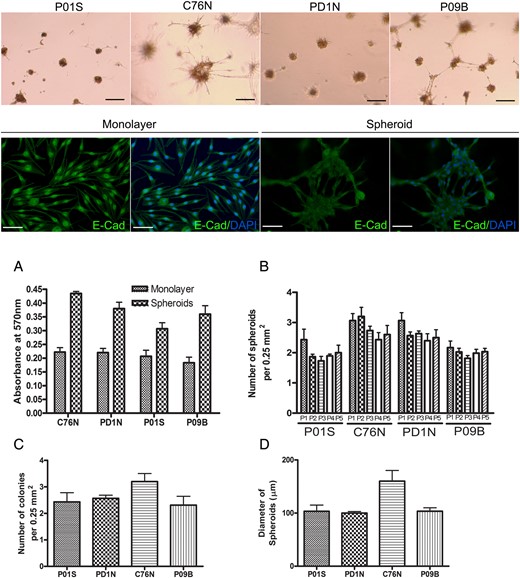
Anchorage-independent growth of patient-specific tumor cells as tumor spheroids. Upper row panel shows bright field pictures of nevus cells (containing brown melanin pigment) growing as spheroids when seeded on Geltrex growth factor–free basement membrane matrix (scale bar = 100 μm). Second row, immunofluorescence for E-cadherin (green) in monolayer cells (left panel) showing a nuclear localization vs spheroids (right panel) showing a more cytosolic and membrane localization in C76N cells. Nuclei were counterstained with DAPI (4′,6-diamidino-2-phenylindole) in blue (scale bar = 100 μm). Graphs show: (A) nevus cells grown as spheroids had higher cell proliferation rate (as measured by MTT cell proliferation assay) compared with monolayer (P < .001 for all cell lines). (B) Change of clonogenicity over passages. The number of spheroids formed after each passage from each cell is similar up to 5 passages (P > .05 for all cell lines). (C) The number of colonies formed from each cell line after seeding ∼50 000 cells per well in a 24-well plate is similar (P = .085). Colonies were counted after staining with crystal violet and averaged per 0.25 mm2. (D) Average size of the spheroids (y-axis represents diameter in μm) formed from each patient sample after 96 h of growth on Geltrex matrix. C76N shows bigger spheroids compared with the other cell lines (P = .017).
Cells from NCM lesions exhibited a higher proliferative rate when grown on Geltrex matrix than as a monolayer. All cell lines showed increased cell survival in the spheroids compared with monolayers when an equal number of cells was seeded (Fig. 3A). Skin-derived cell lines (C76N and PD1N) formed more colonies than CNS-derived cells (P01S and P09B) when an equal number of cells were seeded (Fig. 3B and C). The diameter of the colonies was different among the cell lines, with C76N forming the largest spheroids among the 4 cell lines studied (Fig. 3D). However, these numbers did not have significant change over passages, and spheroid colonies followed over 5 consecutive passages maintained the size and number of newly formed colonies. These data suggest that NCM lesional cells maintain their clonogenicity in vitro over passages; however, the size of the spheroids did not grow indefinitely. These observations are in line with recent observations by Charbel et al9 in L/GCMN cells.
Drug Sensitivity of NRAS Mutated NCM Cells
In this study, 4 drugs which inhibit specific mediators of the NRAS signaling pathway (vemurafenib, MEK162, GDC0941, and GSK2126458) were used to treat patient-derived NRAS mutated NCM cells grown in spheroids. Figure 4 shows reduction in viability of tumor cells with increasing dosage of each drug. All the NCM cell lines studied showed sensitivity to the drugs used, with GSK2126458 showing the most potent effect. Half-maximal inhibitory concentration (IC50) calculated from the viability curves corroborate this observation (Supplementary Table S1). GSK2126458 had the lowest IC50 values in all the cell lines, ranging from 4.24 to 7.08 µM, with little variation across cell lines. Vemurafenib could only impact viability at higher concentrations, which is not dose dependent and could be due to general toxicity, as evident by lower β-actin levels (Fig. 4E). IC50 ranged from 9.3 to 16.58 μM, which are lower than the values for MEK162 and GDC0941 used in the study. Of note, GSK2126458 affected cell viability in all the cell lines at relatively low concentrations. However, cell viability did not decrease further in a dose-dependent manner at the higher concentrations. Treatment by both MEK162 (MEK inhibitor) and GDC0941 (PI3K inhibitor) led to modest reduction in cell viability with higher IC50 values than GSK2126458 in all the cell lines studied. Response to GDC0941 was noted to be cell-line specific, with P01S being the most resistant, with an IC50 of 51.84 μM, and C76N being the most responsive with an IC50 of 13.7 μM.
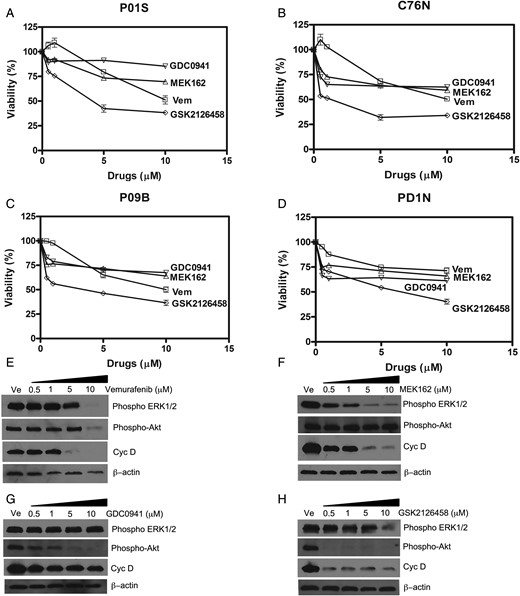
(A–D) Drug sensitivity of NCM cells in 4 NCM cell lines grown as tumor spheroids and treated with drugs: Vem (vemurafenib, BRAF inhibitor), MEK162 (MEK inhibitor), GDC0941 (PI3K inhibitor), and GSK2126458 (Akt and mToR inhibitor). Cell viability was determined by MTT assay after 96 h of incubation with drugs or dimethyl sulfoxide (DMSO). Viability of DMSO-treated cells was considered 100%. IC50 values were calculated by plotting percent viability of treated cells against DMSO (vehicle)-treated controls. These values are mentioned in Supplementary Table S1. (E to F) Effect of inhibitor drugs on downstream signaling in NCM cell spheroids from C76N. Spheroids were treated/or not with increasing concentrations of the drugs and harvested after 48 h of treatment. Cell lysates were prepared in the presence of protease and phosphatase inhibitors, and equivalent amount of protein was loaded to each well. Western blots were probed with phospho-specific antibodies targeted to phospho-ERK1/2, phospho-Akt and cyclin D. β-actin was used as loading control.
To confirm that the targets of the drugs are expressed in these NCM cells, phosphorylation of downstream kinases was evaluated by immunoblot using phospho-antibodies against specific phosphorylated residues on the target proteins. Vemurafenib treatment could not inhibit ERK1/2 or Akt phosphorylation (Fig. 4E) except at the highest dose (10 μM). This could be due to general toxicity resulting from the higher dose of the drug, as evidenced by the lower total protein in those lanes represented by lower β-actin (loading control). Figure 4F shows that ERK1/2 phosphorylation decreased upon treatment with MEK162, with maximum decrease at 5 µM and no further decrease noted at the next higher dose. However, pAkt remained unaffected. Cyclin D expression, a marker of G1/S transition of the cell cycle, showed a concomitant decrease parallel to pERK1/2. GDC0941 could reduce Akt phosphorylation in a dose-dependent manner; however, cyclin D expression did not change significantly (Fig. 4G). The inability of GDC0941 to impact cyclin D expression could be explained by the fact that this drug is a specific inhibitor of the α and δ forms of the p110 subunit of PI3K with a modest selection against p110β and p110γ, and hence is a less potent inhibitor of Akt phosphorylation than GSK2126458. Interestingly, GSK2126458 abrogated Akt signaling by complete inhibition of Akt phosphorylation (ser 473) at 0.5 μM. Phospho-ERK1/2 remained unaffected, although a sharp decrease in cyclin D concomitant with pAkt was noted. Maximum decrease in cyclin D was at 0.5 μM, and thereafter it did not decrease any further with increased drug concentrations. These data indicated the contribution of both MAPK and PI3K-Akt signaling pathways in the in vitro survival of the NCM cells in this study, which may explain the viability of these cells under the studied dosage spectrum of the drugs used.
Shown in Fig. 5 are nevospheroids from C76N treated with 5 μM each of vemurafenib, MEK162, and GDC0941 and 0.5 μM of GSK2126458 compared with vehicle-treated control. These concentrations represented the lowest dose that produced maximum reduction in viability curves (Fig. 4). Vehicle-treated spheroids typically formed compact colonies with dendritic cells around the periphery, radiating outwardly. Spheroid size decreased upon drug treatment, with vemurafenib producing the least reduction. Interestingly, only vemurafenib-treated colonies lacked dendritic cells at the periphery, compared with the other drugs. MEK162 and GDC0941 could induce a modest reduction in nevosphere size with very little change in the basic morphology of the spheroid colonies. Notably, GSK2126458 treatment resulted in significantly smaller spheroid size (<25 μm average compared with 100 μm average in the vehicle control) at a relatively lower concentration (0.5 μM) in comparison with the other drugs. Additionally, GSK2126458 treatment prevented formation of compact nevospheres.
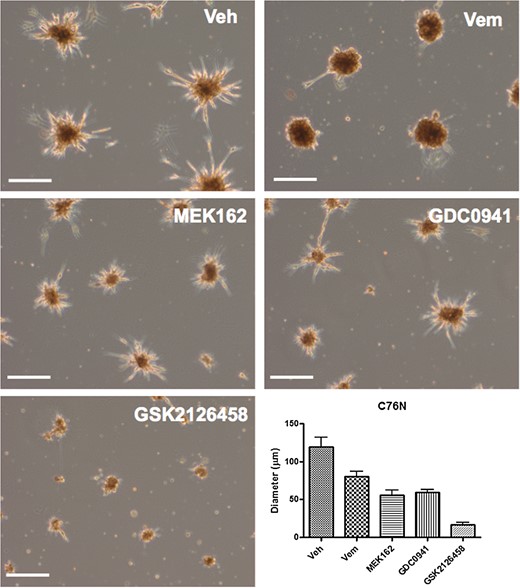
C76N-derived nevospheroids treated with vemurafenib (Vem), MEK162, GDC0941, and GSK2126458 as compared with vehicle (Veh)-treated control. Vehicle-treated spheroids show compact colonies with peripheral dendritic cells radiating outwardly. Spheroid size decreased mildly with 5 µM vemurafenib treatment, which also induced loss of dendritic cells at the periphery. Five-micromolar MEK162 and GDC0941 induced a modest nevosphere size reduction, with very little change in spheroid morphology. GSK2126458 treatment induced significant spheroid size reduction at a relatively lower concentration (0.5 μM) in comparison with the other drugs. Bar represents 100 µm.
Discussion
This is the first report using a new in vitro system of nevomelanocytes from NCM patients, with mutation in codon 61 of NRAS, to test inhibitors of specific mediators of the NRAS signaling pathway. Our results suggest a potential ability of these drugs, currently under investigation as therapeutic agents for melanoma, to decrease the viability of the NCM cells in vitro. Until recently, research on NCM has been impeded by the rarity of human samples and lack of in vitro and/or animal models. Drug discovery approaches involving high-throughput screening of potential drug candidates have so far not been possible for NCM due to the lack of a reliable in vitro model for this disease. The only reported cell line derived from NCM appeared to show characteristics of malignant melanoma in the brain in vivo and was growth-factor independent,14 hence not representative of classical NCM. More recent studies have reported propagation of human NCM cells in mouse xenografts.15 However, those cells were reported to be negative for oncogenic NRAS/BRAF mutations, which have been determined in recent studies from our laboratory and others to be hallmarks of NCM.3,4 Therefore, reliable in vitro cell-culture models representing NRAS/BRAF mutated NCM are highly needed for experiments to explore the therapeutic possibilities for NCM.
Primary cells from NCM patients’ tumors were allowed to grow in an environment that favored melanocytic growth. This prevented the growth of other cells present in the tumor tissue favoring only the growth of lesional nevomelanocytes. Cultured cells were examined for the presence of mutation for successive passages to confirm their genetic identity. Our results indicated that a defined set of growth factors was absolutely required for the survival and proliferation of NCM lesional cells in vitro. This is in contrast to previously described NCM cell lines,14,15 but in agreement with in vitro growth characteristics of L/GCMN cells.9,12
We also show here for the first time that NRAS mutant NCM cells still retain the ability to respond to exogenous Wnt. Many studies have shown the importance of Wnt signaling in the maintenance, proliferation, and migration of neural crest cells. Neural crest precursors depend on active Wnt signaling during early stages of development, with a decline in activity as the cells differentiate and give rise to mature melanocytes.16–18 We presumed that if the oncogenic mutation is acquired early in the developmental timeline, NCM cells might still retain their Wnt signaling pathway intact. In this study, in vitro treatment with recombinant Wnt3a led to a modest increase in proliferation in all our NCM cell lines. This increase is more pronounced when Wnt3a is used along with another specific set of growth factors and mitogens of the culture medium. The ability of Wnt3a to influence NCM cell proliferation indicates that nevomelanocytes in NCM lesions in this study were not fully differentiated and retained their responsiveness to exogenous Wnt ligand, resembling their neural crest precursors.
We have for the first time characterized NCM lesional cells for their clonogenic behavior in vitro on Geltrex. Intriguingly, NCM cells displayed a higher proliferation rate when cultured as spheroids compared with monolayers, indicating that a 3D culture environment could possibly provide a more appropriate measure of viability during drug-testing studies. This prompted us to develop a spheroid cell culture system to be used for in vitro drug sensitivity assays for cells from NCM lesions.
NRAS mutations have been studied extensively in cutaneous melanoma, in animal models and human clinical trials.19–21 Owing to the redundancy in cell survival signaling downstream from NRAS, effective therapy is still unavailable.22 To determine if currently investigated drugs against NRAS mutated melanoma would be effective against NRAS mutated NCM, we tested a set of drugs recently recognized as therapeutic approaches against NRAS mutated melanoma.
Vemurafenib, a potent BRAF inhibitor, has been extensively used and found to be successful against BRAF mutated melanoma.23 However, vemurafenib was not as effective in NRAS mutant cells.24 All 4 NCM cases reported in this study were found to be resistant to vemurafenib within the dose range studied. More recently, MEK162, an inhibitor for MEK in the MAPK pathway, has been found to be a potent inhibitor of tumor cell proliferation in NRAS mutated melanoma.25 In our NCM spheroid model, in addition to evidence that the MEK pathway is active in NCM cells, and that it was significantly inhibited by the treatment (Fig. 4B), MEK162 as a single agent could not reduce cell viability to <50%, even at the highest dose studied. This indicates that the cells could rely on another signaling pathway for their survival.
Recent studies have revealed the redundancy in cellular signaling downstream from oncogenic NRAS and provided evidence for PI3K-Akt and activation of mammalian target of rapamycinin (mTOR) melanoma cells.26 Recently, Ruan et al15 showed that the YP-MEL primary brain melanoma cell line with NRAS mutation was sensitive to PI3K and mTOR inhibitors in vitro. Therefore, we tested 2 drugs: GDC0941, a PI3K inhibitor selective for p110α/δ, and GSK 2126458, a recently reported highly potent inhibitor of the Akt and mTOR pathways.26,27 Our data indicate that GSK2126458 is a more potent inhibitor of cell proliferation than any other drug used in the study. This drug reduces Akt phosphorylation at a very low dose, compared with other drugs. It is interesting to note that phospho-ERK1/2 remains unaffected; however, cyclin D is inhibited concomitantly with Akt. This demonstrates the specificity of this drug against its targets but also points to the fact that PI3K-Akt signaling is the major mediator of cell survival in these cells, as opposed to MEK, which contributes only partially. Therefore, as a single agent, MEK162 could only partially attenuate NRAS signaling, leading to cell proliferation and survival in these cells. Among all the drugs tested, GSK2126458 affects spheroid colony growth by impacting the viability of cells within the colony. This could possibly explain its increased efficacy over the other drugs. However, viability does not decrease at higher doses, indicating again the redundancy of NRAS signaling. This implies that combinatorial therapy targeting these mediators all at the same time might improve the outcome. This may also increase the risk for potential toxicity. More work needs to be done to better understand the response of these NCM lesional cells to simultaneous blockade of the MAPK, PI3K, and mTOR pathways. We noted differential sensitivity of these 4 NCM cell cultures to the drug GDC0941, with the most resistant P01S (IC50 51.84 μM) differing widely from the most sensitive C76N (IC50 13.7 μM) in terms of IC50 values. This suggests an additional advantage of this patient’s cell-derived nevosphere model in addressing patient-specific differences in drug response, providing an important tool for preclinical testing of drugs for optimal patient response—an important step toward personalized/precision medicine.
In conclusion, we have demonstrated that patient-derived NRAS mutated NCM lesional cells grown as tumor spheroids can be used as a reliable in vitro cellular model for NCM, and potential therapeutic agents could be tested for their cytotoxicity in this model. Inhibitors of specific mediators of the NRAS signaling pathway currently under investigation as therapeutic agents in melanoma reduce growth of NRAS mutated NCM cells in vitro. PI3K-Akt appears to be a major mediator of cell survival in NCM lesional cells, growing as nevospheres and hence as a more potent therapeutic target than MEK. Spheroids derived from NCM patients in this study can now provide an important resource to the field of NCM research, and data from this study would be important in designing detailed future studies aimed at discovering pharmacological treatment options for this sometimes fatal disease.
Supplementary Material
Funding
This work was supported by the Marjorie K. Harmer Endowment for Research in Pediatric Pathology award (M.R-M.); a generous gift from Mr and Mrs Travis Bailey and Nevus Outreach, Inc. (M.R-M.); and grant no. I#0048403 from the Morgan Family Foundation through the Silicon Valley Community Foundation (C.M.S.).
Acknowledgments
We acknowledge the support of patients donating tissues for the Gavin Bailey Tissue Repository for Neural Crest Disorders. We would also like to express our gratitude to Dr José Costa for his valuable suggestions.
Conflict of interest statement. The authors declare no conflicts of interest.
References
Author notes
These authors contributed equally to this work.


