


Abstract
Malignant peripheral nerve sheath tumor (MPNST) is a rare and highly aggressive disease with no evidence of effect from adjuvant therapy. It is further associated with the hereditary syndrome neurofibromatosis type 1 (NF1). Silencing of the tumor suppressor gene RASSF1A through DNA promoter hypermethylation is known to be involved in cancer development, but its impact in MPNSTs remains unsettled.
The RASSF1A promoter was analyzed by methylation-specific PCR in 113 specimens, including 44 NF1-associated MPNSTs, 47 sporadic MPNSTs, 21 benign neurofibromas, and 1 nonneoplastic nerve sheath control.
RASSF1A methylation was found only in the malignant samples (60%) and identified a subgroup among patients with NF1-associated MPNST with a poor prognosis. These patients had a mean 5-year disease-specific survival of 27.3 months (95% CI: 17.2–37.4) versus 47.4 months (95% CI: 37.5–57.2) for NF1 patients with unmethylated promoters, P = 0.014. In multivariate Cox regression analysis, methylated RASSF1A remained an adverse prognostic factor independent of clinical risk factors, P = .013 (hazard ratio: 5.2; 95% CI: 1.4–19.4).
A considerable number of MPNST samples display hypermethylation of the RASSF1A gene promoter, and for these tumors, this is the first molecular marker that if validated can characterize a subgroup of patients with inferior prognosis, restricted to individuals with NF1.
Malignant peripheral nerve sheath tumors (MPNSTs) are classified as soft tissue sarcomas and are believed to originate from the neural crest–derived Schwann cells or their precursors.1 About half of these tumors arise in patients with the hereditary disorder neurofibromatosis type 1 (NF1) caused by germline mutations in the NF1 gene.1 The lifetime risk of developing MPNSTs among NF1 patients is about 10%,2 whereas the general population risk is very low. MPNSTs are highly aggressive and invasive, with a resulting poor 5-year survival rate of 20%–50%.3,4 The only consensus therapy for MPNST patients is surgery, whereas adjuvant chemo- and/or radiotherapy is offered to selected patients. However, the additional treatment has not improved the survival rates.5 Some molecular markers have been suggested to carry prognostic information,5–9 but none of them have so far been implemented in the clinic. However, evaluation of molecular biomarkers with prognostic value independent of high-risk clinical factors ought to be considered as routine assays guiding the selection of patients who should be offered additional treatment.
MPNSTs commonly display complex karyotypes with frequent structural and numerical alterations,8,10 including recurrent gains of whole or parts of chromosome arm 17q and deletions from 9p. Components of the cell cycle machinery, such as TP53, CDKN2A, and RB1, frequently show aberrant gene and protein expression patterns,11–15 and growth factor receptors like ERRB2, EGFR, KIT, and MET are reported amplified.11,16–18 Interestingly, except for biallelic alterations of the NF1 gene,19,20 few recurrent mutations have been detected in these tumors, underscored by a recent oncogene mutation survey where the 238 most frequent cancer mutations in 19 commonly activated oncogenes were analyzed in MPNST cell lines and all were found to be wild type.21 This emphasizes the importance of the NF1 mutations in MPNSTs. NF1 encodes neurofibromin, a GTPase-activating protein functioning among others as a negative regulator of Ras. Consequently, loss of NF1 activity leads to hyperactivation of Ras and continuous signaling through the networks of both mitogen-activated protein kinase and phosphatidylinositol-3 kinase.1 Ras is known to interact with a number of components other than NF1, including Ras association domain family member 1, isoform A (RASSF1A), which is one of the most frequently inactivated tumor suppressors identified in cancer.22 Mutations are rarely found in tumors, but reduced RASSF1A expression caused by DNA hypermethylation has been reported in a variety of tumor types, including cancers of the lung, liver, breast, prostate, and testicles, as well as neuroblastomas, schwannomas,23,24 and a few MPNSTs.25,26 The RASSF1A gene encodes a protein resembling Ras effector proteins and has been shown to play important roles in cell cycle regulation, apoptosis, and microtubule stability. The current hypothesis is that RASSF1A, which has no known enzyme activity, functions both as a scaffold protein and by modulating microtubule polymerization.27
Epigenetic changes are frequently seen in the majority of cancer diseases, and aberrant hypermethylation of gene promoters has been established as a common and important mechanism for inactivation of tumor suppressor genes. For MPNSTs, only a limited number of DNA methylation studies have been reported, and most of them are hampered by inclusion of rather few clinical samples (overview presented in Table 1). In this study, the methylation status of RASSF1A was analyzed and related to the quantitative gene expression and clinical endpoints in a large European series of MPNSTs.
Genes reported analyzed for DNA promoter methylation in MPNSTs and neurofibromas
| Gene | MPNST | Neurofibroma | Reference |
|---|---|---|---|
| CASP8 | 0/1 | 0/18 | 44 |
| DAPK | 0/3 | 0/18 | 44 |
| 0/17 | 25 | ||
| FOXD3a | 10 | 26 | |
| GSTP1 | 0/3 | 0/18 | 44 |
| 1/17 | 25 | ||
| MESTa | 10 | 26 | |
| MGMT | 1/3 | 8/18 | 44 |
| 3/17 | 25 | ||
| MLH1 | 3/17 | 25 | |
| MSH2b | 0/17 | 25 | |
| 10 | 26 | ||
| NF1a | 0/5 | 0/16 | 45 |
| 0/3 | 0/20 | 46 | |
| 0/10 | 12/18 | 47 | |
| 10 | 26 | ||
| PTEN | 5/17 | 25 | |
| 11/26 | 3/24 | 48 | |
| p14/CDKN2Aa | 0/19 | 12 | |
| 1/3 | 0/18 | 44 | |
| 0/17 | 25 | ||
| 2/16 | 49 | ||
| 0/18 | 50 | ||
| 10 | 26 | ||
| p15b | 0/16 | 49 | |
| 10 | 26 | ||
| p16/CDKN2Aa | 0/19 | 12 | |
| 0/3 | 4/18 | 44 | |
| 0/17 | 25 | ||
| 0/2 | 15 | ||
| 2/16 | 49 | ||
| 0/18 | 50 | ||
| 10 | 26 | ||
| p73 | 0/3 | 4/18 | 44 |
| RASSF1A | 3/17 | 25 | |
| RASSF1a | 10 | 26 | |
| RB1 | 1/3 | 2/18 | 44 |
| 0/17 | 25 | ||
| RUNX1a | 10 | 26 | |
| SOX10a | 10 | 10 | 26 |
| THBS-1 | 2/3 | 9/18 | 44 |
| TIMP-3 | 1/3 | 6/18 | 44 |
| TP53 | 0/3 | 0/18 | 44 |
| TSC2a | 10 | 26 | |
| WT1a | 10 | 26 |
aDifferentially methylated gene specifically mentioned in a genome-wide methylome analysis comparing 10 pooled MPNSTs, 10 pooled neurofibromas, and 6 pooled nonneoplastic Schwann cell samples.26
bListed as differentially methylated in the genome-wide analysis revealing 3690 genes potentially involved in MPNST development and progression.26
Materials and Methods
Specimens
Collected at 4 European centers, a total of 113 specimens from 105 patients were included in the present study. The material comprises 91 MPNSTs, 21 neurofibromas, and 1 tumor-free sciatic nerve from a chondrosarcoma patient serving as a nonneoplastic nerve sheath control (Supplementary Table S1). All specimens have been examined by at least one pathologist, and in case of uncertainty of the diagnosis, the samples were excluded from the study. The mean age at diagnosis for patients with malignant disease was 48 years (range: 11–79) for those with sporadic tumors (n = 47) and 33 years (range: 14–70) for patients with NF1 (n = 44). The median age for patients with neurofibromas (n = 21) was 26 years (range: 10–75). The patients were diagnosed during 1973–2008, and samples were collected from Oslo University Hospital, Norway; Skåne University Hospital, Lund, Sweden; University Medical Center Groningen, Netherlands; and the Istituto Ortopedico Rizzoli, Bologna, Italy. The Norwegian biobank is registered at the Institute for Public Health, biobank registry no. 1781. The study was approved by the regional committee for medical and health research ethics South East, and patients were included following informed consent. Sampling, storage, and analysis of the Swedish material were approved by the Regional Ethics Committee of Lund University, following informed consent from the patients. The Dutch material was approved according to the University Medical Center Groningen, whereas the Rizzoli Institute Ethics Committee approved the Italian material, and according to institutional guidelines, adult patients or guardians for minors signed the informed consent form.
Methylation Analysis
DNA was extracted either by phenol/chloroform followed by ethanol precipitation as described by the manufacturer of the Nucleic Acid Extractor (Applied Biosystems) or by the Qiagen Allprep DNA/RNA Mini Kit according to the manufacturer's protocol. Further, the DNA was treated with sodium bisulfite using a previously described protocol28–30 and/or the Epitect Bisufite Kit (Qiagen), followed by qualitative and/or quantitative methylation-specific polymerase chain reaction (MSP and/or qMSP, respectively).31
The MSP reactions were carried out in a total volume of 25 μL, containing 20 ng of bilsufite-treated template, 1 × PCR Buffer (Qiagen), 0.2 mM deoxyribonucleotide triphosphate (Roche Diagnostics), 0.8 mM of each primer, and 0.65–1 U HotstarTaq DNA Polymerase (Qiagen). Primers were purchased from Medprobe. The sequences are listed in Supplementary Table S2 and a schematic drawing of the promoter region with primer locations is depicted in Supplementary Fig. S1. Human placental DNA (Sigma-Aldrich) treated with SssI methyltransferase (New England Biolabs) served as a positive control for the methylated reaction, whereas bisulfite-modified DNA from normal lymphocytes was used as positive control for the unmethylated reaction. Water served as a negative control for both reactions. The PCR products were separated using 2% agarose gels (BioRad) stained with ethidium bromide (Sigma-Aldrich) and visualized by UV light using a GeneGenius gel documentation system (Syngene). The results were independently scored by visual inspection by 2 of the authors, and all methylated samples were verified by a second, independent round of MSP.
Samples with PMR values exceeding the highest values among the benign neurofibromas and the nonneoplastic nerve sheath control (ie, PMR > 0) were scored as methylation positive.
Gene Expression Analysis of RASSF1
Total RNA was isolated from 5 neurofibromas and 27 MPNSTs using Trizol (Invitrogen) and converted to cDNA using the High Capacity RNA-to-DNA Kit (Applied Biosystems) according to the manufacturer's protocol.
Twenty nanograms of cDNA was amplified in a 20-μL reaction volume containing 1× TaqMan Universal PCR Mastermix (Applied Biosystems) and predesigned 1× TaqMan Gene Expression Assays (Applied Biosystems; RASSF1, Hs 00200394_m1; RASSF1 isoform A, Hs 00945257_m1) using the following PCR program: 50°C for 2 min, 95°C for 10 min, then 45 cycles of 95°C for 15 s followed by 60°C for 1 min. The quantitative gene expression of RASSF1/RASSF1A was measured in real time using the 7900 HT Sequence Detection System (TaqMan, Applied Biosystems). All samples were analyzed in triplicate, and the median value was used for further data analyses. Universal Human Reference RNA (a mixture of total RNA from 10 different cell lines; Agilent) was used to generate a standard curve, and the quantitative expression levels of RASSF1 and RASSF1A were normalized against the mean value of the endogenous controls ACTB (Hs99999903_m1) and GUSB (Hs99999908_m1).
Statistics
Statistical analyses were performed using the software package PASW version 18.0 (SPSS). Fisher's exact test was used for assessment of associations between categorical variables, while the Mann-Whitney-Wilcoxon test was used to examine association between the methylation status of RASSF1A and continuous variables. Associations to patient outcome was evaluated only for patients with available tissue from the primary tumor, and disease-specific survival was used as the endpoint where deaths of MPNST were considered events and patients who died of other causes were censored at the time of death. All MPNST cases included in the present study were monitored closely at the same institution where they were treated, thus the cause of death could be identified with great certainty. The survival curves were generated and compared using the Kaplan–Meier method with the Breslow test, and Cox regression with the Wald test was used to generate and test uni- and multivariate proportional hazards. P ≤ .05 was considered statistically significant.
Results
Promoter Methylation of RASSF1A in MPNSTs Related to Clinicopathological Variables
In an initial (qualitative) MSP screening study of several candidate genes (not shown), the RASSF1A promoter was found methylated in 23 of 44 MPNST samples (52%), in contrast to complete absence of methylation in 9 neurofibromas and a normal sciatic nerve (Supplementary Table S1). No associations were found between RASSF1A methylation and clinicopathological variables, including NF1 status, grade, localization, or size of the tumors, or patients' age, sex, or nationality.
Due to interesting results from survival analyses, we subsequently reanalyzed the RASSF1A gene promoter by qMSP and expanded the sample series to a total of 91 MPNSTs, 21 neurofibromas, and the sciatic nerve. Sixty percent of the MPNSTs were methylated, whereas all neurofibromas and the sciatic nerve remained unmethylated (Supplementary Table S1). The methylation frequency was slightly, but not significantly, higher among the NF1 patients compared with the non-NF1 patients (66% and 54%, respectively; P = .3). In concordance with the results from the qualitative analysis, no associations were found between the presence of quantitatively measured methylation of the RASSF1A promoter and clinicopathological variables (Supplementary Table S3).
RASSF1A Methylation Compared With Quantitative Gene Expression
For samples where RNA was obtainable (n = 27), quantitative gene expression measurements of 2 assays amplifying different transcripts of the RASSF1 gene were performed. For MPNSTs, there was a strong association between promoter hypermethylation and reduced gene expression, P = .001 for the most specific assay, amplifying only RASSF1A (Fig. 1). This effect was significant both for NF1 (n = 15, P = .03) and for non-NF1 patients (n = 12, P = .003). Both MPNSTs with methylated and unmethylated RASSF1A promoter had lower expression than the benign neurofibromas (P = .0001 and P = .05, respectively), suggesting that additional mechanisms are involved in silencing the RASSF1A gene in MPNST.
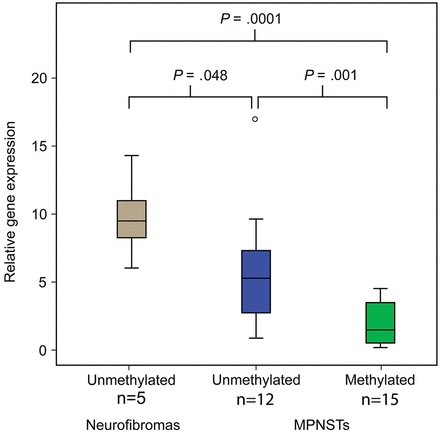
The gene expression of RASSF1A (assay Hs 00945257_m1 detecting NM_007182.4, RASSF1A) is significantly downregulated in MPNSTs with promoter hypermethylation compared with tumors without RASSF1A methylation, and also in MPNSTs compared with neurofibromas independently of methylation.
For the MPNSTs, a borderline significance was seen with the second assay, between promoter hypermethylation and reduced gene expression (P = .06; data not shown). In contrast to the first assay, the second assay amplified several transcript variants of the RASSF1 gene.
Methylation of RASSF1A in MPNSTs Related to Survival
In the initial MSP (qualitative) analyses, follow-up data for 36 patients with primary tumors were available, and stratification according to NF1 status suggested that RASSF1A methylation could distinguish a subgroup of NF1 patients with worse disease-specific 5-year survival (n = 20, P = .011). This could be seen neither among patients with sporadic disease (n = 16, P = .68) nor in the unstratified MPNST patient cohort (n = 36, P = .11) (data not shown). Based on these initial findings, we subsequently expanded the sample series and used a quantitative and more standardized analysis, qMSP. For this analysis, long-term follow-up data were available for 60 specimens with primary tumor, out of the 90 MPNST patients included, and we confirmed that NF1 patients with RASSF1A methylated tumors (n = 20) had a significantly worse prognosis than did patients with unmethylated tumors (n = 12, P = .014; Fig. 2A). The mean disease-specific survival for NF1 patients with methylation was 27.3 months (95% CI: 17.2–37.4) compared with 47.4 months (95% CI: 37.5–57.2) for NF1 patients without methylated tumors. No prognostic value of RASSF1A could be found for patients with sporadic disease (n = 28, P = .85; Fig. 2B).
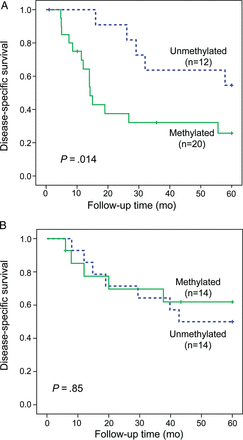
Disease-specific survival based on RASSF1A promoter methylation status for (A) patients with NF1-associated MPNSTs and (B) patients with sporadic disease.
A multivariate Cox regression analysis revealed that methylation status of RASSF1A was the strongest predictor of disease-specific survival (hazard ratio: 5.2; 95% CI: 1.4–19.4; P = .013) compared with tumor size, metastasis at time of diagnosis, and tumor location (P = .052, P = .054, and P = .076, respectively; Table 2).
Prognostic factors for 5-year disease-specific survival of NF1 patients with MPNST
| Univariate | Multivariate | ||||||
|---|---|---|---|---|---|---|---|
| Parameter | No. of Patients | HR | 95% CI | P | HR | 95% CI | P |
| RASSF1A | 2.899 | 1.032–8.143 | .04 | .013 | |||
| Unmethylated | 12 | Ref | |||||
| Methylated | 20 | 5.235 | 1.413–19.397 | ||||
| Tumor size, cma | 30 | 1.053 | 0.992–1.118 | .09 | 1.089 | 0.999–1.187 | .05 |
| Tumor location | 0.936 | 0.380–2.309 | .87 | .08 | |||
| Nonextremities | 15 | Ref | |||||
| Extremities | 17 | 0.336 | 0.101–1.121 | ||||
| Metastasis at time of diagnosis | 4.299 | 1.458–12.677 | .008 | .05 | |||
| No | 27 | Ref | |||||
| Yes | 5 | 3.976 | 0.974–16.233 | ||||
Abbreviations: HR, hazard ratio; Ref, reference category.
aContinuous variable.
Discussion
The literature on DNA methylation in MPNSTs is limited. Studies on a handful of genes have been reported (Table 1) in addition to a recent paper where the methylomes of 10 pooled benign and 10 pooled malignant tumors were compared.26 Here, we add a detailed study analyzing the promoter methylation of RASSF1A.
In a large European series of MPNSTs we have demonstrated RASSF1A to be commonly methylated in this malignancy (60%), and at a frequency considerably higher than previously reported (18%).25 All normal and benign samples were unmethylated, underscoring that RASSF1A promoter methylation is cancer specific. Furthermore, expression of the RASSF1A gene was significantly reduced in MPNST samples with promoter hypermethylation compared with unmethylated samples. This indicates that methylation causes reduced gene activity, or gene silencing, which is in agreement with reports on other cancer types.24,34 Notably, however, also the MPNSTs with unmethylated RASSF1A promoter had significantly lower gene expression than in benign tumors, indicating that additional mechanisms of gene regulation are involved. Regulation of microtubules has been suggested to be one of the essential tumor suppressor activities of RASSF1A, thereby ensuring and maintaining chromosomal stability.22,35 The impaired function of RASSF1A in MPNST might contribute to the increased DNA copy number variation and complex karyotypes that are key characteristics of MPNSTs.
RASSF1A methylation has been suggested to be preferentially present in the most aggressive tumors of various kinds,34,36 suggesting that it might serve as a marker for tumor progression and metastasis. In the current series of MPNSTs, however, presence of RASSF1A methylation was equally distributed among primary, relapsed, and metastatic lesions and between individuals with and without NF1. It was also independent of tumor size and site (extremities or trunk), as well as the patient's country of origin, age, and gender.
Interestingly, survival analyses showed that RASSF1A methylation in MPNSTs was a surrogate marker for poor prognosis among NF1 patients only and independently of clinical risk factors such as tumor size and metastasis. To the best of our knowledge, no molecular marker in MPNSTs has previously been shown to discriminate consistently between inferior and good prognosis selectively for NF1 patients. Clinical factors such as large tumor size, incomplete resection, and distant metastasis are shown to be associated with inferior prognosis,3,5 which was also true for the present study. However, the multivariate survival analyses identified RASSF1A methylation as the strongest predictor of outcome among these factors, emphasizing the clinical potential of our finding. Biomarkers that are able to predict prognosis could be valuable in decision making when considering treatment alternatives. In the case of MPNSTs, one could argue that NF1 patients with methylated RASSF1A, predicting inferior prognosis, would benefit from an extended follow-up protocol and adjuvant treatment. Although our study includes a large number of specimens, taking into account the rareness of the disease and the fact that the findings seem valid only for NF1 patients with MPNST, it results in quite small statistical categories. Thus, the prognostic value of RASSF1A promoter methylation needs to be validated in an independent sample series. Nevertheless, since methylation of the same gene has been suggested as a prognostic marker for various tumor types, including different sarcomas,37–43 the methylation status of RASSF1A holds great potential to differentiate patients with both NF and MPNST into groups of good and poor prognosis.
Funding
This work was supported by grants from the Norwegian Cancer Society (PR-2006-0442 to R.A.L., financing S.A.D. as postdoctoral fellow, PR-2008-0163 to G.E.L., PR-51260-2012 to R.A.L., financing M.K. as a staff scientist) and the Faculty of Medicine, University of Oslo (to R.A.L., financing M.H. as a Ph.D student).
Acknowledgments
We are grateful to Hilde Honne and Trude Holmeide Ågesen for excellent technical assistance.
Conflict of interest statement. The authors declare that they have no conflict of interest.


