


Abstract
Moderate hyperhydration is often achieved in the early post-kidney transplantation period. Whether this strategy could lead to the development of intra-abdominal hypertension (IAH) has never been assessed so far. We aimed to study the incidence of IAH after kidney transplantation and its association with graft function recovery.
We conducted a prospective monocentric study among patients undergoing kidney transplantation at the University Hospital of Reims between May 2017 and April 2019. Intravesical pressure (IVP) was monitored every 8 h from Day 0 to 3.
A total of 107 patients were enrolled. Among 55 patients included in the analysis, 74.5% developed IAH. Body mass index >25 kg/m2 was associated with IAH development {odds ratio [OR] 10.4 [95% confidence interval (CI) 2.0–52.9]; P = 0.005}. A previous history of peritoneal dialysis was protective [OR 0.06 (95% CI 0.01–0.3); P = 0.001]. IAH Grades III and IV occurred in 30.9% of patients and correlated with higher Day 3 creatininaemia (419.6 ± 258.5 versus 232.5 ± 189.4 μmol/L; P = 0.02), higher delayed graft function incidence (41.2 versus 7.9%; P = 0.04), lower Kirchner index measured using scintigraphy (0.47 ± 0.09 versus 0.64 ± 0.09; P = 0.0005) and decreased Day 30 estimated glomerular filtration rate (35.8 ± 18.8 versus 52.5 ± 21.3, P = 0.05). IAH patients had higher fluid balance (P = 0.02). Evolution of IVP correlated with weight gain (P < 0.01) and central venous pressure (P < 0.001).
IAH is frequent after kidney transplantation and IAH Grades III and IV are independently associated with impaired graft function. These results question current haemodynamic objectives and raise for the first time interest in intra-abdominal pressure monitoring in these patients.
ClinicalTrials.gov identifier: NCT03478176
What is already known about this subject?
Hyperhydration is often achieved during the early post-kidney transplantation period in order to avoid hypovolaemia. Whether this strategy could lead to fluid overload complications has never been assessed so far.
Intra-abdominal hypertension (IAH) is a frequent complication of fluid overload in intensive care units.
IAH is associated with the development of acute kidney injury.
What this study adds?
Almost 75% of patients experiment IAH in the early post-kidney transplantation period.
IAH Grades III and IV (almost 30% of patients) are independently associated with impaired graft function recovery.
IAH development is associated with higher fluid balance after kidney transplantation.
What impact this may have on practice or policy?
These results question our current objectives considering fluid therapy in the early post-kidney transplantation period and raise interest for intra-abdominal pressure monitoring in these patients.
There is a need for larger interventional studies to improve fluid management after kidney transplantation.
INTRODUCTION
Chronic kidney disease (CKD) affects ∼10% of the population worldwide [1, 2]. Whatever the cause, the natural evolution of CKD leads to end-stage renal disease (ESRD). At this stage, the survival of patients depends on the initiation of renal replacement therapy. Kidney transplantation is actually considered as the best treatment option for ESRD patients, as it provides increased overall survival, better quality of life and reduced hospitalization rates and treatment costs compared with dialysis therapies [3].
More than 3500 kidney transplantations occur each year in France. Delayed graft function (DGF) is associated with decreased graft and patient survival, impaired long-term graft function and increased risk of acute rejection [4]. As a consequence, one of the main goals of the perioperative therapeutic approach is to optimize graft function recovery. Once surgery is done, most of the DGF-associated factors become unmodifiable, either attributable to the donor (deceased donor, advanced age, altered renal function), the recipient (male, obesity, diabetes) or surgical intervention (warm and cold ischaemia) [5]. However, management of the kidney transplant recipient’s hydration remains one of the main issues for optimizing graft function recovery in the early post-operative period [6].
Despite the absence of strong evidence or guideline, hyperhydration is usually achieved in these patients [7]. Indeed, 80% of kidney recipients experience fluid overload during the early post-transplantation period [8]. This strategy aims to avoid hypovolaemia and prevent further graft aggression in addition to ischaemia–reperfusion lesions [9]. Nevertheless, hyperhydration does not guarantee a positive effect on either renal perfusion or renal function [6]. Whether this hyperhydration is associated with fluid overload complications has not been assessed so far.
Among fluid overload complications, intra-abdominal hypertension (IAH) has been demonstrated to occur in 30–54% of intensive care unit (ICU) patients [10, 11]. Its associated factors include capillary hyperpermeability, metabolic acidosis and abdominal surgery, all of which may concern kidney transplant recipients [12]. The diagnosis of IAH is easily accessible in daily practice, defined by a sustained elevation in intra-abdominal pressure (IAP), estimated by an intravesical pressure (IVP) >12 mmHg [12]. Moreover, IAH is associated with acute kidney injury (AKI) development in animal models and clinical studies [13, 14]. As we previously described, IAH-related AKI is mainly explained by renal venous congestion and impaired renal perfusion [15]. Therefore international guidelines recommend IVP monitoring in patients presenting IAH-associated factors [12]. Despite these considerations, there are no available data regarding IAH after kidney transplantation.
The aim of this study was to determine the incidence IAH and associated factors in the early post-kidney transplantation period, its impact on short- and mid-term graft function and IVP correlation with haemodynamic parameters.
MATERIALS AND METHODS
Study design
We designed a prospective observational study. All patients >18 years of age and undergoing kidney transplantation at University Hospital of Reims (France) between 1 May 2017 and 30 April 2019 were approached to participate. Patients for whom IVP monitoring was incomplete (absence or dysfunction of an IVP monitoring device, transfer, detransplantation, death) were excluded from the analysis. All subjects provided written informed consent to participate in the study. This study was approved by the ethics committee (CPP Sud Mediterranée IV, Montpellier, 14 March 2017) and was registered at ClinicalTrials.gov (NCT03478176).
IVP monitoring
IAP was assessed by IVP measurement with the UnoMeter Abdo-Pressure device (ConvaTec, Reading, UK), which was adapted to the Foley catheter in the operating room. IVP was monitored every 8 h from Day 0 to 3, as this measure represents the gold standard for IAP assessment with a strong intra- and interobserver reliability [12, 16]. Briefly, at each time, the UnoMeterTM Abdo-Pressure tube was lifted with the zero point placed at the patient’s midaxillary line, then the clamp was opened and the IVP level was recorded according to the manufacturer’s instructions. If the IVP monitoring device was not set up by the operator, or in case it was impossible to continue IVP monitoring (dysfunctional device, anuria, clotting haematuria, urinoma), we pre-specified not to renew IVP measurement in order to avoid any added manipulation. IAH was defined according to the World Society of Abdominal Compartment Syndrome as an increase in IAP >12 mmHg for >24 h and graded as follows: Grade I, 12–15 mmHg; Grade II, 16–20 mmHg; Grade III, 21–25 mmHg; and Grade IV, >25 mmHg [12]. For each patient, the IAH grade was defined as the maximal grade exhibited during the whole study period.
Post-kidney transplantation fluid management
Haemodynamic management was fulfilled in all patients according to a standardized protocol. Hourly diuresis was systematically compensated with sodium chloride (NaCl) 0.6% (or NaCl 0.9% if plasma sodium was <136 mmol/L or sodium bicarbonate1.4% if plasma bicarbonate was <16 mmol/L) until daily diuresis remained stable and <8 L/day. Vascular filling was used to maintain central venous pressure (CVP) >5 mmHg without exceeding 8–10% weight gain compared with dry weight. Weight, CVP and non-invasive mean arterial blood pressure (mAP) were measured every 8 h from Day 0 to 3 after kidney transplantation. Daily fluid balance was recorded.
Clinical and laboratory measurements
Recipient [age, height, body mass index (BMI), sex, causal nephropathy, heart failure, diabetes, residual diuresis, anti-human leucocyte antigen (HLA) immunization, modality and duration of previous renal replacement therapy] and donor characteristics (living donor, expanded criteria donor, age, height, BMI, sex, cardiac arrest, collapse, creatininaemia, presence of atheroma or calcification on renal graft artery), perioperative data (use of perfusion machine, cold ischaemia time, perioperative vascular filling volume) and immunosuppressive strategy (induction and maintenance) were recorded.
Short-term graft function recovery was evaluated using Day 3 creatininaemia and DGF incidence (defined as renal replacement therapy necessity during the first week after kidney transplantation). Using Day 2 technetium 99m mercaptoacetyltriglycine (99Tc-MAG3) scintigraphy, we measured the Kirchner index to assess early graft perfusion, as previously described [17]. Mid-term graft function recovery was evaluated using Day 30 estimated glomerular filtration rate (eGFR) calculated by the Chronic Kidney Disease Epidemiology Collaboration (CKD-EPI) equation.
Statistical analysis
Quantitative variables are reported as mean ± standard deviation (SD) and qualitative data as number and percentage. Patients with or without IAH were compared using univariate analysis (Student’s t-test or Wilcoxon test for quantitative variables and chi-square test or Fisher’s exact test for qualitative variables) and multivariate analysis (stepwise logistic regression with enter and removal limits set at 0.10 and variables with P < 0.10 by univariate analysis included). Factors associated with renal function recovery evaluated as quantitative variables (Day 3 creatininaemia, Day 30 eGFR and Kirchner index) were studied using univariate analysis (Wilcoxon test or Kruskal–Wallis test for qualitative variables and Pearson’s correlation test for quantitative variables) and multivariate analysis (linear regression with variables with P < 0.10 by univariate analysis is included). Factors associated with renal function recovery evaluated as a qualitative variable (DGF) were studied using univariate analysis (Wilcoxon test for quantitative variables and Fisher’s exact test for quantitative variables) and multivariate analysis (logistic regression with variables with P < 0.10 by univariate analysis is included).
We fit a linear mixed effect model to assess correlation between IVP, weight gain, CVP and mAP [18]. Patient and time-specific intercepts were incorporated to account for repeated measurements. Model validation was performed by assessing the normality of the residuals. The assumption that there was no interaction between predictor and time was performed by plotting residuals against time and visually assessing the stability of their mean. P-values were calculated using Satterthwaite’s approximation. P-values <0.05 was considered statistically significant. All analyses were performed using SAS version 9.4 (SAS , Cary, NC, USA) and R version 3.6 (R Foundation, Vienna, Austria).
RESULTS
IAH incidence in the early post-kidney transplantation period
During the study period, 107 patients underwent kidney transplantation. After exclusion of 52 patients who did not complete the IVP monitoring, 55 patients were included in the analysis (Figure 1). The study population’s characteristics are summarized in Table 1. IAH occurred in 74.5% of kidney transplant recipients. The majority of patients developed IAH Grade I (32.7%), while IAH Grade III or IV occurred in 30.9% of included patients (Figure 2).
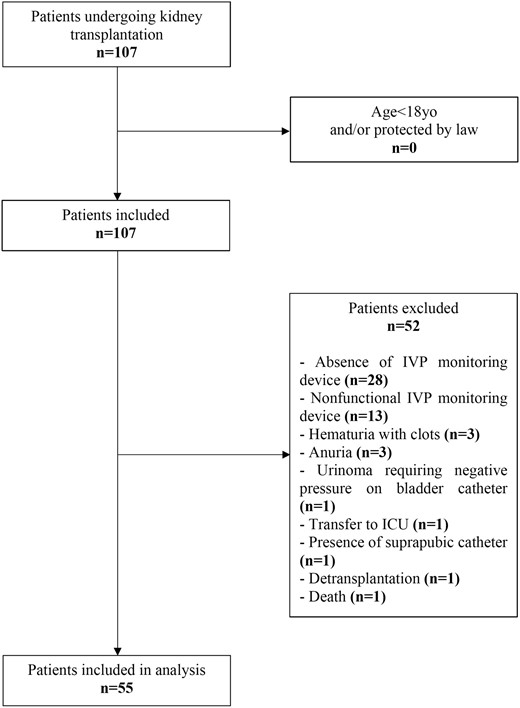
Flowchart of the study population.
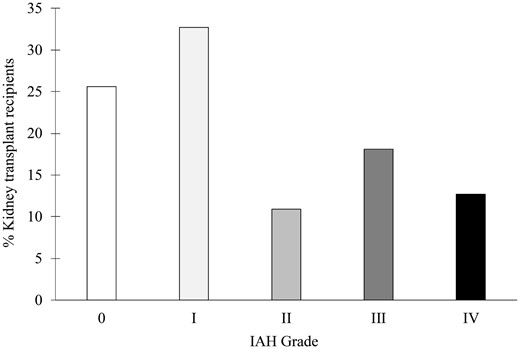
IAH incidence after kidney transplantation. IAH grade is defined by sustained (>24 h) elevation of IVP between 12 and 15 mmHg (Grade I), 16–19 mmHg (Grade II), 20–24 mmHg (Grade III) or >25 mmHg (Grade IV). For each patient, IAH grade was defined as the maximal grade exhibited during the entire study period.
Univariate and multivariate analysis of factors associated with IAH
| Variablesa | All patients (N = 55) | Without IAH (n = 14) | IAH (n = 41) | Univariate analysis | Multivariate analysisb | |
|---|---|---|---|---|---|---|
| P-value | P-value | OR (95% CI) | ||||
| Kidney transplant recipients | ||||||
| Agec(years) | 48.7 ± 11.7 | 44.5 ± 12.0 | 50.2 ± 11.4 | 0.12 | ||
| Male, n (%) | 29 (52.7) | 7 (50.0) | 22 (53.7) | 0.81 | ||
| BMIc (kg/m2) | 25.9 ± 4.5 | 22.8 ± 3.8 | 26.9 ± 4.3 | 0.006 | ||
| >25 kg/m2, n (%) | 30 (54.5) | 3 (21.4) | 27 (65.8) | 0.004 | 0.005 | 10.4 (2.0–52.9) |
| Causal nephropathy, n (%) | 0.35 | |||||
| Diabetic | 4 (7.3) | 1 (7.1) | 3 (7.3) | |||
| Glomerulopathy | 20 (36.4) | 6 (42.9) | 14 (34.1) | |||
| Interstitial | 7 (12.7) | 3 (21.4) | 4 (9.8) | |||
| Hypertension | 4 (7.3) | 2 (14.3) | 2 (4.9) | |||
| ADPKD | 17 (30.9) | 2 (14.3) | 15 (36.6) | |||
| Uropathy | 3 (5.4) | 0 (0) | 3 (7.3) | |||
| Residual diuresis >500 mL/day, n (%) | 36 (65.4) | 9 (64.3) | 27 (65.8) | 0.99 | ||
| Diabetes, n (%) | 8 (14.5) | 1 (7.1) | 7 (17.1) | 0.66 | ||
| Heart failure, n (%) | 4 (7.3) | 2 (14.3) | 2 (4.9) | 0.26 | ||
| Anti-HLA immunization, n (%) | 23 (41.8) | 7 (50.0) | 16 (39.0) | 0.47 | ||
| Renal replacement therapy, n (%) | 0.08 | |||||
| Pre-emptive | 8 (14.5) | 1 (7.1) | 7 (17.1) | |||
| Peritoneal dialysis | 12 (21.8) | 6 (42.9) | 6 (14.6) | 0.05 | 0.001 | 0.06 (0.01–0.31) |
| Haemodialysis | 35 (63.6) | 7 (50.0) | 28 (68.3) | |||
| Dialysis exposure timec (months) | 41.8 ± 41.4 | 34.5 ± 30.7 | 44.7 ± 44.9 | 0.51 | ||
| Perioperative data | ||||||
| Cold ischaemia timec(min) | 829.2 ± 474.4 | 743.8 ± 516.7 | 858.3 ± 462.3 | 0.37 | ||
| Perioperative vascular fillingc (mL/kg) | 44.8 ± 18.9 | 41.0 ± 17.4 | 46.1 ± 19.4 | 0.31 | ||
| Kidney transplant donors | ||||||
| Living donor, n (%) | 6 (10.9) | 3 (21.4) | 3 (7.3) | 0.16 | ||
| Cardiac arrest, n (%) | 17 (30.9) | 5 (35.7) | 12 (29.3) | 0.74 | ||
| Collapse, n (%) | 10 (18.2) | 1 (7.1) | 9 (21.9) | 0.42 | ||
| Creatininaemiac (µmol/L) | 78.1 ± 49.8 | 83.3 ± 31.2 | 76.3 ± 55.0 | 0.06 | ||
| Agec (years) | 51.8 ± 16.0 | 53.0 ± 17.3 | 51.5 ± 15.7 | 0.78 | ||
| BMIc (kg/m2) | 25.9 ± 4.8 | 24.9 ± 2.6 | 26.3 ± 5.3 | 0.49 | ||
| >25 kg/m2, n (%) | 29 (52.7) | 6 (42.9) | 23 (56.1) | 0.39 | ||
| Atheroma,dn (%) | 13 (23.6) | 3 (21.4) | 10 (24.4) | 0.99 | ||
| Vascular calcification,dn (%) | 9 (16.4) | 1 (7.1) | 8 (19.5) | 0.42 | ||
| Immunosuppressive therapy | ||||||
| Induction, n (%) | 0.20 | |||||
| Thymoglobulin | 19 (34.5) | 7 (50.0) | 12 (29.3) | |||
| Basiliximab | 36 (65.5) | 7 (50.0) | 29 (70.7) | |||
| Maintenance, n (%) | ||||||
| MMF | 49 (89.1) | 11 (78.6) | 38 (92.7) | 0.16 | ||
| Cyclosporine | 27 (49.1) | 4 (28.6) | 23 (56.1) | 0.07 | ||
| Tacrolimus | 28 (50.9) | 10 (71.4) | 18 (43.9) | 0.07 | ||
| Everolimus | 4 (7.3) | 2 (14.3) | 2 (4.9) | 0.26 | ||
| Corticosteroids | 55 (100.0) | 14 (100.0) | 41 (100.0) | – | ||
Data are expressed as mean ± SD unless stated otherwise.
Factors included in the multivariate analysis were BMI >25 kg/m2, peritoneal dialysis, donor creatininaemia and maintenance therapy with cyclosporine and tacrolimus.
Eight missing data (pre-emptive recipients).
On renal graft artery.
ADPKD, autosomal dominant polycystic kidney disease; MMF, mycophenolate mofetil.
Factors associated with IAH during the early post-kidney transplantation period
In univariate analysis, BMI >25 kg/m2 (65.8% versus 21.4%; P = 0.004) and a history of peritoneal dialysis (14.6% versus 42.9%; P = 0.05) were associated with IAH (Table 1). However, no difference was observed between the two groups regarding causal nephropathy, donor characteristics, surgical data or immunosuppressive strategy. In multivariate analysis, BMI >25 kg/m2 was independently associated with IAH development {odds ratio [OR] 10.4 [95% confidence interval (CI) 2.0–52.9]; P = 0.005}, whereas a history of peritoneal dialysis was found to be a protective factor [OR 0.06 (95% CI 0.01–0.3); P = 0.001].
IAH association with graft function recovery
A total of 10 patients experienced DGF, while none of them was diagnosed with acute rejection. All markers of renal function were significantly associated with IAH grade (Figure 3). Interestingly, the major impact seemed to occur in patients with IAH Grades III and IV. Thus we analysed factors associated with graft function recovery considering IAH Grades III and IV as an independent factor (results of univariate analysis are resumed in Supplementary data, Tables S1–S4). The results of the multivariate analysis are shown in Tables 2–5. IAH Grades III and IV were independently associated with an increase in Day 3 creatininaemia (419.6 ± 258.5 versus 232.5 ± 189.4 µmol/L; P = 0.02), a lower Kirchner index (0.47 ± 0.09 versus 0.64 ± 0.09; P = 0.002), a higher DGF incidence (41.2 versus 7.9%; P = 0.04) and a decrease in Day 30 eGFR (35.8 ± 18.8 versus 52.5 ± 21.3; P = 0.05), suggesting a negative association with both early and mid-term graft function indicators.
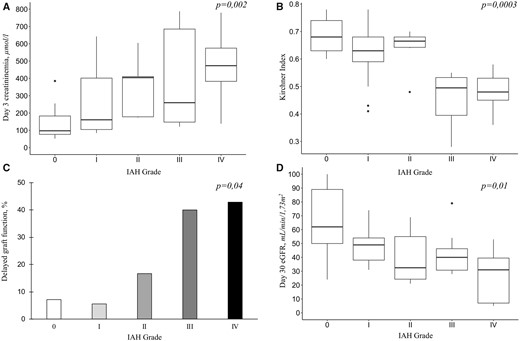
Graft function recovery according to IAH grade. (A) Day 3 creatininaemia. (B) Kirchner index assessed by Day 2 99Tc-MAG3 scintigraphy. (C) DGF incidence (percentage of patients). (D) Day 30 eGFR using the CKD-EPI equation.
Multivariate analysis of factors associated with Day 3 creatininaemia
| Variables | Day 3 creatininaemia (µmol/L) | Multivariate analysis | |
|---|---|---|---|
| β ± standard error | P-value | ||
| IAH grade | 0.02 | ||
| 0–1–2 (n = 38) | 232.5 ± 189.4 | 1 | |
| 3–4 (n = 17) | 419.6 ± 258.5 | 150.7 ± 60.5 | |
| Donor type | 0.09 | ||
| Living (n = 6) | 102.7 ± 40.1 | −156.0 ± 89.3 | |
| Deceased (n = 49) | 313.3 ± 231.0 | 1 | |
| Donor creatininaemia | 0.9 ± 0.6 | 0.13 | |
| Donor collapse | 0.14 | ||
| Yes (n = 10) | 402.5 ± 232.8 | 109.8 ± 72.4 | |
| No (n = 45) | 265.4 ± 221.9 | 1 | |
Values are reported as mean ± SD unless stated otherwise.
Multivariate analysis of factors associated with the Kirchner index
| Variables | Kirchner index | Multivariate analysis | |
|---|---|---|---|
| β ± standard error | P-value | ||
| IAH grade | 0.0005 | ||
| 0–1–2 (n = 38) | 0.64 ± 0.09 | 1 | |
| 3–4 (n = 17) | 0.47 ± 0.09 | −0.12 ± 0.03 | |
| Donor:recipient height ratio | 0.40 ± 0.20 | 0.05 | |
| Donor:recipient BMI ratio | −0.04 ± 0.05 | 0.39 | |
| Residual diuresis >500 mL/day | 0.19 | ||
| Yes (n = 36) | 0.64 ± 0.10 | 0.04 ± 0.03 | |
| No (n = 19) | 0.55 ± 0.13 | 1 | |
| Donor creatininaemia | −0.0004 ± 0.0002 | 0.11 | |
| Female donor to male recipient | 0.63 | ||
| Yes (n = 13) | 0.52 ± 0.13 | −0.02 ± 0.04 | |
| No (n = 42) | 0.62 ± 0.11 | 1 | |
Values are reported as mean ± SD unless stated otherwise.
Multivariate analysis of factors associated with DGF
| Variables | DGF (n = 10) | No DGF (n = 45) | Multivariate analysis | |
|---|---|---|---|---|
| OR (95% CI) | P-value | |||
| IAH grade, n (%) | 0.04 | |||
| 0–1–2 | 3 (30.0) | 35 (77.8) | ||
| 3–4 | 7 (70.0) | 10 (22.2) | 5.54 (1.12–27.42) | |
| Residual diuresis (mL), mean ± SD | 390 ± 458 | 1065 ± 896.9 | 0.99 (0.99–1.00) | 0.17 |
Multivariate analysis of factors associated with Day 30 eGFR
| Variables | Day 30 eGFR, mL/min/1.73m² | Multivariate analysis | |
|---|---|---|---|
| β ± standard error | P-value | ||
| IAH grade | 0.05 | ||
| 0–1–2 (n = 38) | 52.5 ± 21.3 | 1 | |
| 3–4 (n = 17) | 35.8 ± 18.8 | −10.3 ± 5.3 | |
| Donor:recipient height ratio | 78.8 ± 32.8 | 0.02 | |
| Donor:recipient BMI ratio | 31.2 ± 9.1 | 0.001 | |
| Donor type | 0.0006 | ||
| Living (n = 6) | 67.3 ± 19.2 | 27.5 ± 7.5 | |
| Deceased (n = 49) | 44.9 ± 21.1 | 1 | |
| Non-DSA anti-HLA previous immunization | 0.03 | ||
| Yes (n = 23) | 54.3 ± 25.4 | 10.9 ± 4.8 | |
| No (n = 32) | 42.3 ± 17.6 | 1 | |
Values are reported as mean ± SD. DSA: donor-specific antigen antibodies.
Association between IVP and haemodynamic parameters in early post-kidney transplantation period
During the first 48 h, IVP increased from 8.5 ± 3.0 to 14.6 ± 6.0 mmHg, while weight and CVP increased from 77.1 ± 13.5 to 80.2 ± 14.1 kg and 6.4 ± 4.7 to 8.8 ± 5.0 mmHg, respectively (Figure 4). Compared with the IAH group, both weight and CVP started to decrease at Day 2 in patients without IAH. Moreover, cumulative fluid balance was found to be different according to IAH status (Figure 5). Compared with patients without IAH, patients developing IAH had a higher cumulative fluid balance at Day 2 (36.3 ± 30.1 versus 9.0 ± 34.8 mL/kg; P = 0.02) and Day 3 (30.2 ± 34.8 versus −11.9 ± 53.5 mL/kg; P = 0.02) and their mean hydric balance remained positive during the entire study period (Figure 5).

Evolution of haemodynamic parameters in the early post-kidney transplantation period. Evolution (mean ± 95% CI) of weight gain as the (A) percentage of initial weight (△weight), (B) IVP, (C) CVPand (D) mAPaccording to IAH) status. w/o, without.
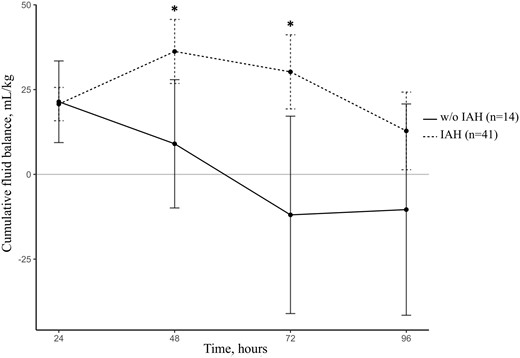
Cumulative fluid balance in the early post-kidney transplantation period according to IAH status. w/o, without. *P < 0.05.
Furthermore, we used a linear mixed effects model to assess the potential association between IVP, weight, CVP and mAP variations. The linear mixed effects model was found to be valid with no evidence of interaction between predictors and time. Both weight (P < 0.001) and CVP (P < 0.001) evolutions were significantly associated with IVP in the early post-kidney transplantation period. One per cent of weight gain led to a 0.45 mmHg (95% CI 0.34–0.56) increase in IVP, while a 1 mmHg increase in CVP led to a 0.19 mmHg (95% CI 0.11–0.26) increase in IVP. No significant association was found between IVP and mAP kinetic (P = 0.70).
DISCUSSION
The main finding of this study is that IAH occurs in almost 75% of kidney transplant recipients during the early post-kidney transplantation period. BMI >25 kg/m2 is associated with IAH development, whereas patients with a history of peritoneal dialysis are less likely to experience IAH. Sustained elevation of IAP >20 mmHg occurs in ∼30% of these patients and is associated with an impaired graft function recovery both on early renal function markers and on Day 30 eGFR. Finally, we found that IVP evolution is associated with CVP and body weight variations during the early post-kidney transplantation period.
Kidney transplant recipients are concerned by many IAH risk factors, especially fluid overload [10–12]. A prospective observational study reported an 80% prevalence of fluid overload according to bioimpedance measurements in the early post-kidney transplantation period [8]. More recently, another study found a high incidence of pulmonary congestion between Days 1 and 4 after kidney transplantation [7]. Hydration indicators usually used, such as CVP or weight gain, are imperfect, as they cannot predict whether both cardiac output and organ perfusion will increase in response to fluid therapy [19]. Thus this hyperhydration strategy might expose kidney transplant recipients to non-beneficial fluid therapy that could be harmful because of fluid overload complications [20]. To our knowledge, this is the first study reporting the incidence of IAH after kidney transplantation.
IAH Grades III and IV were strongly and adversely associated with early markers of graft function recovery in our study, both with Day 3 creatininaemia and DGF incidence. We used the Kirchner index, based on Day 2 99Tc-MAG3 scintigraphy, to assess IAH impact on graft perfusion. As we previously described, the effect of IAH on GFR is mainly due to an increase in renal venous pressure that leads to a decrease in renal plasma flow [15]. 99Tc-MAG3 captation during renal scintigraphy has been shown to correlate with effective renal plasma flow as MAG3 shares its spatial conformation and tubular secretion with hippuran [21]. The Kirchner index was first described as the slopes ratio of renal and aortic histogram upstrokes [22]. Previous studies reported that it correlates with early post-operative graft function as well as long-term outcomes of renal function [23]. The lower Kirchner index observed in patients with IAH Grades III and IV strengthens our hypothesis. Finally, IAH Grades III and IV were associated with a significant loss in Day 30 eGFR. While our results suggest a strong and independent association between IAH Grades III and IV and impaired graft function recovery, this observational study does not prove the causal link between the two events because of their bi-directional relationship. Our hypothesis is that severe IAH impairs both graft perfusion and function. This idea is supported by the absence of association between donor’s characteristics usually associated with DGF and IAH incidence. Nevertheless, larger interventional studies investigating the impact of a restrictive fluid therapy in these patients are needed to assess the causal effect of fluid overload and IAH on graft function recovery.
In our study, the role of fluid overload in IAH development is supported first by a correlation between IVP, CVP and weight gain in our linear mixed effects model. Moreover, patients developing IAH exhibited higher cumulative fluid balance starting at Day 2. These results strengthen the relationship between fluid overload, IAH and renal dysfunction and support the idea that venous congestion is the main haemodynamic factor driving kidney failure in these patients [24]. This statement challenges the intuitive thought that fluid overload is always beneficial regarding kidney function [25]. In patients with fluid overload and heart failure, previous studies found no association between renal dysfunction and decreased systolic function or cardiac index, whereas CVP was strongly and independently correlated with eGFR [26, 27]. In these patients, eGFR gradually increased in physiologic ranges of CVP up to 6 mmHg, but started to decrease in response to higher CVP level [28]. The effect of a restrictive fluid strategy as well as fluid removal on IAP evolution after kidney transplantation remains to be assessed.
We did not find a correlation between IVP and mAP evolution, although mAP tended to be lower in patients developing IAH, as previously described in post-liver transplantation patients [29]. This observation is of interest in explaining IAH-associated renal failure pathophysiology. Indeed, lower renal perfusion pressure (defined as mAP − IAP) as well as a lower filtration gradient, representing the difference between glomerular filtration pressure and the proximal tubular pressure (which can be estimated as mAP − 2 × IAP) have been suggested to be more appropriate concepts reflecting the vulnerability of the kidney to IAH [30]. Therefore both venous congestion and lower perfusion might be considered in these patients.
BMI >25 kg/m2 was found to be associated with IAH development after kidney transplantation, as previously reported in ICU patients [31]. This could be explained first by a direct mass effect of abdominal adipose tissue on IAP measurement and secondly by a decrease in abdominal wall compliance [32]. Moreover, as weight gain is achieved based on dry weight, fluid load is excessively high in obese patients, considering that their overweight is not due to an increase in dry mass. On the other hand, a history of peritoneal dialysis was found to be protective against IAH development. One explanation might be related to an increased intraperitoneal compliance, which has been described after peritoneal dialysis initiation, as dialysate volume correlates with intraperitoneal pressure [33–35]. Interestingly, it has already been reported that DGF is less frequent in patients with a previous history of peritoneal dialysis, with the common thought that their overhydration status was protective [36]. Our results suggest that the protective effect of peritoneal dialysis on graft function recovery could be related to a protective effect against IAH development. Finally, autosomal dominant polycystic kidney disease was more frequent in IAH patients, but no significant difference was found regarding causal nephropathy according to IAH status.
While our study is the first prospective study reporting IAH incidence after kidney transplantation, we cannot ignore some limitations. First, this was a monocentric study, although our population and protocol are similar to those of other centres. Another limitation is the relatively small sample size of our population. While this study was a pilot study, there is a need for larger multicentric studies to confirm these results. Although anastomosis time has been reported to be associated with DGF in previous studies, warm ischaemia time data were unavailable in our cohort. Finally, high polycystic kidney disease prevalence is supposed not to be without consequences on IAH incidence (because of intra-abdominal polycystic organomegaly), although causal nephropathy was not associated with IAH development in our cohort.
In summary, this prospective observational study where standard objectives of hyperhydration were used in the early post-kidney transplantation period suggests a high incidence of IAH and a strong association between IAH Grades III and IV and impaired graft function. BMI >25 kg/m2 was associated with IAH development, whereas a history of peritoneal dialysis was protective. These results raise both the major interest for IAP monitoring in these patients and the need for larger interventional studies to improve their haemodynamic management.
SUPPLEMENTARY DATA
Supplementary data are available at ndt online.
CONFLICT OF INTEREST STATEMENT
The authors declare no conflicts of interest.
AUTHORS’ CONTRIBUTIONS
V.D. and A.D. developed the research idea. V.D., A.D. and C.B. participated in the study design. V.D. and D.M. participated in data acquisition. A.L. and C.B. participated in statistical analysis. V.D., A.D. and P.R. participated in data interpretation. Each author contributed important intellectual content during manuscript drafting. A.D. and P.R. provided supervision.


Comments