


Abstract
The objective of this study was to establish if renal transplant outcomes (graft and patient survival) for young adults in England were worse than for other age groups.
Outcomes for all renal transplant recipients in England (n = 26 874) were collected from Hospital Episode Statistics and the Office for National Statistics databases over 12 years. Graft and patient outcomes, follow-up and admissions were studied for all patients, stratified by age bands.
Young adults (14–23 years) had substantially greater likelihood [hazard ratio (HR) = 1.26, 95% confidence interval (CI) 1.10–1.19; P < 0.001] of kidney transplant failure than any other age band. They had a higher non-attendance rate for clinic appointments (1.6 versus 1.2/year; P < 0.001) and more emergency admissions post-transplantation (25% of young adults on average are admitted each year, compared with 15–20% of 34- to 43-year olds). Taking into account deprivation, ethnicity, transplant type and transplant centre, in the 14- to 23-year group, return to dialysis remained significantly worse than all other age bands (HR = 1.41, 95% CI 1.26–1.57). For the whole cohort, increasing deprivation related to poorer outcomes and black ethnicity was associated with poorer outcomes. However, neither ethnicity nor deprivation was over-represented in the young adult cohort.
Young adults who receive a kidney transplant have a significant increased likelihood of a return to dialysis in the first 10 years post-transplant when compared with those aged 34–43 years in multivariable analysis.
What is already known on this subject?
Young adults face major challenges as they transition from paediatric services and adjust to independence.
What this study adds?
Data for England demonstrates that young adults lose their kidney transplants and require dialysis at a far higher rate than other aged patients. This may relate to non-concordance with medication and clinic appointments. Development of young adult services may improve transplant outcomes.
What impact this may have on practice or policy?
Funding requirements for Young Adult Services require evidence of need as demonstrated here. Further study is needed on interventions to reverse the increased renal graft loss in young adults.
INTRODUCTION
For many patients with end-stage renal failure, renal transplantation offers improved overall outcomes for mortality and quality of life; this is especially true in young adults [1]. There has been a lot of recent interest in the care of young adults with renal transplants, including the transfer of care between paediatric and adult services. This coincides with challenges of puberty, establishing independence and transfer from school into university or employment. Young adults face many pressures: establishing sexual relationships, increased responsibility for their own healthcare and independence from the protective influence of their parents. Risk-taking behaviours are high in this age group [2] although recent data [3] show lower risk-taking behaviours in young adults on renal replacement therapy compared with the general population. Management of chronic illness in young adults compounds this already complex situation. In meta-analysis, 32% of adolescent kidney transplant recipients were reported to be non-adherent [4] with levels of non-compliance four times that of adults [5]. Adolescents have previously been reported to have the highest rates of rejection-related graft loss of any age group [6]. Internationally, adolescent transplant patients have poorer graft survival compared with younger children and older adults [7, 8]; in the USA, this may be affected by the availability of health insurance [7].
Several strategy documents in the UK have proposed that young people with chronic disease require coordinated and specialized care [9, 10], with National Institute for Health and Care Excellence guidance [11] emphasizing the importance of detailed planning and a person-centred approach. There has been much interest in the development of transition and young adult services which include joint clinics between the multidisciplinary teams in paediatric and adult care, with the addition of Youth Workers, Social Workers and family support to provide holistic care [12]. Currently, young adult services vary widely across the UK, with different interpretations of what a transition service should entail [13].
We know that in population health economics, poor child and young adult health has a high societal cost. Renal transplant failure requiring dialysis is expensive, outcomes for subsequent transplants are worse and costs of chronic disease management are high. In addition, poor outcomes result in loss of ability to work and early dependence [14]. The outcome of adolescent transplant patients has not previously been reported for data from England. In this article, we look at renal transplant outcome by age and the effect of young adulthood on transplant and patient survival.
MATERIALS AND METHODS
Study design
This was a retrospective, observational cohort study performed on national data sets. Using Hospital Episode Statistics (HES) data, information on all UK National Health Service (NHS)-funded renal transplants [Office of Population Censuses and Surveys Classification of Interventions and Procedures, 4th revision (OPCS-4) codes [15] M01.2–M01.9—full description in Supplementary data, Table S1] performed at any English kidney transplant centre, between 1 April 2006 and 31 March 2018 were included. Patients not resident in England, patients with previous renal transplants and combined organ transplants (kidney with another organ) were excluded from the analysis. Follow-up data were taken until the end of the study (31 March 2019).
This study did not require institutional review board approval due to the pseudo-anonymized nature of the data retrieved—data were linked by NHS Informatics utilizing a specific HES ID code and avoided patient identifiable codes. This observational study was registered with the local Clinical Audit Department (Clinical Audit Registration and Management System number 13816). Data were used in line with the data-sharing agreement with NHS-Digital (for original datasets application to NHS-Digital required).
Demographic data included age at transplant, ethnicity and social deprivation quintile, based on the Indices of Multiple Deprivation, a statistical analysis of 37 indicators to measure relative social deprivation in areas of England. Details on the classification of the donor and location of transplant surgery were also collected.
Data sources
Data were obtained from HES, an administrative data warehouse containing all NHS-funded hospital admissions in England [16]. Data extraction was facilitated utilizing codes on procedural classifications (OPCS-4) [15].
With regard to outcome analysis, HES data alone have the limitation of only capturing deaths occurring in a hospital setting. Therefore, to obtain complete mortality data, the study cohort was cross-referenced with mortality data from the Office for National Statistics (ONS) [17] which collects information on all registered deaths in England and Wales. Underlying population estimates were obtained from the ONS mid-year population estimates.
Data quality and collection
We adhered to the principles of the STrengthening the Reporting of Observational studies in Epidemiology statement and have reported this article in accordance with recommended guidance [18]. In addition, we checked data accuracy from the HES database regarding transplant activity by corroborating HES data with the UK National Transplant database (where all transplant activity must be mandatorily reported). Transplant activity over the same dates as the study period was cross-checked between both databases to ascertain any discrepancy between data sets, restricting the national transplant database to centres based in England (Supplementary data, Table S2). Data sets for transplantation are very complete, and there were no exclusions due to missing age and sex data; we have included a category ‘unknown’ for ethnicity and deprivation.
All patients were divided into age bands at transplantation; a paediatric cohort was defined as those patients between 4 and 13 years; a young adult cohort as 14–23 years and subsequent 10-year age bands up to the age of 74 years. This division was pragmatic as the young adult age band was based on the age provision of our young adult renal services (we start Transition Clinics in our Children’s Hospital at 14 years and start to see patients at the Adult Hospital at 16 years, transferring them out of the Young Adult Service aged 24 years), the children’s age band, therefore, the 10 years preceding this and the other adult age bands in 10-year cohorts thereafter. Sensitivity analyses were conducted to check that the UN definition of youth (18–29 years) did not change the results.
Numbers of admissions for patients in the first year after transplant (involving the highest incidence of transplant complications and rejection) and in the first 5 years after transplant were based on HES admissions, and average length of stay for these admissions was calculated from the HES data.
Outcome data were collected for return to dialysis, death, graft loss and retransplant. Return to dialysis was identified if a patient had any record of a procedural or diagnosis code relating to dialysis 6-week post-transplant; the OPCS-4 codes used were X40.1, X40.2, X40.3, X40.4 and X40.5, and the diagnosis codes were Z99.2, Z49.1 and Z49.2. Graft loss was defined as the return to dialysis, retransplantation (M01*), removal of the transplanted organ (M02.6, M02.7) or death.
Statistical methods
Primary outcome measures were graft failure, defined by dialysis >6 weeks post-transplantation, graft removal, retransplantation or death. Stata software (StataCorp. 2015 Stat Statistical Software: Release 15; StataCorp LP, College Station, TX, USA) was utilized for data analysis. Descriptive analyses were used to estimate frequencies; categorical variables are presented as numbers and percentages (%) and continuous variables as median and interquartile range (IQR) (all continuous variables violated the Normality Assumption). Difference between groups was assessed by Chi-squared test for categorical variables and Kruskal–Wallis test to compare continuous variables. P-values <0.05 and <0.001 in statistical analyses were considered significant and highly significant, respectively. Groups were compared using the young adult cohort (16–23 years) and comparing this to the adult cohort aged 34–43 years (this was based ‘stable’ adult life with few complications of age-related comorbidities).
We also compared population statistics for our patient groups to the general population using ONS population estimates so that we were able to understand the incidence of renal transplants in each patient group within the general population.
Survival analyses were performed by the generation of Kaplan–Meier curve estimates. To understand whether ethnicity, transplant type, deprivation or transplant centre influences survival, Cox regression analysis was performed for time to graft failure with these factors. The Cox model included a shared frailty term for hospital provider, to account for the anticipated correlation within hospitals, and the Efron method was used for ties. Age and deprivation were added to the model as categorical variables. Age bands were compared with the mid-age band of 34–43 years. Cox regression expressed as hazard ratios (HRs), 95% confidence intervals (CIs) and P-values. The proportional hazard assumption was checked using Schoenfeld residuals; no covariate was found to violate the proportional hazards.
Rates of non-attendance for renal transplant patients were calculated using the national codes for ‘did not attend’, ‘arrived late and could not be seen’ and ‘appointment cancelled by or on behalf of patient’. These were collected as absolute numbers in each age band.
RESULTS
Between 1 April 2006 and 31 March 2018, HES reported 29 081 transplants performed in the UK across 28 centres. Comparing these numbers to the official statistics from NHS Blood and Transplant, the HES figures have captured 98.0% of the kidney transplants and there was a good year-on-year agreement (>95%) for all years. After excluding transplants where the patient had a previous kidney transplant (from 2001 onwards) (n = 1608), those where the patient was <4 years old (n = 198), those where the patient was not resident in England (n = 571), combined organ transplantation (n = 1663), autologous transplants (n = 178) and 17 records for administrative issues, that is, records recorded in centres that are not renal transplant centres or where there existed a record of death prior to patient being admitted; 24 846 transplants remained. Overall, more males (62%) were transplanted than females (38%; Table 1). The majority of transplants occurred in Caucasian patients (66%). The median (IQR) age for the whole cohort was 49 years (38–60). The largest proportion of transplants was carried out on patients between the ages of 44 and 53 years (25%), with the smallest percentage of transplants performed in the youngest age group (4–13 years—2%).
Renal transplants in England from April 2006 to March 2018 split by 10-year age group cohorts detailing population incidence, demographics, ethnicity, deprivation index and transplant type
| All transplants | Age group (years) | ||||||||
|---|---|---|---|---|---|---|---|---|---|
| 4–13 | 14–23 | 24–33 | 34–43 | 44–53 | 54–63 | 64–73 | 74+a | ||
| Number of transplants, n (%) | 24 846 | 571 (2.3) | 1343 (5.4) | 2780 (11.2) | 4223 (17.0) | 6096 (24.5) | 5771 (23.2) | 3647 (14.7) | 415 (1.7) |
| Incidence of renal transplantation in gen. pop./100 000, median (IQR)b | 0.76 (0.70–0.83) | 1.67 (1.58–1.76) | 3.21 (3.09–3.33) | 4.80 (4.65–4.94) | 6.88 (6.71–7.05) | 7.72 (7.52–7.92) | 6.12 (5.93–6.32) | 0.75 (0.68–0.83) | |
| Male, n (%) | 15 323 (61.7%) | 330 (57.8) | 816 (60.8) | 1685 (60.6) | 2535 (60.0) | 3734 (61.3) | 3634 (63.0) | 2307 (63.3) | 282 (68.0) |
| Ethnic group, n (%)a | |||||||||
| White | 16 393 (66.0) | 347 (60.8) | 922 (68.7) | 1771 (63.7) | 2715 (64.3) | 3962 (65.0) | 3819 (66.2) | 2542 (69.7) | 315 (76.0) |
| Asian | 2975 (12.0) | 101 (17.7) | 156 (11.6) | 380 (13.7) | 532 (12.6) | 635 (10.4) | 769 (13.3) | 371 (10.2) | 30 (7.0) |
| Black | 1756 (7.1) | 28 (4.9) | 61 (4.5) | 166 (6.0) | 383 (9.1) | 566 (9.3) | 364 (6.3) | 160 (4.4) | 30 (7.0) |
| Mixeda | 285 (1.2) | 21 (3.7) | 26 (1.9) | 48 (1.7) | 45 (1.1) | 71 (1.2) | 50 (0.9) | 22 (0.6) | 5 (0.7) |
| Other | 1057 (4.3) | 29 (5.1) | 60 (4.5) | 137 (4.9) | 180 (4.3) | 257 (4.2) | 232 (4.0) | 143 (3.9) | 20 (4.6) |
| Unknown | 2379 (9.6) | 45 (7.9) | 118 (8.8) | 278 (10.0) | 368 (8.7) | 605 (9.9) | 537 (9.3) | 409 (11.2) | 20 (4.6) |
| Deprivation quintile, n (%) | |||||||||
| 1 (most deprived) | 5690 (22.9) | 164 (28.7) | 350 (26.1) | 792 (28.5) | 1088 (25.8) | 1456 (23.9) | 1199 (20.8) | 581 (15.9) | 60 (14.5) |
| 2 | 5283 (21.3) | 115 (20.1) | 282 (21.0) | 667 (24.0) | 975 (23.1) | 1266 (20.8) | 1197 (20.7) | 711 (19.5) | 70 (16.9) |
| 3 | 4700 (18.9) | 94 (16.5) | 228 (17.0) | 501 (18.0) | 746 (17.7) | 1180 (19.4) | 1167 (20.2) | 711 (19.5) | 73 (17.6) |
| 4 | 4276 (17.2) | 90 (15.8) | 225 (16.8) | 403 (14.5) | 652 (15.4) | 1044 (17.1) | 1015 (17.6) | 762 (20.9) | 85 (20.5) |
| 5 (least deprived) | 4188 (16.9) | 96 (16.8) | 230 (17.1) | 341 (12.3) | 622 (14.7) | 975 (16.0) | 1024 (17.7) | 786 (21.6) | 114 (27.5) |
| Unknown deprivation | 709 (2.9) | 12 (2.1) | 28 (2.1) | 76 (2.7) | 140 (3.3) | 175 (2.9) | 169 (2.9) | 96 (2.6) | 13 (3.1) |
| Transplant type, n (%)a | |||||||||
| Allotransplantation from live donor | 8931 (35.9) | 278 (48.7) | 741 (55.2) | 1367 (49.2) | 1689 (40.0) | 2144 (35.2) | 1760 (30.5) | 879 (24.1) | 75 (18.0) |
| Allotransplantation from cadaver NEC | 5609 (22.6) | 197 (34.5) | 287 (21.4) | 556 (20.0) | 957 (22.7) | 1387 (22.8) | 1332 (23.1) | 795 (21.8) | 100 (24.0) |
| Allotransplantation from cadaver heart beating | 4937 (19.9) | 50 (8.8) | 177 (13.2) | 532 (19.1) | 928 (22.0) | 1276 (20.9) | 1114 (19.3) | 765 (21.0) | 95 (23.0) |
| Allotransplantation from cadaver heart nonbeating | 5190 (20.9) | 37 (6.5) | 127 (9.5) | 308 (11.1) | 621 (14.7) | 1248 (20.5) | 1522 (26.4) | 1182 (32.4) | 145 (35.0) |
| Other/unspecified transplantation of kidneyb | 180 (0.7) | 9 (1.6) | 11 (0.8) | 17 (0.6) | 28 (0.7) | 41 (0.7) | 43 (0.7) | 26 (0.7) | 5 (1.0) |
Denotes small numbers (<6) are present, values in this column for identified categories and corresponding total have been rounded to the nearest five.
This shows the incidence in the general population per 100 000 people. The population statistics have been taken from annual ONS single year of age mid-year population estimates.
There were eight paediatric centres which performed the majority of transplants in the period of interest, with Great Ormond Street and Guy’s performing the highest numbers of paediatric renal transplants (Figure 1). Renal transplants in young adults (aged 14–23 years) were widely performed across all adult centres.
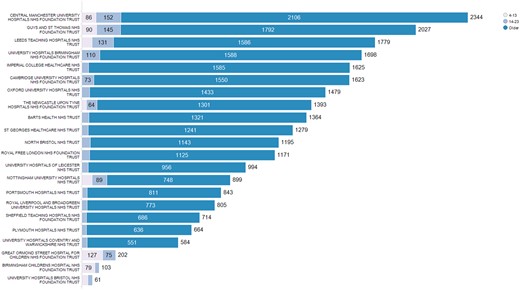
Renal transplant by centre: total numbers of transplants and numbers of transplants in children and young adults.
In young adults, 1343 transplants were performed (Table 1), and more of these patients were male (61%). The young adult cohort represented 5% of all patients receiving transplants. Live donation took place in 36% of all renal transplants and this was proportionally higher in children (49% of all transplants in this group) and in young adults (55% of these transplants).
Outcomes
Outcomes vary by age. The most dramatic finding in this data is that when divided into 10-year cohorts, young adults between 14 and 23 years of age experience a return to dialysis at a much higher rate than any other age band (Figure 2). Taking into account deprivation, ethnicity, transplant type and transplant centre, in the 14- to 23-years group, return to dialysis remains significantly worse than all other age bands and compared with the 34- to 43-year-old band had a 1.15 times adjusted, increased risk of graft lost (HR = 1.41, 95% CI 1.26–1.57; P < 0.001) (Table 2).
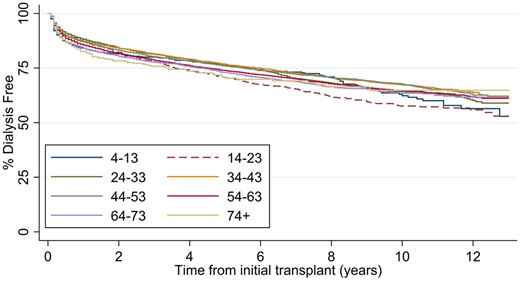
Dialysis free, renal transplant survival, divided by age groups for all renal transplants in England, April 2006 to March 2018.
Cox regression comparing young adults with 34- to 43-year-old adults
| Time to death | Return to dialysis | |||||
|---|---|---|---|---|---|---|
| HR (95% CI) | P-value | HR (95% CI) | P-value | Any graft failure | P-value | |
| Sex | 0.93 (0.87–1.00) | 0.054 | 1.07 (1.02–1.13) | 0.004 | 1.03 (0.99–1.08) | 0.098 |
| Deprivation | ||||||
| 1 (most deprived) | 1 (baseline) | 1 (baseline) | 1 (baseline) | |||
| 2 | 0.85 (0.77–0.94) | 0.002 | 0.93 (0.87–0.99) | 0.002 | 0.91 (0.85–0.97) | 0.002 |
| 3 | 0.88 (0.79–0.97) | 0.014 | 0.89 (0.82–0.95) | 0.001 | 0.89 (0.83–0.94) | <0.001 |
| 4 | 0.77 (0.69–0.86) | <0.001 | 0.83 (0.77–0.90) | <0.001 | 0.83 (0.77–0.89) | <0.001 |
| 5 (least deprived) | 0.66 (0.59–0.74) | <0.001 | 0.76 (0.70–0.83) | <0.001 | 0.73 (0.68–0.78) | <0.001 |
| Ethnic group | ||||||
| White | 1 (baseline) | 1 (baseline) | 1 (baseline) | |||
| Asian | 0.96 (0.85–1.07) | 0.439 | 1.06 (0.98–1.14) | 0.129 | 1.06 (0.99–1.14) | 0.098 |
| Black | 0.88 (0.76–1.03) | 0.113 | 1.33 (1.21–1.45) | <0.001 | 1.29 (1.19–1.40) | <0.001 |
| Mixed | 0.83 (0.56–1.22) | 0.334 | 0.96 (0.76–1.20) | 0.706 | 0.94 (0.76–1.15) | 0.535 |
| Other | 0.76 (0.60–0.95) | 0.014 | 1.01 (0.89–1.15) | 0.885 | 0.98 (0.88–1.11) | 0.788 |
| Unknown | 0.85 (0.74–0.97) | 0.014 | 1.03 (0.95–1.13) | 0.444 | 1.00 (0.93–1.08) | 0.963 |
| Transplant type | ||||||
| Allotransplantation from live donor | 1 (baseline) | 1 (baseline) | 1 (baseline) | |||
| Allotransplantation from cadaver NEC | 1.70 (1.55–1.87) | <0.001 | 1.78 (1.66–1.89) | <0.001 | 1.77 (1.68–1.88) | <0.001 |
| Allotransplantation from cadaver heart beating | 1.55 (1.39–1.73) | <0.001 | 1.66 (1.55–1.79) | <0.001 | 1.62 (1.52–1.73) | <0.001 |
| Allotransplantation from cadaver heart non-beating | 1.54 (1.39–1.70) | <0.001 | 1.70 (1.58–1.83) | <0.001 | 1.65 (1.55–1.76) | <0.001 |
| Other specified transplantation of kidney | 0.52 (0.07–3.73) | 0.519 | 2.55 (1.27–5.13) | 0.009 | 2.29 (1.19–4.42) | 0.014 |
| Unspecified transplantation of kidney | 2.07 (1.46–2.92) | <0.001 | 2.02 (1.57–2.61) | <0.001 | 2.11 (1.68–2.65) | <0.001 |
| Age group (years) | ||||||
| 4–13 | 0.43 (0.27–0.70) | 0.001 | 1.12 (0.94–1.34) | 0.205 | 1.05 (0.89–1.25) | 0.557 |
| 14–23 | 0.49 (0.36–0.67) | <0.001 | 1.41 (1.26–1.57) | <0.001 | 1.29 (1.16–1.44) | <0.001 |
| 24–33 | 0.52 (0.42–0.65) | <0.001 | 1.08 (0.99–1.19) | 0.092 | 1.03 (0.94–1.12) | 0.56 |
| 34–43 | 1 (baseline) | 1 (baseline) | 1 (baseline) | |||
| 44–53 | 1.52 (1.33–1.74) | <0.001 | 1.00 (0.92–1.08) | 0.949 | 1.12 (1.04–1.20) | 0.003 |
| 54–63 | 3.03 (2.67–3.44) | <0.001 | 1.10 (1.02–1.19) | 0.013 | 1.42 (1.33–1.52) | <0.001 |
| 64–73 | 6.02 (5.29–6.84) | <0.001 | 1.16 (1.07–1.27) | 0.001 | 1.93 (1.79–2.08) | <0.001 |
| 74+ | 9.40 (7.71–11.45) | <0.001 | 1.16 (0.95–1.41) | 0.134 | 2.21 (1.90–2.57) | <0.001 |
| Theta | 0.015 (0.007) | 0.032 (0.011) | 0.016 (0.006) |
Taking into account deprivation, ethnicity, transplant type and transplant Centre, in the 14- to 23-years group, graft failure remains significantly worse than all other age bands and compared with the 34- to 43-year-old band had a 1.41 times increased risk of graft lost
This loss results in return to dialysis, not death. Death is not increased in this age band (Figure 3). When combined outcomes of death, retransplant and return to dialysis are considered, the young adults again have poorer outcomes compared with 34- to 43-year olds (HR = 1.29, 95% CI 1.16–1.44; P < 0.0001) (Figure 4).

Patient survival from renal transplant to death divided by age groups for all renal transplants in England, April 2006 to March 2018.
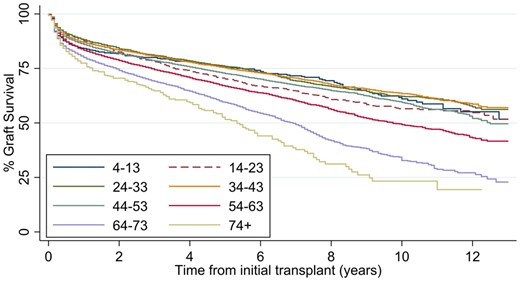
Graft survival from renal transplant to dialysis, retransplant or death divided by age groups for all renal transplants in England, April 2006 to March 2018.
For the whole cohort, deprivation index is related to outcome; increasing deprivation relates to poorer outcomes with increased transplant failure. This has been demonstrated before, including in children [19]. Ethnicity also influences outcome, and black ethnicity is associated with poorer outcomes (as above, black ethnicity and deprivation are not, however, overrepresented in the young adult cohort).
Admissions and follow-up
Young adults had a similar median number of outpatient (OP) visits per patient in the first year post-transplant (Table 3), but within the second to fifth years post-transplant, young adults had more visits when compared with 34- to 43-year olds. Non-attendance was similar between groups in the first year but was higher in the young adult group after the first year. More than 25% of young adults missed more than five OP appointments per year in Years 2–5.
Renal transplants in England April 2006 to March 2018, detailing post-transplant activity [OP visits, non-attendance rates, emergency admissions and inpatient (IP) length of stay] by age, up to 5 years post-transplant
| Age group (years) | OP visits/pt first year | OP visits/ pt second–fifth years | OP visits not attended/pt first year | OP visits not attended/pt second–fifth years | IP length of stay/pt first year | IP length of stay/pt second–fifth years | Emergency admissions/pt first year | Emergency admissions/pt second–fifth years |
|---|---|---|---|---|---|---|---|---|
| 4–13 | 40 (28–52, 73) | 50 (33–69, 120) | 2 (0–4, 8) | 4 (2–10, 21) | 19.75 (13–33.25, 67.5) | 22.3 (12.3–37, 112.5) | 2 (1–4, 8) | 2 (1–5, 11) |
| 14–23 | 34 (26–44, 65) | 31 (19–50, 100) | 2 (1–5, 12) | 6 (2–14, 29) | 14 (9.25–22.75, 55.5) | 13 (6.3–32.5, 123.25) | 1 (0–3, 6) | 1 (0–4, 11) |
| 24–33 | 34 (27–43, 59) | 28 (17–46, 90) | 2 (1–5, 11) | 6 (2–12, 28) | 12.25 (8.75–19.5, 50) | 11 (5.8–24.3, 87.75) | 1 (0–2, 5) | 1 (0–3, 9) |
| 34–43 | 34 (27–43, 59) | 29 (18–47, 97) | 2 (1–4, 10) | 4 (1–10, 25) | 12.75 (9–20.5, 54) | 11.3 (6–24, 88.5) | 1 (0–2, 5) | 1 (0–3, 8) |
| 44–53 | 35 (28–44, 62) | 30 (19–48, 92) | 2 (1–4, 9) | 3 (1–8, 22) | 13.25 (9.25–22, 55.5) | 11.8 (6.3–25, 91.75) | 1 (0–2, 5) | 1 (0–3, 8) |
| 54–63 | 37 (29–45, 63) | 33 (19–52, 102) | 2 (1–4, 9) | 3 (1–7, 18) | 15 (10.25–26.75, 68.25) | 13.8 (6.8–30, 108) | 1 (1–3, 6) | 1 (0–3, 8) |
| 64–73 | 36 (28–45, 64) | 33 (17–52, 96) | 2 (1–4, 9) | 2 (0–6, 16) | 16.5 (10.75–30.25, 83.75) | 15.3 (6.8–35.8, 122.75) | 1 (1–3, 6) | 1 (0–3, 8) |
| 74+ | 36 (27–44, 63) | 29 (13–49, 91) | 2 (0–4, 8) | 2 (0–5, 14) | 19.75 (11.25–38, 90.25) | 16.3 (5.5–39.3, 118.5) | 2 (1–3, 6) | 1 (0–3, 7) |
| Comparison of young adult group vs 34- to 43-year olds, P-value | 0.3007 | 0.0272 | 0.005 | ≤0.001 | 0.0034 | ≤0.001 | 0.0057 | ≤0.001 |
Median numbers with IQR and 95th percentile in brackets. pt, patient.
The number of emergency admissions and median length of stay was not higher in admitted young adults in the first post-transplant year, but length of stay was longer in young adults in the second to fifth years post-transplant (13 versus 11.5 days; P < 0.001), and there were also more emergency admissions in the young adult group in Years 2–5 (distribution changes, P ≤ 0.001 (Table 3).
DISCUSSION
Differences in transplant outcomes dependent on age have been previously documented in the literature but not for England [20–25]. We believe this is the largest study in Europe of outcomes following kidney transplantation for young adults. Here, we show that young adults have worse outcomes after renal transplantation than any other age group, specifically an increased return to dialysis (HR = 1.15, 95% CI 1.1–1.19) in the first 10 years post-transplant when compared with those aged 34–43 years in multivariable analyses.
Although this does not result in early death in this data, it is likely that transplant loss in young adults will impact overall life expectancy in this group as well as reducing health, quality of life and ability to work. This is deleterious to health economics through lost workforce and the high cost of healthcare, particularly since the economic cost of returning to dialysis is high [26].
Black ethnicity has previously been reported to be associated with poorer transplant outcomes [27] and live transplantation with improved outcomes [28], which were consistent with our data. Poverty and deprivation have previously been reported to be associated with [29] and irrelevant to [30] outcomes; in our data, they were associated with poorer outcomes. The overall poorer outcomes in the young adult cohort were not a result of these factors however, since in multivariable analysis, the risk of graft lost remained high in this age group after adjustment.
This study covers data for the whole of England. There are several limitations. The age bands are arbitrary based on the generally accepted young adult service age. Patients are classified dependent on the age at transplant. Transplant centres may transfer patients back to the referring centre for follow-up so that the referring centre may have a larger impact on outcome than the transplant centre. Antibody mismatch at transplantation, peak panel reactive antibody, baseline function, graft age, immunosuppression, pregnancy and disease recurrence are not included in the national datasets and, therefore, cannot be adjusted for. Finally, causes of renal failure are not included in this study; these are likely to be significantly different between younger cohorts where genetic and congenital disease predominate, and the older groups where diabetes and vascular disease are more prevalent.
The most influential reason for poor outcomes is likely to be poor concordance with medication, which has been widely reported in this age group [13, 31, 32]. Tackling the issue of compliance in this particular patient group is difficult, with education, access to a multidisciplinary team and close monitoring likely to influence outcome. Rates of non-compliance can be substantially reduced by implementing regular patient contact [33] and tailored intensified interventions [34]. However, the ability to translate this into meaningful patient care outcomes is difficult to assess [35]. Anecdotally within our service, young adults report high satisfaction with such interventions and reduction in non-compliance rates.
A transitional/young adult care model can contribute to the complex needs of young adult patients [36, 37]. Patients report finding the traditional adult clinic setting daunting and impersonal with limited continuity of care [38, 39], and feelings of alienation with beneficial peer-support lost [40]. There has been a recent drive to improve patient empowerment and increase patients’ control over their own illness, with an emphasis on self-management and patient education [41]. A nationwide study is attempting to understand the how renal disease has impacted the young adults’ life with the aim of identifying areas of healthcare that could be targeted to improve patient experience [3, 42]. This group has already surveyed transition services in the UK and found that only 55% of adult units have a dedicated service [43].
National projects are underway to introduce transition services for young adults [37] including the Renal Association transition programme [44], guidance from the Royal College of Physicians [40] and the Department of Health [45]. The ‘ready, steady go’ programme [46] provides a generic transitional care toolkit, which is adaptable to multiple specialties [47]. Internationally, the need for young adult services has been endorsed by the International Society of Nephrology [48] but has not been widely adopted [49]. In Canada, undetectable calcineurin inhibitor levels dropped from 63% to 19% in adolescents in a structured transition programme [50] and in Zurich, a significantly lower rate of decline in estimated glomerular filtration rate and reduction in acute rejection episodes was noted in transplanted adolescents under transitional care [51].
Cost estimates indicate the average yearly per-patient cost is higher for non-transitioned patients compared with a transitioned cohort [52]. The cost of dialysis in the UK is approximately £30 800/patient/year compared with the cost of renal transplant immunosuppression of £5000, leading to a cost-benefit of transplantation in the second and subsequent years of £25 800 [53].
In summary, data in England show that young adults have substantially worse outcomes for renal transplantation than all other age groups. Young adult support services are likely to be a key intervention in changing this.
ACKNOWLEDGEMENTS
The authors acknowledge the multidisciplinary team involved in provision of the Young Adult service.
AUTHORS’ CONTRIBUTIONS
T.P. is the Consultant Nephrologist and contributed to research design, writing the article, performance of the research and data analysis; F.E. is the Principal Research Informatician and was involved in writing the article, performance of the research and data analysis; J.M. is the Information Analyst contributed to data analysis; S.W. is the Paediatric trainee and was involved in writing the article; L.K. is the Consultant Paediatric Nephrologist and was involved in writing the article, performance of the research and data analysis; and G.L. is the Consultant Nephrologist and was involved in writing the article, performance of the research and data analysis.
CONFLICT OF INTEREST STATEMENT
The authors declare no conflicts of interest.
REFERENCES
Department of Health and Social Care. Quality criteria for young people friendly health services. ‘You’re Welcome’, the Department of Health’s quality criteria for young people friendly health services.
CareQuality Commission. From the Pond to the Sea: Children Transition to Adult Health Services.
NICE Guidance NG43. Transition from Children’s to Adults’ Services for Young People Using Health or Social Care Services NICE Guideline [NG43].
British Association for Paediatric Nephrology Renal Association. Helping Adolescents and Young Adults with End Stage Renal Failure
NHS Digital. OPCS-4 Classification.
Office for National Statistics. https://www.ons.gov.uk/ (1 September 2019, date last accessed)
Collins AJ, Foley RN, Chavers B et al. United States Renal Data System 2011 Annual Data Report: Atlas of chronic kidney disease & end-stage renal disease in the United States. Am J Kidney Dis 2012; 59(1 Suppl 1):A7, e1–420
NHS Blood and Transplant. Organ Donation and Transplantation Activity Report 2016/17. https://nhsbtdbe.blob.core.windows.net/umbraco-assets-corp/4657/activity_report_2016_17.pdf (1 September 2019, date last accessed)
UK Department of Health, Child Health and Maternity Services Branch. Transition: Getting it Right for Young People. Improving the Transition of Young People with Long-term Conditions from Children’s to Adult Health Services.
Royal College of Physicians. Acute Care Toolkit 13: Acute Care for Adolescents and Young Adults.
Institute for Public Policy Research. Patients in Control: Why People with Long Term Conditions must be Empowered.
Renal Association British Association for Paediatric Nephrology. Transition and Young Adult – Patient Empowerment.
UK Department of Health and Social Care. Quality Criteria for Young People Friendly Health Services.
National Kidney Federation. Transplantation Cost Effectiveness.


Comments