


Abstract
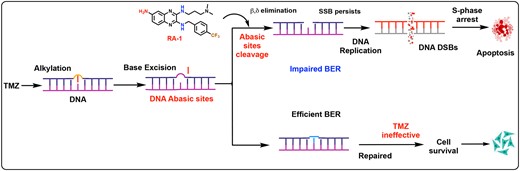
Temozolomide (TMZ) is widely used in cancer treatment, yet resistance to this agent limits its therapeutic effectiveness, particularly in mismatch-repair (MMR) deficient cancer. Concurrently, the Base Excision Repair (BER) pathway exerts a mitigating role. Our results demonstrated that the increasing TMZ concentrations correlate with an elevated accumulation of DNA abasic sites via the BER pathway in both MMR-proficient and deficient cancer cells, implicating abasic sites as promising targets to enhance the TMZ response. Amino-quinoxaline small molecules (RA-1) have been developed, whose hydrophobic core facilitates selective binding to apurinic/apyrimidinic (AP) sites, particularly adenine as the complementary nucleobase opposite to the AP-sites via base stacking. RA-1 effectively cleaves TMZ-induced DNA abasic sites in-vitro at minimal concentrations through Schiff-base formation. Remarkably, the combination of TMZ and RA-1 exerts a notable synergistic effect on both types of cells. The underlying mechanism of this synergy is rooted in the cleavage of TMZ-induced DNA abasic sites, which impairs the BER pathway, leading to the formation of DNA double-strand breaks. Consequently, the ATM-Chk2/ATR-Chk1 signalling pathways are activated, prompting S-phase arrest and ultimately driving apoptosis. These findings provide a compelling rationale for targeting DNA abasic sites to synergistically augment TMZ responses in both MMR-proficient and deficient cancer cells.
Introduction
The interplay between DNA repair mechanisms and the efficacy of DNA-damaging anticancer drugs is multifaceted and has divergent outcomes. Such that the dysregulated DNA repair pathways can either confer chemoresistance or enhance its cytotoxic effects. Thus, understanding these intricate interactions is crucial for developing rational strategies to overcome chemoresistance in cancer (1).
In this context, the DNA alkylating agent TMZ holds significant relevance and finds widespread use in cancer treatment. Under physiological pH conditions, TMZ generates an active species as a methyl diazonium cation that adds a methyl group to purine bases, particularly at the O6 position of guanine (O6-MeG; 6%), N3-adenine (N3-MeA; 9%), and N7 guanine residue (N7-MeG; 70%). Among them, the primary cytotoxic adduct, O6-MeG, can be directly repaired by the enzyme MGMT (methyl guanine-DNA methyltransferase), leading to an aberrant response and potential chemoresistance (2). However, if the O6-MeG lesion persists, it can form O6-MeG: T mispairs, which trigger the MMR pathway, proceeding in the futile cycling of DNA resection and processing, causing replication fork collapse and ultimately resulting in apoptotic cell death. In contrast, in MMR-deficient cancers, the mispairs formed by O6-MeG cannot provoke an MMR response, leading to cell survival even after the O6-MeG adducts persist (3).
Alongside the major percentage, around 80–85% of DNA adducts formed by TMZ include N7-MeG and N3-MeA, which spontaneously undergo depurination to create cytotoxic abasic sites (AP sites) (4). The BER pathway predominantly processes these AP sites, eliminating drug-induced DNA damage and contributing to chemoresistance (5). It shows that alkylating agent resistance is the major obstacle to successful chemotherapy. Notably, several approaches have been explored to block BER pathways and synergize with alkylating agents by inhibiting BER proteins, such as (apurinic/apyrimidinic endonuclease 1) APE1 and (DNA polymerase β) Pol β (6,7). However, inhibiting APE1’s function may have unintended off-target effects, given its role in maintaining the transcription factors NF-kB and p53, and it has reduced efficacy in BRCA-deficient cancers (3,8). Thus, the exploration of alternative targets in the BER pathway is imperative to overcome alkylating resistance.
Defects in the MMR pathway have a pivotal role in the onset of colorectal cancer (CRC). The presence of pathogenic variants in MMR genes—MLH1, MSH2, MSH6 and PMS2—hinders their ability to detect and bind to mismatched base pairs, contributing to the development of CRC in approximately 15–20% of cases (9). Moreover, the existence of MMR deficiencies in multiple colorectal cancer cell lines presented us with the opportunity to assess the extent to which these DNA repair defects contribute to resistance against TMZ (10).
Despite the advancement in understanding alkylating agent resistance in cancer, inadequate work has been done to understand the significance of DNA abasic site cleavage by small molecules in cancer treatment. DNA abasic sites are among the most common DNA lesions, formed as crucial intermediates by the BER pathway and generated from both endogenous and exogenous factors. Collaterally, the abasic site structure can exist in an equilibrium between a ring-opened aldehyde form (1%) and a ring-closed acetal form (99%), with the aldehyde form being highly reactive towards amines (11). Heretofore, naphthalenophanes, methoxyamines, and related alkoxyamines were developed, capable of forming a covalent adduct with abasic sites to inhibit APE1 function. Additionally, naphthalenophanes can cleave abasic sites, but their relevant activity has not been extensively explored in cancer cells (5).
In our previous work, we emphasized the importance of quinoxaline amine for targeting DNA abasic sites (12). However, advancing its reactivity and permeability in cancer cells necessitated subsequent structural modifications. To address this issue in the current work, novel quinoxaline-based small molecules denoted as RA-1 to RA-6 containing various functionalities were synthesized. Experimental evidence showed that RA-1, a quinoxaline derivative with a para-trifluoromethyl benzyl substitution, exhibited enhanced DNA abasic site cleaving activity utilizing β and δ elimination mechanisms. Notably, it demonstrated a remarkably low IC50 in both MMR-proficient and deficient cancer cells.
Further investigations were carried out to explore combination strategies involving RA-1 and TMZ across different cancer cells with characteristics of MMR proficiency or deficiency. Interestingly, with increasing TMZ concentrations, DNA abasic site numbers were elevated in both MMR-proficient and deficient cancer cells. Thus, DNA abasic sites are the potential target that can synergize TMZ’s response. Consequently, the use of RA-1 to cleave DNA abasic sites showed a synergistic relationship with TMZ, resulting in DNA double-strand breaks (DSBs), S-phase cell cycle arrest, and eventually leading to apoptosis in both MMR-proficient and deficient cancer cells. Thus, understanding these intricate interactions between DNA repair mechanisms and DNA-damaging drugs is essential for developing rational strategies to overcome chemoresistance and improve cancer treatment outcomes. Thus, the study of small molecules that target DNA abasic sites represents a promising area of research for developing novel cancer treatments.
Materials and methods
Cell lines
Colorectal Carcinoma HCT116 (MLH1 deficient), Colorectal Adenocarcinoma HCT15 (MSH6 deficient) (13), HT29 (MLH1WT, MSH6WT), and Cervical Adenocarcinoma HeLa (MLH1WT, MSH6WT) were grown in DMEM media except that HCT15 was grown in RPMI media with 10% FBS and 1% antibiotic-antimycotic in a 37°C humidified incubator at 5% CO2. Cells HCT116, HCT15 and HT29 were procured from NCCS Pune (National Centre for Cell Sciences), India. Human stromal fibroblast cells (HS5) and human embryonic kidney cell line (HEK293) (14) were kind gifts from Dr Amitava Sengupta Lab, CSIR-IICB, India.
siRNA-mediated knockdown of MLH1
HT29 cells were transfected with MLH1 siRNA (sc-35943, Santacruz) at concentrations of 40 and 70 pmol, as well as non-targeting siRNA control (sc-37007, Santacruz), using siRNA transfection reagent (sc-29528) following the manufacturer's protocol. The collection of cells took place 72 h post-transfection, and the confirmation of MLH1 knockdown was conducted through western blot analysis. Subsequent experiments were carried out utilizing MLH1 siRNA at a concentration of 70 pmol.
In-vitro cell viability assay
Cells (HCT116, HCT15, HT29MLH1(WT), HT29MLH1(KD) and HeLa) were seeded at 5000 cells per well in 96-well plates. After 24 h, the cells were treated with the indicated doses of TMZ, RA-1, or their combination, prepared in DMSO. Cell viability was assessed using an MTT assay: 24 h for individual treatments and 48 h for combination treatments. Formazan crystals were dissolved in DMSO (150 μl) after adding 10 μl of 5 mg/mL MTT solution per well and incubating for 3 h. Absorbance at 570 nm was recorded using a Thermo Scientific Multiskan FC microplate reader. The interaction between TMZ and RA-1 was evaluated using the coefficient of drug interaction (CDI), calculated as CDI = AB/(A × B), where AB represents the ratios for the combination of the two-drug groups relative to the control, and A or B denotes the ratio of a single drug compared to the control. CDI < 1 indicates synergism, while CDI < 0.7 suggests significant synergism (15).
Clonogenic survival assay
For the clonogenic survival assay, (1–2 × 10⁴) cells were seeded per well in six-well plates. After 24 h, cells were continuously treated with specified doses of TMZ, RA-1, or their combinations for approximately 10–12 days until colonies were visible under a light microscope. Colonies were washed with 1 mL of PBS, fixed with a solution of acetic acid and methanol (1:7 vol/vol), and then stained with 1 ml of 0.5% crystal violet solution in PBS for 3 h/well. Whole-well images were scanned, and colony areas were quantified using ImageJ software (16).
Immunoblotting
For immunoblotting, cells were seeded in 35-mm plates and exposed to indicated doses of TMZ, RA-1, or both for 24 h in a humidified incubator with 5% CO2. Cells were then washed with PBS, lysed with 100 μl lysis buffer (RIPA buffer + 1× phosphatase inhibitor (Roche, PhosSTOP) + 1× protease inhibitor cocktail) on ice for 10 minutes, and sonicated for 10–15 seconds. After centrifugation, the supernatant containing cellular proteins was collected, and its concentration was measured by Bradford assay. Equal amounts of protein samples were prepared by adding 1× Laemmli sample buffer and heating at 95–100°C for 5 min. Samples were separated on SDS-PAGE gels, transferred onto PVDF membranes, and blocked with a 5% w/v skim milk powder solution in TBST for 1–2 h at room temperature. Primary antibodies (Supplementary Table S1) were incubated with the membrane overnight at 4°C, and secondary antibodies were incubated at room temperature for 1–2 h. After washing three times, western blots were visualized using the iBright imaging system (Thermo Fisher Scientific) or the BioRad ChemiDoc System with ECL Substrate (BioRad). Band intensity was quantified using ImageJ software.
AP sites quantification
After 24 h of TMZ treatment, genomic DNA was isolated using a BioVision genomic DNA isolation kit (Cat. #K281-50) and dissolved in TE buffer at a concentration of 0.1 μg/μl. AP sites were quantified using a colorimetric kit from BioVision (Supplementary Table S2) following the kit manual's protocol. This involved labelling DNA with ARP (Aldehyde Reactive Probe) and the kit's ARP reagent, which reacts selectively with aldehyde groups in the open ring form of AP sites. The ARP reagent attached biotin residues to the AP sites, enabling their quantification via an avidin-biotin assay. Quantification was achieved by detecting the colorimetric signal at 650 nm, with the exact number of AP sites determined based on a standard curve established using the ARP standard provided within the kit (DNA Damage Quantification Colorimetric Kit, Supplementary Table S2) (17).
AP-DNA cleavage assay
To study the cleavage of AP DNA by the synthesized compound, (double-stranded) dsDNA oligos labelled with Cyanine-5 fluorophore 22-UC were procured from SIGMA with a uracil base on one strand.
5′[Cyanine5]GCATACGACUGGACTTCGTGTC 3′
3′CGTATGCTGCCCTGAAGCACAG 5′
The complimentary oligonucleotides (1) and (2) were annealed by heating to 95 ºC for 2 min in a Tris buffer [100 mM KCl, 20 mM Tris–HCl pH 7.5, 0.1% (w/v) BSA, and 0.01% Tween-20]. Subsequently, the mixture was slowly cooled to room temperature. For AP site generation, annealed double-stranded dU containing DNA (2.5 μM) was incubated with UDG (0.5 U/μl) at 37°C for 30 min. Further, the cleavage reactions were then conducted using 250 nM dsDNA and RA compounds in a Tris buffer at the concentrations specified in the legend. Following overnight incubation at 37°C, the reactions were quenched by adding an equal volume of loading buffer containing formamide [comprising 95% vol/vol formamide, 20 mM EDTA and 0.025% wt/vol bromophenol blue], and the DNA was resolved in a 20% polyacrylamide gel in the presence of 8 M urea (18). Electrophoresis was carried out at 90 V for two hours in 1× Tris–borate–EDTA buffer, and then the Cy5 fluorophore-tagged oligos gel images were captured in the iBright imaging system.
AP plasmid DNA cleavage assay
The AP-pBR322 plasmid was prepared by subjecting the plasmid to depurination through heating at 70°C for 20 min in a solution containing 25 mM sodium acetate (pH 4.8). This process resulted in the formation of approximately 3 apurinic sites per DNA, following a previously established method (19). For the AP plasmid cleavage assay, the RA compounds were incubated with (0.2 μg) AP-pBR322 plasmid at 37°C for 20 min in sodium phosphate buffer (10 mM, pH 7.0), 10 mM NaCl and 1% DMSO. Subsequently, the reaction was quenched by the addition of a 1× loading buffer, and AP pBR322 Plasmid fragments were separated in 1% agarose in 1× TAE buffer. The gel images were captured in the BioRad ChemiDoc System.
Similarly, for the pH-dependent cleavage, the same protocol was followed using 0.5 μg of plasmid pBR322 except for the variation buffer pH (such as the pH: 6.0, 6.2, 6.4, 6.6, 6.8, 7.0, 7.2, 7.4).
Real-time fluorometric assay for AP-DNA cleavage
To determine the real-time (RT) cleavage activities of RA compounds in AP-DNA, the real-time fluorometric assay was done using dsDNA oligos containing fluorophore Texas Red (TexRd) (Excitation maxima 598 nm) in the 5′ end (b) and in complementary strand having quencher BHQ (Black hole quencher in the 3′ end (a) 22-FQ:
5′GCATACGACUGGACTTCGTGTC 3′ - BHQ
3′CGTATGCTGCCCTGAAGCACAG 5′ - TexRd
Both oligos (a) and (b) were annealed at a concentration of 20 μM in sodium phosphate buffer [10 mM sodium phosphate (pH 7.0), 10 mM NaCl, 1% DMSO, ddH2O] by incubating at 95°C for 2 min and slow cooling overnight. AP sites were generated on annealed oligos 22-FQ by incubating at 37°C for 1 h with UDG (1μl, 5000 Uml−1) in 1× UDG reaction buffer for a total volume of 120 μl (5). The activity of compounds-induced AP-DNA cleavage on the samples 22-FQ (final concentration 0.5 μM in 100 μl of sodium phosphate buffer pH 7.0) in microcuvettes (Starnar Scientific) was performed by adding 10 μM of compounds and incubated for 5 min at 37°C; subsequently, real-time readings were recorded in a Hitachi F-7000 fluorescence spectrophotometer. The real-time readings were conducted following the experimental parameters: λex = 598 nm; λem = 617 nm; slit widths = 10 nm; PMT voltage = 700 V; response = 8 s; run duration = 90 min. The experiment mentioned above was also conducted using a non-cleavable THF analogue, serving as a standard control referred to as 22-XQ (5′GCATACGACXGGACTTCGTGTC3’BHQ/3′CGTATGCTGCCCTGAAGCACAG 5′ – TexRd).
Gel shift assay
The native pBR322 plasmid was employed to assess the shift in the DNA band resulting from treatment with RA-1 and RA-6 as part of a DNA intercalation study. Reactions were conducted in sodium phosphate buffer (pH 7.0) and incubated at 37°C overnight. The DNA samples were subsequently separated on a 1% agarose gel for 4 h at 30 V (20). After the completion of gel electrophoresis, the gel was stained with EtBr (0.5 μg/ml) for 15 min. Further images were captured by the BioRad ChemiDoc System.
Synergistic evaluation of the DNA cleavage properties of TMZ and RA compounds
For the standard cleavage reaction, 0.5 μg of plasmid pBR322 was taken and incubated initially with TMZ for 2 h, followed by the addition of compounds RA-1 or RA-6 in 10 mM sodium phosphate buffer with 1% (v/v) DMSO. The reactions were carried out overnight under incubation at 37°C. Finally, the DNA bands were separated in 1% agarose gel, and images were captured in the BioRad ChemiDoc System.
AP-DNA binding assay using fluorescence spectroscopy
The fluorescence characteristics of RA-1 (20 μM) were investigated through titration experiments with native calf-thymus DNA (ctDNA) and (apurinic/apyrimidinic) AP-ctDNA at concentrations ranging from 10 to 100 μM bp. These experiments were conducted in a sodium phosphate buffer consisting of 10 mM sodium phosphate (pH 7.0), 10 mM NaCl, 1% DMSO and ddH2O. The Kd values for the binding of RA-1 with AP-DNA were calculated using GraphPad Prism 9.2.0.
To prepare the AP-ctDNA, 150 μl was taken from a stock solution of ctDNA (1 mg/ml) and incubated in 25 mM sodium acetate (pH 4.8) for 3 h at 37°C, followed by heating at 70°C for 20 min in sodium phosphate buffer. The resulting AP-ctDNA was precipitated using ethanol, stored at –20°C overnight, and collected by centrifugation at 13,000 rpm for 2 min, followed by washing three times with chilled 100% ethanol. Finally, the AP-ctDNA was dissolved in sodium phosphate buffer (pH 7.0), and its concentration was determined by measuring the absorbance at 260 nm using a molar extinction coefficient (23,000 M−1cm−1) in terms of base pairs (bp), as described previously (12). The experiment was conducted using a Hitachi F-7000 fluorescence spectrophotometer under the following conditions: excitation wavelength (λex) = 365 nm, emission wavelength (λem) = 380 nm to 700 nm, slit widths = 5 nm, PMT voltage = 700 V, and response time = 0.02 s. Finally, the dissociation constant (Kd) values for the binding of RA-1 with ctDNA and AP-ctDNA were calculated using GraphPad Prism 9.2.0.
Isothermal calorimetry (ITC) of AP-DNA with the RA-1 compound
The isothermal titration calorimetric (ITC) experiment was conducted using a Thermal Cal NANO ITC system, maintaining a constant temperature of 25°C. In the sample cell, a solution of ligand RA-1 (30 μM, 350 μl) was titrated with DNA duplex oligos (200 μM, 30 injections of 5 μl each). The DNA duplex oligos having different opposite bases to AP sites 22XN (5′GCATACGACXGGACTTCGTGTC3’ / 3′CGTATGCTGNCCTGAAGCACAG5’ [X = THF(Tetrahydrofuran), N = A, T, G, C] in sodium phosphate buffer [10 mM sodium phosphate (pH 7.0), 10 mM NaCl, 1% DMSO, ddH2O]. As a control experiment, the solution without the DNA duplex oligos in the sample cell was titrated to obtain the dilution heat of only the ligand. NanoAnalyze software was used to analyze the data for binding isotherm parameters.
Circular dichroism (CD) of AP-ctDNA and native ctDNA
This experiment was performed using a Jasco J815 spectropolarimeter in which the AP-ctDNA (20 μM bp) or native ctDNA (20 μM bp) was titrated with a range of concentrations of RA-1 (10 -120 μM) in sodium phosphate buffer [10 mM sodium phosphate (pH 7.0), 10 mM NaCl, 1% DMSO, ddH2O]. The ellipticity was recorded from 230 nm to 400 nm in a quartz cuvette (0.5 cm), and the scan speed was 100 nm/min.
DNA polymerase assay for in vitro BER activity
We followed the DNA polymerase assay protocol described by Yudkina et al. (21) using Cyanine-5 fluorophore-tagged 22-UC AP-DNA oligonucleotide. In a typical 20 μl reaction mixture, 250 nM AP-DNA (22-AP) was incubated overnight at 37°C with or without RA-1 (50 μM), APE1 (0.2 U/μl), Taq DNA Polymerase (0.2 U/μl), and dNTPs (200 μM each of dATP, dCTP, dGTP, and dTTP) in Tris Buffer containing 1× NEB Buffer (10 mM MgCl2) (Supplementary Table S2). Subsequently, according to the Rapid DNA ligation kit protocol, we added 1 μl of T4 DNA ligase (5U/μl) to the reaction mixture. The reactions were stopped by adding an equal volume of loading buffer containing formamide, and the DNA was separated in a 20% polyacrylamide gel with 8M urea. Electrophoresis was conducted at 90 V for two hours in 1× Tris–borate–EDTA buffer, followed by imaging of the Cy5 fluorophore-tagged oligos gel using the iBright imaging system.
AAG-neutral comet assay
Cells were treated with specified concentrations of TMZ and RA-1, either alone or in combination, in 35 mm dish plates for 24 h at 37°C in a humidified CO2 incubator. After incubation, cells were collected and suspended uniformly in 500 μl of 1× PBS. A mixture of 80 μl of cell suspension and 120 μl of 1% low-melting point agarose was spread evenly on a glass slide coated with 1% normal agarose. Cell lysis was carried out overnight at 4°C in a freshly prepared lysis buffer (100 mM EDTA, 2.5 M NaCl, 10 mM Tris base, 200 mM NaOH, 1% SDS, and 1% Triton X-100, pH 10). After incubation, the slides were gently immersed in 1× Tris Buffer (89 mM Tris base, 89 mM Borate, and 2 mM EDTA, pH 8.3) for 1 h. Subsequently, electrophoresis was carried out at 30 V for 30 min in pre-chilled TBE. Post-electrophoresis, the slides were immersed in ddH2O twice and once in 70% ethanol for 10 min, followed by desiccation at 37°C. Finally, the slides were stained with propidium iodide (10 μg/ml).
Similarly, in AAG (human alkyl adenine DNA glycosylase)-mediated neutral electrophoresis, the protocol previously outlined by Nguyen et al. (22) was followed. After cell lysis, the cells were treated with TMZ (100 μM, except for the control sample) at 37°C for 6 h. This was followed by an enzymatic reaction with 10 U of hAAU in 1× NEB ThermoPol reaction buffer (Supplementary Table S2) at 37°C for 1 h. Subsequently, RA-1 (5 μM) was added to the combination sample, which was incubated for 2 h at 37°C. The slides were then washed in 1× PBS, and the subsequent steps were similar to those mentioned in neutral electrophoresis. Finally, images were captured using a Leica TCS SP8 LAS X super-resolution confocal microscope with a 60× objective, and data were analyzed for the tail moment using ImageJ with the open-comet plugin (23).
Immunofluorescence staining
For immunofluorescence, cells were seeded onto coverslips and treated with RA-1, TMZ, or both for 24 h. Cells were fixed with 4% paraformaldehyde (PFA) in PBS for 20 min, permeabilized with 0.5% Triton X-100 in PBS for 15 min, washed twice with PBS, and blocked with 5% BSA (bovine serum albumin) for 1 h at 37°C. Cells were then incubated overnight at 4°C with anti-γ H2AX (Ser139) Rabbit mAb (1:1000), washed thrice with PBS, and incubated with anti-Rabbit IgG Fab2 Alexa Fluor 594 (1:1000) at 37°C for 1 h. After PBS washing, nuclei were counterstained with Hoechst (16.2 mM) for 15 min and washed again. Coverslips were mounted on glass slides using the mounting solution. A similar protocol was used for phospho-ATM (Ser1981) immunostaining. Finally, images were captured using a Leica TCS SP8 LAS X super-resolution confocal microscope with a 60× objective and quantified for phosphorylated ATM foci using ImageJ software.
Cell cycle analysis
Cells were seeded in 6-well plates, then incubated with RA-1, TMZ, or both, along with the positive control Doxorubicin (1 μM) for 24 h. After incubation, cells were carefully collected, fixed drop-wise using 70% ethanol, and kept at –20°C overnight. Cells were washed twice using PBS and incubated with RNAase A (0.1 mg/ml) for 2 h in a dark room. After incubation, cells were stained with propidium iodide (10 μg/ml) in a dark room for 30 min at room temperature. Finally, the cells were analyzed with a BD LSR-Fortressa flow cytometer.
Apoptosis analysis using FITC Annexin V
Cells were initially plated in 6-well plates and, following a 24-h incubation period, subjected to treatment with the specified doses of RA-1, TMZ, or a combination. And incubated overnight in a CO2 incubator at 37°C. Cells were collected using a minimal concentration of trypsin, subjected to two washes, and resuspended in cold PBS. Subsequently, the cells were suspended in 100 μl of 1× annexin binding buffer, to which 3 μl of FITC-conjugated annexin V was added (Supplementary Table S2), and left to incubate in a dark room for 25 min. After the incubation, cells were resuspended in 1× Annexin Binding Buffer (total volume of 500 μl), stained with Propidium iodide (1 μg/ml), and incubated again for 5 min before being analyzed in a BD LSR-Fortressa flow cytometer.
Statistical analyses
All experiments were performed in duplicate or triplicate, and the data underwent statistical analysis through one-way ANOVA, followed by Tukey's test for multiple group comparisons, using GraphPad Prism 9.2.0. The criteria for statistical significance were (ns) not significant, P ≤ 0.033 (*), P ≤ 0.002 (**) and P ≤ 0.001 (***).
Results
Temozolomide induces the accumulation of DNA abasic sites in both MMR-proficient and deficient cancer cells
To investigate the underlying mechanism for the ineffectiveness of the alkylating agent TMZ in cancer cells, we used both MMR-deficient and proficient cancer cells, as MMR proteins can modulate the TMZ response. Thus, for the MMR-deficient, previously characterized human colorectal cancer cells HCT116 (MLH1 deficient), HCT15 (MSH6 deficient) (13,24), whereas for MMR-proficient, we used colorectal adenocarcinoma cancer cells HT29 (MLH1WT, MSH6WT) and cervical adenocarcinoma HeLa (MLH1WT, MSH6WT) cells (Figure 1A) along with isogenic MMR-deficient HT29 (MLH1 Knockdown) cells (Figure 1B). Thereby, the dose-response curve of TMZ demonstrated that both types of cells showed higher IC50 values upon TMZ treatment, but the MMR-deficient cells HCT116, HCT15 and HT29MLH1(KD) had higher IC50 values compared to MMR-proficient cells (HeLa and HT29MLH1(WT)) (Figure 1C,D). This is correlated with the cytotoxicity effect of the O6-MeG adduct, indicating a divergent TMZ response based on the MMR status of cells (13). Moreover, for a comprehensive understanding of TMZ efficacy, we check for the long-term survival of cells after TMZ (0–800 μM) treatment. It was observed that MMR-proficient cell lines (HeLa and HT29MLH1(WT)) were found to be more sensitive to TMZ compared to MMR-deficient cells (HCT116, HCT15 and HT29MLH1(KD)) at lower concentrations.
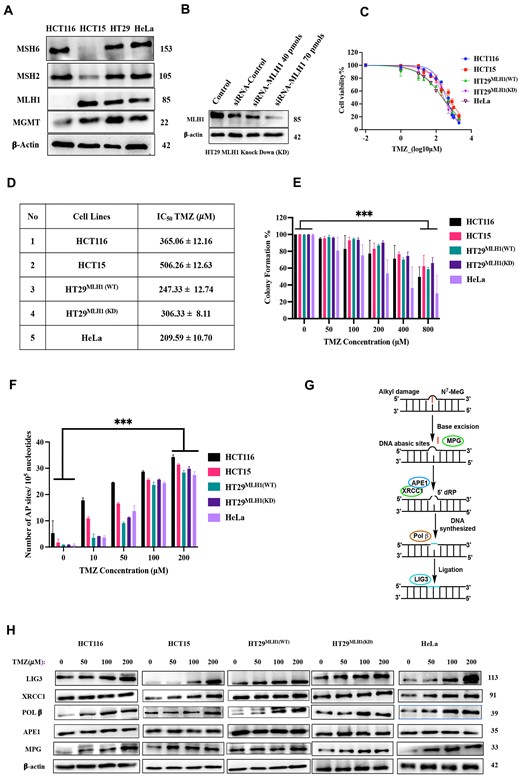
TMZ induces the accumulation of DNA abasic sites in both MMR-proficient and deficient cancer cells. (A) Cell lysates from HCT116, HCT15, HT29 and HeLa cells were analyzed by Western blot using antibodies specific to Mismatch Repair (MMR) pathway proteins. (B) HT-29 (MLH1-proficient) cells were transfected with varying concentrations of siRNA targeting MLH1 for 72 h to generate knockdown MMR-deficient isogenic cell lines, which were then analyzed by Western blot using specific antibodies for MLH1 and β-tubulin. (C) Dose-response curves for cell survival after treatment with TMZ were generated for both MMR-proficient and deficient cancer cells at the 24-hour time point. These curves, derived from MTT data, were fitted using nonlinear regression analysis (log inhibitor vs. normalized response), and the IC50 values were determined by GraphPad Prism. (D) The table summarizes the IC50 values for both MMR-proficient and deficient cancer cells. Mean ± SD represented triplicate biologically independent values. (E) Colony Formation (CF) after treatment with an increasing concentration of TMZ (0–800 μM) for 10 days in both MMR-proficient and deficient cancer cells; colonies were quantified using ImageJ. (F) Estimation of the number of AP sites after TMZ (0–200 μM) treatment at 24 h in both MMR-proficient and deficient cancer cells using the standard curve generated from the AP site quantification kit (Supplementary Figure S1F). (G) Proposed model for the repair of TMZ-induced N7-MeG and N3 -MeA DNA adducts by accumulating DNA abasic sites via the short-patch BER pathway. (H) Western blot analysis of TMZ (0–200 μM) treatment for 24 h in HCT116, HCT15, HT29MLH1(WT), HT29MLH1(KD), and HeLa using antibodies specific to BER pathway proteins. (E) and (F) were statistically analyzed by one-way ANOVA, followed by Tukey's for the multiple group comparison, using GraphPad Prism 9.2.0. The criteria for the statistical significance followed as (ns) ‘not significant’, P ≤ 0.033 (*), P ≤ 0.002 (**) and P ≤ 0.001 (***).
To investigate the role of BER pathways in TMZ treatment, we have quantified DNA abasic site (AP) numbers upon TMZ exposure. Since TMZ treatment creates 80–85% of the DNA adduct as the N7-MeG and N3-MeA adducts, which were depurinated to form DNA abasic sites, for this experiment, we used a colorimetric AP site assay kit that utilized an aldehyde reactive probe that reacted more specifically to the open ring form of an AP site. The results demonstrated that, with an increasing concentration of TMZ, the numbers of AP sites were also elevated in both MMR-proficient and deficient cancer cells (Figure 1F, Supplementary Figure S1F). This suggests that BER may be involved in the repair of TMZ-induced DNA adducts, leading to the formation of AP sites.
Furthermore, we sought to characterize the effects of TMZ in both MMR-proficient and deficient cancer cells by assessing the expression of proteins involved in the BER pathway. Interestingly, the results have shown that the expression of proteins such as Ligase 3 (LIG 3), Pol β and MPG (Methyl Purine Glycosylase) has significantly increased with the increasing concentration of TMZ. In contrast, the expression of APE1 and XRCC1 remained relatively unchanged (Figure 1H, Supplementary Figure S1A–E). Such inferences are presumably due to the short-patch BER pathway's involvement in repairing N7-MeG and N3-MeA DNA adducts (25). Briefly, at first, MPG is responsible for excising the lesion, resulting in the formation of AP sites. Further, the AP sites are processed by APE1 endonucleases, giving rise to 3′-OH and 5′-deoxyribose-5-phosphate (5′-dRP) termini. Subsequently, 5′dRp termini are processed by the lyase activity of Pol β, and it also incorporates the correct bases on the DNA strand and finally completes the repair process by the DNA ligase enzyme (LIG 3) by sealing the phosphate backbone (Figure 1G). Thus, the DNA abasic sites become a favourable target for enhancing the response to TMZ in both MMR-proficient and deficient cancer cells.
Structure-based rational design of quinoxaline small molecules to bind and cleave DNA abasic sites
Design and synthesis
Our previous study demonstrated the significance of the DNA intercalator nitro-quinoxaline [RA-6 (1d)] derivative and its relevance to targeting DNA abasic sites through the GSH-mediated in-situ formed amine component (1e) (12). We embarked on optimizing the design and synthesis of a series of amino-quinoxaline derivatives, denoted as RA-1 to RA-6 (Figure 2A). These molecules were tailored to be potent and effectively better at cleaving DNA abasic sites. To gain insights into their efficacy in cleaving DNA abasic sites using our prior knowledge of hydrophobicity-induced DNA binding of nitro-quinoxaline compounds (26), we have synthesized an amino-quinoxaline derivative (RA-1) with a hydrophobic para-trifluoromethyl benzyl moiety. This choice allowed us to explore whether increasing hydrophobicity could enhance AP-DNA cleavage efficacy. To probe the impact of the primary amine on DNA abasic site cleavage, we designed the compound RA-2 by replacing the -NH2 group in RA-1 with -H at the C-6 position of the quinoxaline ring. The compound RA-3 involves the methylation of amines at the C-2 and C-3 positions of the quinoxaline ring and was specifically designed to explore its role in interaction with the abasic sites in DNA. Additionally, to understand the stereo-electronic impact on the hydrophobic -CF3 group, we have designed the compound RA-4 by changing the position of the –CF3 group from the para to the ortho position of the compound RA-1 (Figure 2A). To investigate the effects of hydrophobicity in the context of DNA abasic site cleavage, we designed RA-5. This compound replaced the more hydrophobic para-trifluoromethyl benzyl moiety in RA-1 with a less hydrophobic para-fluorobenzyl moiety by substituting the –CF3 group with a -F atom. Lastly, we synthesized RA-6, which featured a nitro group in place of the amino group (present in RA-1) at the C-6 position of the quinoxaline scaffold, offering an analogous nitro-quinoxaline derivative (Figure 2A).
![Rational design of quinoxaline small molecules for DNA abasic sites binding and cleavage. (A) Chemical structures of synthesized quinoxaline compounds RA-1 to RA-6. (B) Assessment of the abilities of representative compounds (RA-1 to RA-6) at 100 μM concentration to cleave DNA containing AP sites (22-AP, 250 nM). The reaction was kept at 37°C overnight. (C) Schematic representation of the Uracil Deglycosylase (UDG)-generated AP site cleavage assay by Ligands (D) Concentration-dependent cleavage of Cy5-tagged AP site DNA by RA-1 (E) Analysis of in-vitro prepared abasic plasmid pBR322 DNA cleavage activity by RA-1 using agarose gel electrophoresis. Lane 1: Apurinic (AP) pBR322 alone (1 μg); Lane 2 to Lane 10: AP-pBR322 (1 μg) incubated with RA-1 (0.1–500 μM), respectively; and lane 11: (1,2-dimethylethylenediamine) DMEDA 100 mM as a standard control. RA-1 mediated AP-DNA cleavage reactions were conducted in 10 mM sodium phosphate buffer (pH 7.0) with 5% (v/v) DMSO at 37°C for 20 min. (F) Principle of the real-time fluorometric assay 22FQ (F = Texas Red □ (NHS Ester), Q = BHQ (Black Hole Quencher□), U: Uracil, UDG: Uracil Deglycosylase enzyme Y: Abasic site 22FQ: Oligonucleotides 22 bp. (G) Fluorometric readout representation for the cleavage of 22FQ with ligands. Experimental conditions: 22FQ (0.5 μM), ligand (10 μM) in sodium phosphate buffer [10 mM sodium phosphate (pH 7.0), 10 mM NaCl, 1% DMSO, ddH2O]. excitation wavelength (λex) = 598 nm; emission wavelength (λem) = 617 nm; slit widths = 10 nm; PMT voltage = 700 V; response = 8 s; run duration = 90 min, with the ligand added at t = 0.](https://oup.silverchair-cdn.com/oup/backfile/Content_public/Journal/narcancer/6/3/10.1093_narcan_zcae034/1/m_zcae034fig2.jpeg?Expires=1748333611&Signature=ciGH88jf-x-lHm57~iYgb0wd8JqOhZkkjZwS~nfIdbVuUynh94skST4nZq5J9AnuLtBG-1Wp7sd1-gObxw~xVGdkyQdGmbrA6X43LvZ9b0OmjlVDQnwAx4lJ~7IZuobdow4dQsI1FCf81KlJ5K5gq6KWmcB65JCUTGCthLUh4kW23EMPlrqhVqoZQw8ZWXAfEXoqaQ8kB93FDFBXgJjLt~8rrpw8saJE4OGmoMvjLG4Dk7zHxykWlI7Uf-wfhv-mfbl25JVmwGYCI23JVkYrnWJextg1FraYcb1Rm6lYnnax4WCJp8tCp~QLTLoE7F~B4r7VkcxYmFlslwVqSXaprw__&Key-Pair-Id=APKAIE5G5CRDK6RD3PGA)
Rational design of quinoxaline small molecules for DNA abasic sites binding and cleavage. (A) Chemical structures of synthesized quinoxaline compounds RA-1 to RA-6. (B) Assessment of the abilities of representative compounds (RA-1 to RA-6) at 100 μM concentration to cleave DNA containing AP sites (22-AP, 250 nM). The reaction was kept at 37°C overnight. (C) Schematic representation of the Uracil Deglycosylase (UDG)-generated AP site cleavage assay by Ligands (D) Concentration-dependent cleavage of Cy5-tagged AP site DNA by RA-1 (E) Analysis of in-vitro prepared abasic plasmid pBR322 DNA cleavage activity by RA-1 using agarose gel electrophoresis. Lane 1: Apurinic (AP) pBR322 alone (1 μg); Lane 2 to Lane 10: AP-pBR322 (1 μg) incubated with RA-1 (0.1–500 μM), respectively; and lane 11: (1,2-dimethylethylenediamine) DMEDA 100 mM as a standard control. RA-1 mediated AP-DNA cleavage reactions were conducted in 10 mM sodium phosphate buffer (pH 7.0) with 5% (v/v) DMSO at 37°C for 20 min. (F) Principle of the real-time fluorometric assay 22FQ (F = Texas Red □ (NHS Ester), Q = BHQ (Black Hole Quencher□), U: Uracil, UDG: Uracil Deglycosylase enzyme Y: Abasic site 22FQ: Oligonucleotides 22 bp. (G) Fluorometric readout representation for the cleavage of 22FQ with ligands. Experimental conditions: 22FQ (0.5 μM), ligand (10 μM) in sodium phosphate buffer [10 mM sodium phosphate (pH 7.0), 10 mM NaCl, 1% DMSO, ddH2O]. excitation wavelength (λex) = 598 nm; emission wavelength (λem) = 617 nm; slit widths = 10 nm; PMT voltage = 700 V; response = 8 s; run duration = 90 min, with the ligand added at t = 0.
The synthesis of all our designed compounds (RA-1 to RA-6) was achieved using 2,3-dichloro-6-nitroquinoxaline or 2,3-dichloroquinoxaline as the starting material (Supporting Information Section 2). Subsequently, we evaluated these synthetic quinoxaline analogues to investigate their structural contributions to the mechanism of strand scission in AP-DNA.
Structure-activity relationships (SAR) of AP-DNA cleavage
The analogues were assayed with the capability to incise DNA AP sites using Cy5-tagged double-stranded DNA containing AP sites (22-AP). The AP sites were generated by removing the uracil base from (22-UC) using the UDG enzyme, followed by incubation with the ligands. Consequently, the potential ligand cleaved the AP-DNA backbone, leading to the formation of shorter Cy5-labeled strands. The subsequent analysis involved separating the cleaved and uncleaved strands on a denaturing urea polyacrylamide gel (Figure 2C). Among the compounds tested at a concentration of 100 μM, only RA-1, RA-4 and RA-5 exhibited β-elimination products, while no nick products were observed with RA-2, RA-3 and RA-6. Remarkably, the introduction of compound RA-1 led to the formation of an additional δ-elimination product (Figure 2B, Supplementary Figure S2B), indicating that RA-1 could catalyze both β as well as δ-elimination reactions (18).
The outcomes of our study reveal significant insights into the impact of structural variations on the cleavage of DNA abasic sites by quinoxaline (RA) compounds. Firstly, RA-2, lacking an amino group at the C-6 position of the quinoxaline ring, exhibited an inability to cleave DNA abasic sites. This observation underscores the crucial role of the primary amine at the C-6 position necessary for effective cleavage. Similarly, RA-3 demonstrated an inability to cleave DNA abasic sites, likely attributed to its inefficient binding to AP sites. In the previous investigation, it was established that amines located at C-2/C-3 serve as potential hydrogen bond donors (20). Therefore, the introduction of a methyl group at the C-2 and C-3 positions of RA-3 resulted in steric hindrance, impeding effective binding at the AP sites, especially at the nucleobase opposite to the AP sites, differing from the efficient binding pattern observed with RA-1 at AP sites as illustrated in (Supplementary Figure S5) (27). As a result, RA-3 was incapable of engaging in a nucleophilic reaction with the aldehydic form of AP sites. Furthermore, the inefficiency of DNA abasic site cleavage by compound RA-6 may be due to the presence of the nitro group in the C-6 position instead of the amino group in RA-1. Similarly, the concentration-dependent cleavage reaction by RA-1 on the AP site containing DNA showed β elimination product initiated at a low micromolar concentration (10 μM) (Figure 2D).
Concurrently, we pursued the hypothesis that the amine-containing quinoxaline derivative (RA-1) could cleave DNA at the AP site, resulting in the generation of DNA double-strand breaks. This was examined through agarose gel electrophoresis using AP plasmid pBR322, which harboured ∼3 apurinic sites per plasmid DNA (Supplementary Figure S2A) (19). Upon reaction with amino quinoxalines, RA-1 was observed to cleave abasic sites (Figure 2E), whereas RA-6 nitro-quinoxaline was unable to do so (Supplementary Figure S2C). The approximate count of 3 AP sites per plasmid DNA molecule probably resides in complementary strands, which resulted in the formation of a nick or single-strand break (SSB) denoted as Form-II, as well as a linear or double-strand break (DSB) indicated as Form-III upon cleavage by the RA-1 (Figure 2E, Supplementary Figure S2A and D). The hydrophobicity of the compound RA-1 having a para-trifluoromethyl benzyl moiety facilitates the π–π stacking interactions with the AP site containing DNA, which may lead to the DNA condensation at a higher compound concentration (400 μM) (Figure 2E, Supplementary Figure S5). Therefore, the results suggest that designing amine-based small quinoxaline molecules is a rational approach for targeting DNA abasic sites.
Under low pH conditions, the occurrence of additional DNA apurinic (AP) sites increased due to the accelerated depurination process (28). We performed experiments to comprehend the pH-dependency of DNA cleavage by RA-1 on supercoiled plasmid DNA pBR322 (Supplementary Figure S2F). Notably, Form II and Form III were both observed at pH 6.2, indicating double-strand breaks (Supplementary Figure S2E, F). This highlighted the pH-dependent cleavage activities of RA-1, where the enhanced electrophilicity of the carbonyl carbon at the abasic carbonyl group at optimal pH promotes nucleophilic attack by the amine functional group in compound RA-1.
We also explored the intrinsic AP-DNA cleavage activity of RA compounds, emphasizing the significance of the primary amine moiety in strand scission chemistry. To elucidate these relationships, we employed a real-time fluorimetric assay (5), tracking the nucleophilic-catalyzed cleavage of AP sites by RA compounds in 22-mer duplexes (22-FQ) labeled with Texas Red (TexRd) and Blackhole Quencher (BHQ). These duplexes featured native AP sites (Y) generated by UDG treatment (Figure 2F), and they were monitored by fluorescence increases resulting from the cleavage and de-hybridization of the quencher-bearing strand (Figure 2F) (5). In parallel, we conducted the same experiment on a non-cleavable THF analogue oligo (22-XQ) as a control substrate, measuring the extent of ligand-induced AP DNA cleavage by comparing fluorescence intensity in the presence and absence of the compound at 10 μM concentration (Figure 2G).
The results demonstrated that RA-1 exhibited approximately two-fold higher AP-DNA cleavage efficiency compared to other compounds (RA-4 and RA-5). This finding indicated that RA-1 possesses the capability to generate both β and δ-elimination products, resulting in higher fluorescence intensity upon cleavage (Figure 2F, G). Consistent with the previous results, the efficiency of AP-DNA cleavages follows RA-1> RA-4> RA-5, with no observable change in RA-2, RA-3 and RA-6 (Figure 2G). This was further supported by the absence of cleavage product formation in the THF analogue oligo (22-XQ) when treated with RA-1 (THF Q depicted in Figure 2G). Consequently, the data strongly suggest that among the tested small molecules, RA-1 emerges as the most effective for cleaving DNA abasic sites.
Cleavage of TMZ-induced AP sites by RA-1 through Schiff base formation
The alkylation of DNA bases weakens the N-glycosyl bonds, creating an unstable positive charge within the base ring. This positive charge is subsequently stabilized through electron resonance, leading to the cleavage of the N-glycosyl bond, resulting in the generation of DNA AP sites (Figure 3D, Supplementary Figure S6A) (29). Hence, to investigate whether RA-1 can cleave these AP sites induced by TMZ, we conducted agarose gel electrophoresis experiments, examining its interaction with native supercoiled pBR322 plasmid DNA. Preliminary findings (Supplementary Figure S3A) show increased Form II formation with higher TMZ concentrations, especially at 500 μM. However, when combined with a constant concentration of RA-1 or RA-6 (5 μM), we observed that only RA-1 can cleave the TMZ-induced DNA AP sites, resulting in single-strand breaks (SSBs), i.e. Form-II, and double-strand breaks (DSBs), i.e. Form-III (Figure 3A, B). This suggests that TMZ indeed generates AP sites in DNA, and subsequently, RA-1 augments the activity by cleaving the abasic sites under in vitro conditions at a very minimal concentration (5 μM) (Figure 3A, Supplementary Figure S3B) (30).
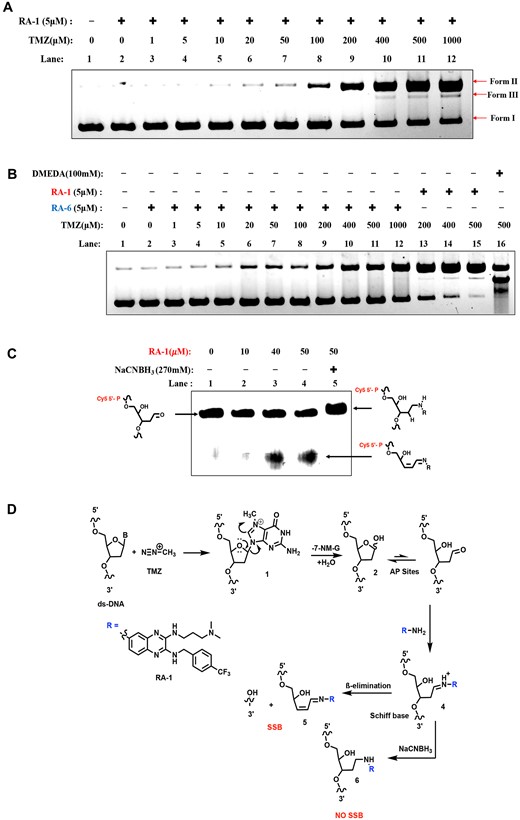
Cleavage of TMZ-induced AP sites by RA-1 via Schiff base formation. (A) Electrophoretic analysis of the cleavage of TMZ-induced AP sites by RA-1. Lane 1: native-pBR322 alone (0.5 μg); lane 2 to lane 12: mixtures of native-pBR322 (0.5 μg) and RA-1 (5 μM) with increasing concentrations of TMZ (0–1000 μM). All reactions were conducted in 10 mM sodium phosphate buffer (pH 7.0) with 5% (v/v) DMSO and incubated overnight at 37°C. (B) Electrophoretic analysis of cleavage of TMZ-induced AP sites by RA-6 or RA-1, lane 1: native-pBR322 alone (0.5 μg); lane 2 to lane 12: mixtures of native-pBR322 (0.5 μg) and RA-6 (5 μM) with increasing concentrations of TMZ (0–1000 μM). For comparison, lanes 13 to 15 were treated with RA-1 (5 μM), and lane 16 included DMEDA 100 mM as a standard control. All reactions were conducted in 10 mM sodium phosphate buffer (pH 7.0) with 5% (v/v) DMSO and incubated overnight at 37°C. (C) Urea PAGE analysis shows the sodium cyanoborohydride (NaCNBH3) trapping complex between RA-1 and Cy5-tagged AP-site DNA: no treatment (lane 1), treatment with 10, 40 and 50 μM RA-1 (lanes 2, 3 and 4), and 50 μM RA-1 with 270 mM NaCNBH3 (lane 5) incubated overnight at 37°C. (D) Plausible mechanism for the cleavage of TMZ-induced AP-DNA by RA-1.
Notably, only the amine-based quinoxaline RA-1 cleaves TMZ-generated AP sites, while the nitro-based RA-6 does not (Figure 3B). This is supported by 100 mM DMEDA, a control that also cleaves TMZ-induced AP sites (lane 16, Figure 3B), suggesting a synergistic effect when combining TMZ with RA-1.
To fully understand the cleavage mechanism of RA-1 with abasic sites, we hypothesized that the NH2 moiety present in RA-1 could act as a nucleophile that reacts with TMZ-induced AP sites via Schiff base chemistry, resulting in SSBs and DSBs (Figure 3D). To test this hypothesis, we performed a trapping reaction using the reducing agent sodium cyanoborohydride (NaCNBH3). The reaction was carried out with fluorophore Cy5-tagged dsDNA-containing AP sites (22-AP) with increasing concentrations of RA-1 and with reducing conditions of NaCNBH3. The result shows that increasing RA-1 concentration substantially increases the cleaved product (lanes 3 and 4) in comparison to the control (lane 1) (Figure 3C). The quick formation of SSB corresponds to the post-incision iminium base intermediate (Figure 3D). However, no cleaved product was observed under the reducing agent NaCNBH3 condition (lane 5), along with a decrease in band mobility (Figure 3C). This decrease in band mobility could be attributed to the formation of a reduced, trapped intermediate complex resulting from the reductive amination reaction between the amine and an aldehyde. (Figure 3D) (11). Thus, the results evidenced that the amine moiety of RA-1 reacts with the AP site aldehyde form via Schiff base (iminium-ion) formation, resulting in a β-elimination product generation, and it was reduced on trapping with NaCNBH3 complex (Figure 3D). Hence, the probable mechanism for the formation of β-elimination product on earlier results (Figure 2B, D and E) is also evidenced via the Schiff base formation causing SSBs and DSBs.
RA-1 shows specific binding affinity to AP-DNA
To elucidate the binding preference of RA-1 with the DNA AP site, we conducted a fluorescence-based spectroscopic assay to investigate its binding efficiency with calf-thymus DNA (ctDNA) and apurinic calf-thymus DNA (AP-ctDNA). Given that RA-1 is a fluorescent compound (Supplementary Figure S4A), we observed higher fluorescence quenching of RA-1 after adding AP site-containing DNA (AP-ctDNA) ∼46.19% compared to native ctDNA ∼31.21% (Figure 4A, Supplementary Figure S4B). The binding of RA-1 with AP-DNA was measured by fluorescence titration experiments, and the fluorescence titration curves were best fit to the one-site total binding equation (using GraphPad Prism), with the values summarized in (Figure 4B, C). The dissociation constant (Kd) value for AP-ctDNA (29.12 ± 0.72 μM bp) was much lower than for ctDNA (366.7 ± 3.25 μM bp), suggesting a higher affinity of RA-1 towards AP-ctDNA (Figure 4C).
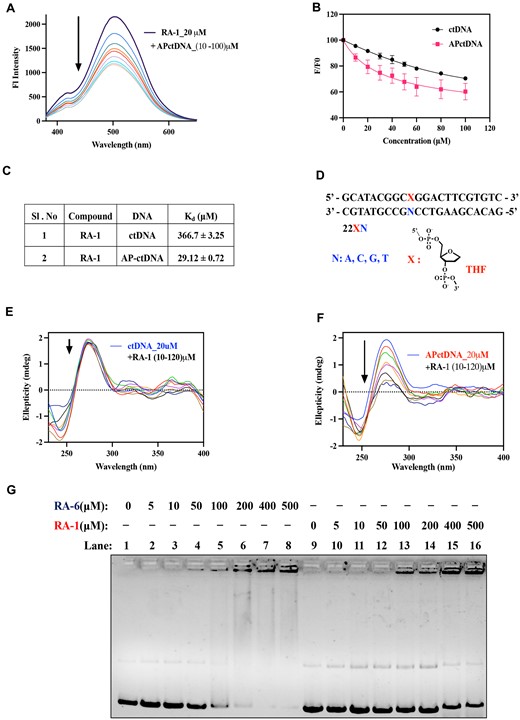
The specific binding affinity of RA-1 for AP-DNA. (A) Fluorescence emission spectra of RA-1 (20 μM) excited at 365 nm upon titration with AP-ctDNA (10–100 μM bp). (B) Fluorescence titration curves depicting the interaction of RA-1 with AP-ctDNA and ctDNA; where F and Fo represent the fluorescence intensity of RA-1 in the presence and absence of DNA, respectively, the resulting R-square value is 0.99. (C) The dissociation constant (Kd) for the complexation of RA-1 with AP-ctDNA or ctDNA was calculated using GraphPad Prism 9.2.0 (one-site total binding equation). (D) Schematic representation of the THF oligonucleotide 22XN with various nucleobases opposite to the AP site. (E, F) Circular dichroism spectra profile for the titration of ctDNA (20 μM bp) or AP-ctDNA (20 μM bp) with various concentrations of RA-1 (10–120 μM), respectively. (G) Agarose gel shift assay of native supercoiled pBR322 DNA with increasing concentrations of compounds RA-6 (lane 2 to lane 8) and RA-1 (lane 10 to lane 16).
Additionally, we have investigated the nucleobase specificity of the complementary base to the DNA abasic site. To decipher this, we employed an ITC, using AP sites containing the oligonucleotides 5′-GCATACGACXGGACTTCGTGTC-3′ together with 5′GACACGAAGTCCNGTCGTATGC-3′ (i.e. X: THF (tetrahydrofuran), an abasic analogue with opposite bases N: G, A, T and C) (Figure 4D). Thus, this assay allowed us to deduce the changes in thermodynamic parameters, including enthalpy change (ΔH) and entropy factor (TΔS).
Thereby gaining insights into the interaction between ligands and DNA-AP sites. Thus, the resulting plots correlating heat release per mole of RA-1 added versus the molar ratio of RA-1 to AP-DNA oligos are presented in (Supplementary Figure S4C-F). The calculated thermodynamic values for each base are listed in Table 1.
Thermodynamic parameters for the binding of RA-1 (30 μM) with an AP site containing DNA duplex 5′-GCATACGACXGGACTTCGTGTC-3′/ 3′-CGTATGCTGNCCTGAAGCACAG-5′ (i.e. X: THF, an abasic analogue with opposite target bases N: A, T, G and C, respectively, with concentration 200 μM at 25 ºC. # The values were determined by using ΔG = ΔH – TΔS)
| S. No. | Ligand | Target nucleobase | Kd (μM) | ΔH (kJ/mol) | TΔS (kJ/mol) | ΔG# (kJ/mol) |
|---|---|---|---|---|---|---|
| 1 | RA-1 | Adenine A | 27.86 ± 1.2 | 19.68 ± 2.03 | 45.59 | –25.91 |
| 2 | RA-1 | Cytosine C | 55.31 ± 0.9 | 38.97 ± 6.52 | 63.17 | –24.20 |
| 3 | RA-1 | Guanine G | 141.4 ± 6.1 | 14.40 ± 5.90 | 36.35 | –21.95 |
| 4 | RA-1 | Thymine T | 53.6 ± 0.9 | 29.56 ± 7.04 | 53.64 | –24.08 |
Notably, Kd values, indicative of the strength of interaction, varied based on the opposing nucleobase opposite to the AP site, with the most remarkable DNA binding affinity of RA-1 observed for the adenine residue (27.86 ± 1.2 μM) having the lowest Kd value, followed by the thymine as well as the cytosine residue (Table 1). The least binding affinity of RA-1 was observed in the case of guanine residue, 141.4 ± 6.1 μM. Thus, it can be concluded that RA-1 exhibited stronger binding affinity and selectivity towards the adenine residue (A) opposite to the AP site in a DNA duplex compared to the other nucleobases. The thermodynamic profiles demonstrated consistently negative free energy values (ΔG) for the AP DNA-RA1 interactions, reflecting favourable complex formations, with values of –25.91 kJ/mol for adenine and relatively lower values for other nucleobases (–24.20, –21.95 and –24.08 kJ/mol). Intriguingly, the ΔH and TΔS exhibited positive values (19.68 ± 2.03; 45.59 kJ/mol) for these DNA–molecule interactions (Table 1). This observation indicated that the binding mechanism of RA-1 was primarily driven by the entropy factor, suggesting favourable stacking or hydrophobic interactions at the AP sites (31). This notion was supported by the non-polarity nature of RA-1 having a hydrophobic para-trifluoromethyl benzyl segment, effectively infiltrating the hydrophobic pocket within the vicinity of AP sites, and substantially disrupting certain DNA hydration layers. Consequently, this disruption of the hydration shell in the close vicinity of the DNA-interacting site by the hydrophobic RA-1 molecule released free water molecules that contributed to the positive binding entropy (32). This perturbation of DNA’s hydration sphere accounted for the endothermic process, consequently decreasing the binding enthalpy. In associations where drug-induced disruption of the hydration environment resulted in an endothermic (+ΔH) scenario, simultaneously, the hydrophobic interactions led to the free water displacement to the surroundings (+TΔS), thereby accounting for both increased endothermic and entropic factors. Hence, the phenomenon of enthalpy-entropy compensation is observed in RA-1 binding to DNA AP sites (32).
Further, to gain insight into the binding mode and affinity of RA-1 to the AP-DNA, we conducted CD analysis of both native ctDNA and AP site-containing ctDNA (AP-ctDNA) with RA-1. The CD spectra of ctDNA at 20 μM bp exhibited B-DNA characteristic peaks, including a positive band around 277 nm associated with nucleobase stacking interaction and a negative band around 245 nm indicating DNA helicity (33). Upon titration with an increasing amount of RA-1 (10–120 μM) against ctDNA, there were no significant changes in the band intensity in both the B-DNA peaks (Figure 4E). However, the same titration experiment of AP-ctDNA with an increasing concentration of RA-1 (10–120 μM) resulted in a decrease in positive ellipticity at 277 nm, indicating the de-stacking of DNA nucleobases upon compound treatment (Figure 4F). This result suggests that the hydrophobicity of RA-1, which has a nonpolar trifluoromethyl benzyl moiety, assists the molecules in stacking on the AP hydrophobic pocket, resulting in the de-stacking of the nearby DNA bases with increasing concentration (Figure 4F).
Conceivably, we hypothesized that RA-1, a small molecule with an amino quinoxaline structure and a positively charged N, N-dimethyl aminopropyl tail, could interact with the DNA phosphate backbone via its cationic headgroup (dimethyl-amino) under physiological conditions. Since DNA maintains its structural integrity through H-bonding, hydrophobic, electrostatic, and π-π stacking interactions, the nucleobase opposite to the AP site provides targetable bases for ligand specificity (34). The instantaneous generation of a large hydrophobic pocket at the AP site possibly aids the hydrophobic ligand of RA-1 in easy entry, and the presence of hydrogen bond donors in C2/C3 likely helps in forming a hydrogen bond with the targeted nucleobase, especially adenine (Supplementary Figure S5) (35). Additionally, the presence of a para-trifluoromethyl benzyl moiety on RA-1 facilitates the π-π stacking interactions with the hydrophobic core of abasic site DNA and favours the entropically driven DNA interactions that cause DNA condensation at higher concentrations (Figure 2E, Supplementary Figure S5). In summary, the presence of a primary amine group (NH2) on the hydrophobic core of RA-1 reacts with the aldehyde moiety of the AP site, resulting in the production of DNA β, δ-eliminated products (Figure 2D, E).
To further understand the DNA-intercalation characteristics of RA-1 and RA-6, we performed an agarose gel shift assay using supercoiled native plasmid DNA pBR322 (0.5 μg in 20 μl buffer results in a concentration of 38.37 μM/bp). RA-6, being more hydrophobic than RA-1, induced significant structural alterations in the DNA. These alterations were accompanied by an upper shift of the DNA band, leading to pronounced condensation near the well, notably occurring at a minimal concentration of 100 μM (drug/DNA bp ratio ∼2.7) for RA-6 (as observed in lanes 5 to 8 in Figure 4G). In contrast, RA-1 showed only a partial shift of the DNA band (as shown in lanes 14 to 16 in Figure 4G) [drug/DNA bp ratio ∼10.42] (20,26). This observation suggests that hydrophobic interactions play a pivotal role in driving the DNA structural changes resulting from intercalation in the native plasmid pBR322. Additionally, it indicates that RA-1 can facilitate π–π stacking interactions with AP sites containing DNA, resulting in DNA condensation. Thus, RA-1 exhibits more specificity towards DNA AP sites compared to native DNA (Figures 2E and 4C).
TMZ and RA-1 combination is synergistic in both MMR-proficient and deficient cancer cells
In this study, the initial findings revealed that the survival of cells, both those proficient and deficient in MMR, at higher concentrations of TMZ was accompanied by the accumulation of DNA abasic sites, which were subsequently repaired through the BER pathway (Figure 1F-H). To explore the possibility of enhancing cytotoxicity by inducing strand cleavages at the TMZ-induced DNA abasic sites (Figure 3A), we investigated the combination of TMZ with RA-1 (TMZ-RA1) in cancer cell lines. The evaluation of RA-1′s cell viability in both MMR-proficient and deficient cancer cells indicated lower IC50 values when compared to TMZ (Figure 5A, B). Additionally, higher IC50 values were observed in transformed but non-cancerous cells (HS5 and HEK293). Similarly, the effectiveness of two non-cleavable abasic site small molecules, namely RA-2 and RA-3 (Figure 2B), does not exhibit significant cytotoxicity in HCT116 and HT29 cell lines, as evidenced by higher IC50 values (Supplementary Figure S7A, B).
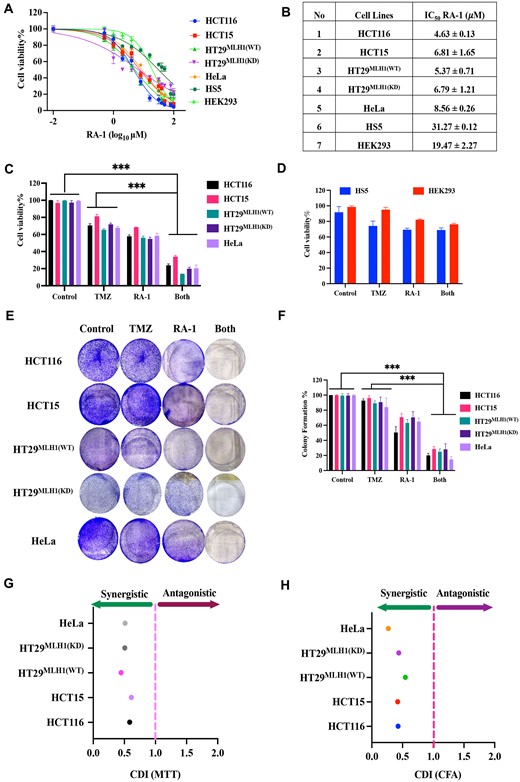
Synergistic effects of the TMZ-RA1 combination on cell viability and colony formation. (A) Dose-response curves for cell survival following RA-1 treatment in HCT116, HCT15, HT29MLH1(WT), HT29MLH1(KD), HeLa, HS5 and HEK239 cells at 24 h were generated using MTT data and nonlinear regression analysis (log inhibitor vs. normalized response), with IC50 values determined by GraphPad Prism. (B) The table summarized IC50 values for representative cell lines, and mean ± SD represented triplicate biologically independent values. (C) Cell viability was assessed following treatment with TMZ (100 μM) and RA-1 (5 μM) individually or in combination (TMZ-RA1) in both MMR-proficient and deficient cancer cells at 48 h using the MTT assay. (D) Cell viability was assessed following treatment with TMZ (100 μM) and RA-1 (5 μM) individually or in combination (TMZ-RA1) in both HS5 and HEK293 at 48 h using the MTT assay (E) and (F) Colony Formation (CF) after treatment with TMZ (100 μM) and RA-1 (5 μM) independently or in combination with TMZ-RA1 for 10 days in both MMR-proficient and deficient cancer cells, and colonies were quantified using ImageJ. (G, H) Mean percentage of cell survival (MTT) and colony formation (colony formation area, CFA) data from a representative experiment were used to calculate the coefficient of drug interaction (CDI). CDI values below 1 indicate synergism; CDI values below 0.7 imply significant synergism; and values above 1 suggest antagonism in the combination treatment. Statistical analysis of the data was conducted using a one-way ANOVA followed by Tukey's test for multiple group comparisons, utilizing GraphPad Prism 9.2.0. The criteria for statistical significance were determined as follows: (ns) for ‘not significant’, (*) for P ≤ 0.033, (**) for P ≤ 0.002 and (***) for P ≤ 0.001.
We proceeded to evaluate whether RA-1 could enhance the response to TMZ by taking into account the concentration observed in the initial experiments, which led to a significant accumulation of AP sites at TMZ (100 μM) (Figure 1F) and the formation of DSBs when combined with RA-1 (5 μM) (Figure 3A). Remarkably, when treated with a constant concentration of 100 μM TMZ followed by 5 μM of RA-1, the combination of TMZ-RA1 (Both) led to a substantial decrease in cell survival in both MMR-proficient and deficient cancer cells (Figure 5C). Notably, the (coefficient of drug interaction) CDI for the two drugs if CDI < 0.7 represents a significant synergism (15). Thereby, the CDI values further demonstrated strong synergistic effects for TMZ-RA1 (HCT116: 0.58; HCT15: 0.61; HT29MLH1(WT): 0.44; HT29MLH1(KD): 0.51, HeLa: 0.51) on both MMR-proficient and deficient cell lines (Figure 5G). In contrast, no significant cytotoxicity and DNA damage were observed in HS5 and HEK293 cells when treated with the TMZ-RA1 combination (Figure 5D, Supplementary Figure S7G). This observation suggests that cancer cells might exhibit greater vulnerability to the treatment, potentially owing to a higher count of abasic sites caused by reactive oxygen species (ROS) (Supplementary Figure S7E-F). This also corresponds with previous findings showing increased levels of 8-oxoG in renal carcinoma compared to their corresponding normal tissues (1,36). Additionally, the combined use of RA-2 or RA-3 with TMZ did not result in significant cytotoxicity, suggesting that RA-2 and RA-3 were unable to cleave TMZ-induced abasic sites, leading to no observable cytotoxic effects in these cell lines (Supplementary Figure S7C-D).
Moreover, these findings were independently confirmed by long-term cell survival assays (colony formation assay), where the combination TMZ-RA1 synergistically reduced colony formation (CDI < 0.5) in both MMR-proficient and deficient cancer cells (Figure 5E, F and H). Summarily, the combination of TMZ-RA-1 exhibited potent synergistic effects in decreasing cell survival and colony formation in both MMR-proficient and deficient cells.
In addition, to specifically isolate the effects of the O6-MeG, we utilized the methylating agent MMS (methyl methane sulfonate) instead of TMZ. MMS induced a lower percentage of O6-MeG adducts (0.3%) compared to TMZ, with a higher proportion of N7-MeG (87%) and N3-MeA (11%) (37). Similar to TMZ, MMS, as an alkylating agent, has the potential to generate DNA abasic sites by destabilizing N-glycosidic bonds (Supplementary Figure S6A). Consequently, we explored the combination of RA-1 with MMS on MMR-proficient and deficient cancer cells. MMS showed an IC50 of 232.14 ± 2.1 μM in HCT116 and 170.8 ± 1.3 μM in HT29. With 100 μM MMS and varying RA-1 (0–32 μM) for 24 h, the IC50 was 1.45 ± 0.83 μM in HCT116 and 1.35 ± 1.07 μM in HT29 (Supplementary Figure S6B-C). This finding supports the notion that N7-MeG and N3-MeA are major cytotoxic lesions in both MMR-proficient and deficient cancers, leading to the accumulation of abasic sites during repair through the BER pathway (6).
Similarly, we explored the impact of oxidative stress beyond TMZ by using H2O2 as an oxidative agent. H2O2 is known to induce 8-oxoG DNA adducts, which are repaired by the BER pathway, ultimately leading to the formation of DNA abasic sites as intermediates (38). Our findings show that the IC50 of H2O2 alone is 149 ± 1.7 μM in HCT116 and 99 ± 2.1 μM in HT29. With 70 μM H2O2 and varying RA-1 (0–32 μM) for 24 h, the IC50 was 0.88 ± 1.02 μM in HCT116 and 1.44 ± 0.79 μM in HT29 (Supplementary Figure S6D-E). Hence, from these data, we infer that RA-1 possesses an equal ability to augment cytotoxicity by cleaving DNA abasic sites in these cell lines.
RA-1′s impairment of the BER pathway leads to DNA DSBs in the TMZ-RA1 combination
Given the observation that RA-1 can cleave DNA abasic sites, we have explored its effect on the BER pathway. We conducted an in-vitro reconstitution of the entire BER cycle using Cyanine-5 fluorophore-tagged AP-DNA (22-AP), along with Taq DNA Polymerase (lacking 3′→5′ exonuclease activity akin to Pol β (39)), dNTPs, APE1, and the T-4 DNA Ligase enzyme, following a previously established protocol (21).
In Figure 6A, lane 1 depicts a band [(a) 22-UC] representing undamaged DNA without abasic sites (untreated with UDG), while lane 2 illustrates abasic DNA (UDG-treated, (b) 22-AP). The repair efficiency of the abasic site cleavage by RA-1 and APE-1 was observed by the restoration of an undamaged DNA 22-mer oligonucleotide [(a)22-UC] (Supplementary Figure S9A). RA-1 (50 μM) cleaved the AP-DNA duplex, resulting in bands for both 22-AP (b) and β-elimination product (d) (lane 3, Figure 6A). Adding dNTPs and Taq Pol with RA-1 generated a prominent β-elimination product [(d), lane 4, Figure 6A]. Subsequently, adding T4 DNA ligase resulted in the formation of β-elimination products (d) and a 22-AP (b) band (lane 5, Figure 6A), indicating incomplete repair, as it failed to restore the fully ligated repair band (k). The partial appearance of the 22-AP (b) band in lane 5 but not in lane 4 suggests that T4 DNA ligase may inhibit complete cleavage by RA-1 at this concentration (40). However, higher RA-1 concentrations cause complete cleavage (Supplementary Figure S9C).
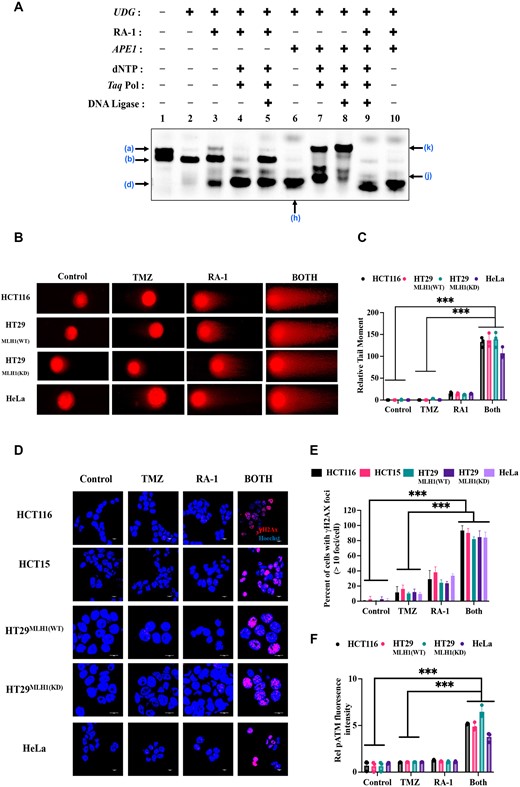
RA-1 impairs the BER pathway, leading to DNA double-strand breaks in the TMZ-RA1 combination. (A) In vitro reconstitution of the BER pathway utilized 22-UC AP-DNA oligonucleotide with Taq DNA Polymerase (0.2 U/μl), dNTP (200 μM), APE1 (0.2 U/μl), and Ligase (0.25 U/μl), along with RA-1 (50 μM). Lane designations are lane 1: 22UC with intact Uracil, lane 2: AP-DNA (22AP) oligonucleotide, lane 3: RA-1 cleavage of AP-DNA, lane 4: AP-DNA cleavage mediated by RA-1 with Taq DNA Pol, dNTPs, and with combination T4 DNA ligase (in lane 5), lane 6: APE1-mediated cleavage of 22-AP, lane 7: APE1-mediated cleavage with Taq DNA Pol, dNTPs, and with combination T4 DNA ligase (in lane 8), lane 9: AP-DNA cleavage with RA-1 and all enzymes, lane 10: AP-DNA cleavage with RA-1 and APE1. (The a–k band is depicted according to shown in Supplementary Figure S9A). (B) Neutral comet assays were conducted to detect DNA DSBs following treatment with TMZ (100 μM) and RA-1 (5 μM) either independently or in combination (TMZ-RA1) in both MMR-proficient and deficient cancer cells. Representative images of comets are shown (scale bar = 10 μM). (C) The relative tail moment of DNA after treatment is presented for both MMR-proficient and deficient cancer cells. (D) Representative image of γH2AX foci (red) in both MMR-proficient and deficient cancer cells after treatment with TMZ (100 μM) and RA-1 (5 μM) independently or in combination (TMZ-RA1). Hoechst staining (blue) was used to label the cell nucleus (scale bar = 10 μM). (E) The percentage of cells with γH2AX foci (>10 foci per cell) in both MMR-proficient and MMR-deficient cancer cells. (F) The phosphorylated ATM relative fluorescence intensity per nucleus was quantified using ImageJ software in both MMR-proficient and MMR-deficient cancer cells (Supplementary Figure S8C). For (C), (E) and (F), the data was statistically analyzed by one-way ANOVA followed by Tukey's for the multiple group comparison using GraphPad Prism 9.2.0. The criteria for the statistical significance followed as (ns) ‘not significant’, P ≤ 0.033 (*), P ≤ 0.002(**) and P ≤ 0.001 (***).
APE-1 alone efficiently cleaved the AP sites ((h) lane 6, Figure 6A). Adding Taq Pol caused a partial upward shift, presumably by adding one or multiple nucleotides to the incised DNA (j) (lane 7, Figure 6A). The partial appearance of the upper band (k) in lane 7 indicates the addition of nucleotides to the dsDNA with an OH group generated by APE1 cleavage. This finding aligns with prior research (41) suggesting APE1 cleavage, generating 5′-dRP and 3′-OH ends that serve as substrates for the polymerase enzymes to add nucleotides (j) (Supplementary Figure S8D-S9A). Finally, the addition of DNA ligase produced a slower migrating band (k), which appeared at approximately the same level as the undamaged DNA (a) (lane 8, Figure 6A), indicating successful repair. Although Taq DNA polymerase lacks the 5′-dRP lyase activity found in Pol β, previous research suggests that some spontaneous 5′-dRP hydrolysis can occur during the incubation of Taq polymerase with the substrate (42). This potentially allows ligase enzymes to seal the ends, resulting in the formation of a prominently repaired ligated band (k) (lane 8). However, Taq polymerase is not as efficient as Pol β, leading to the appearance of additional faint bands alongside the prominently repaired ligated band (k) (lane 8, Figure 6A). This finding suggests that APE1 cleavage products served as substrates for repair by polymerase and ligase enzymes, resembling the common cellular BER pathway process (Supplementary Figure S8D-S9A) (5,43).
Furthermore, we also examined RA-1′s cleavage efficiency with APE1, both alone and with polymerase and ligase (lanes 9, 10, Figure 6A). RA-1 still predominantly produced cleavage products (d) (lane 9), suggesting that β elimination after AP cleavage by RA-1 is predominant and is irreparable by the enzymes (Supplementary Figure S8D-S9A). The β, δ-elimination (3′-phosphate) is often termed "dirty ends’, and previous studies have indicated that these ends are not viable substrates for DNA polymerase and, thus, remain unrepaired by the BER pathway (5,44). This observation is further supported by a similar experiment using 100 mM DMEDA, a known control that cleaves AP sites (Supplementary Figure S9B). Like RA-1, DMEDA treatment generates β-elimination products that are unusable substrates for repair by the polymerase enzymes and therefore remain unrepaired. (Supplementary Figure S8D and S9A–C).
We next assessed the DNA damage induced by TMZ (100 μM) or RA-1 (5 μM), alone and combined, in both MMR-proficient and deficient cancer cells by employing a neutral comet assay. The results revealed that the combination of TMZ-RA1 led to an increase in the extent of the relative tail length in both MMR-proficient and deficient cancer cells (Figure 6B, C). These findings suggest the induction of DNA DSBs upon combination treatment of TMZ-RA1.
To further comprehend the synergistic interactions between TMZ and RA-1 in inducing DNA DSBs, we conducted a modified AAG-mediated neutral comet assay in HT29MLH1(WT) and HT29MLH1(KD) cells (Supplementary Figure S8A, B). AAG, or N-methylpurine–DNA glycosylase (MPG), is responsible for removing DNA adducts such as N7-MeG, N3-MeA and N3-MeG (38). Similar to the neutral comet assay, the observed increase in comet tail length in combination provides further evidence that TMZ-RA1 can induce DNA DSBs (Supplementary Figure S8A, B).
Additionally, we employed an immunofluorescent staining assay to examine DSBs by quantifying the number of positive foci formed for γH2AX in response to TMZ (100 μM), RA-1 (5 μM), alone or in combination TMZ-RA1. Consistent with the previous observations, the percentage of cells that have elevated γH2AX foci significantly increased in cells treated with the combination of TMZ-RA1 compared to TMZ alone (Figure 6D, E).
Collectively, these findings unveil a synergistic mechanism whereby TMZ enhances the accumulation of DNA abasic sites while RA-1 concurrently cleaves these sites, resulting in the generation of β and β, δ-elimination products that are plausibly inadequately repaired by the BER pathway enzymes (Figures 6A, 2D, Supplementary Figures S8D–S9A). Consequently, this process leads to the creation of DNA single-stranded breaks (SSBs), which are then converted to double-strand breaks during DNA replication (45). The neutral comet assay detected this DNA damage as the ‘comet’ tail shape and migration, representing the extent of the DNA damage (Figure 6B, C) (22). Elevated levels of γH2AX expression indicated the occurrence of double-strand breaks in cells (Figure 6D, E). Thus, the combination of TMZ and RA1 enhances DNA damage and promotes cytotoxicity in cancer cells.
Effects of the TMZ-RA1 combination on cell cycle distribution and apoptosis
The combination of TMZ and RA1 leads to the induction of DNA DSBs, which can activate the DNA damage response (DDR) in cells. The DDR signal transduction pathway encompasses sensors, transducers, and effectors, ultimately culminating in cell cycle arrest and apoptosis (46). Thus, in response to DNA DSBs, the primary activation occurs through the ATM-Chk2 kinase pathway, resulting in G1 cell cycle arrest, while the ATR-Chk1 pathway orchestrates S and G2 phase arrest (1). However, when DNA DSBs emerge from the subsequent collapse of replication forks, this activates both the ATR-Chk1 and ATM-Chk2 pathways, ultimately causing S-phase cell cycle arrest (47,48).
Hence, we put forth the hypothesis that the persistent accumulation of DNA DSBs due to TMZ-RA1 might intensify the engagement of ATM-Chk2 and ATR-Chk1 pathways within cells. To investigate this, we executed a western blot (and immunofluorescence assay for pATM) analysis to detect the phosphorylated forms of ATM-Chk2 and ATR-Chk1 pathways upon treatment with TMZ (100 μM) and RA-1 (5 μM), either independently or in combination. The outcomes illustrated a significant elevation in the expression of phosphorylated pATR, pATM, pCHK2 and pCHK1 in cells treated with the TMZ-RA1 combination, surpassing the effect of TMZ alone, across both MMR-proficient and deficient cancer cell types (Figure 7A, 6F Supplementary Figure S8C).
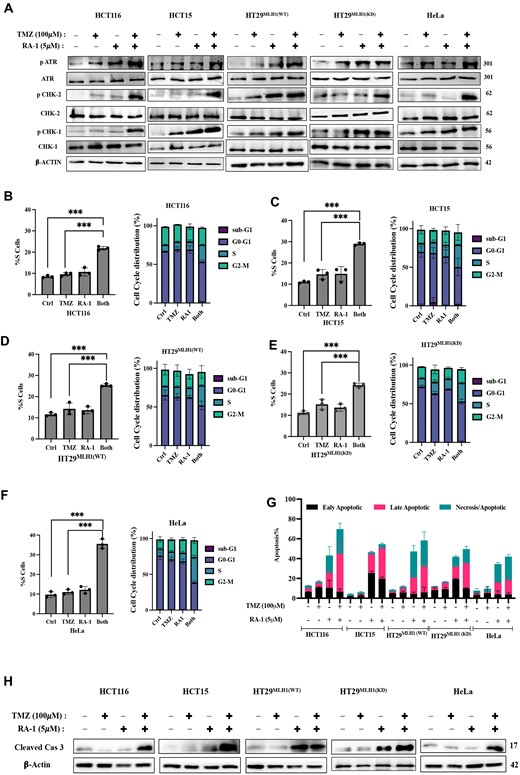
Effects of TMZ-RA1 combination treatment on cell cycle and apoptosis. (A) Western blot analysis of the phosphorylated and total proteins of ATR, ChK1, and ChK2 signalling pathway proteins antibodies after the treatment with TMZ (100 μM) and RA-1 (5 μM) independently or in combination (TMZ-RA1) in both MMR-proficient and deficient cancer cells (HCT116, HCT15, HT29MLH1(WT), HT29MLH1(KD), and HeLa) for 24 h. (B–F) Cell cycle analysis using flow cytometry after the treatment with TMZ (100 μM) and RA-1 (5 μM) independently or in combination (TMZ-RA1) (Supplementary Figure S10A), The left panel displays the percentage change in the S-phase, while the right panel depicts the distribution of cell cycle phases at 24 h for the respective cell lines. (G) The percentage of apoptosis and necrosis for representative treatment of both MMR-proficient and deficient cancer cells using flow cytometry (Supplementary Figure S10B). (H) Immunoblot analysis of cleaved caspase 3 in cells treated as represented for both MMR-proficient and deficient cancer cells. For (B), (C), (D), (E) and (F), the data were statistically analyzed by one-way ANOVA, followed by Tukey's for the multiple group comparison, using GraphPad Prism 9.2.0. The criteria for the statistical significance followed as (ns) ‘not significant’, P ≤ 0.033 (*), P ≤ 0.002 (**) and P ≤ 0.001 (***).
To gain insights into the impact of the TMZ-RA1 combination on cell cycles, particularly given its activation of both phosphorylated ATM-Chk2 and ATR-Chk1 pathways as shown in immunoblotting analyses, we examined the effects on cell cycle profiles. We used flow cytometry to assess the cell cycle response to TMZ, RA-1 alone, or their combination (Figure 7B-F, Supplementary Figure S10A). Consistent with previous findings, there was a significant increase in the accumulation of cells in the S-phase in both MMR-proficient and deficient cancer cells (Figure 7B-F). This substantiates that the TMZ-RA1 combination halts cell cycles in the S-phase due to impaired DNA replication resulting from the formation of double-strand breaks (Figures 6B–F, 7A–F) (46,48).
Subsequently, we assessed cell apoptosis resulting from the cell cycle arrest and the accrual of DSBs triggered by TMZ-RA1. Flow cytometry was used to evaluate apoptosis via the FITC Annexin V assay. The results revealed that TMZ (100 μM) alone could not induce apoptosis in both MMR-proficient and deficient cancer cells. However, in combination, TMZ-RA1 exhibited substantial levels of apoptosis and necrosis across both MMR-proficient and deficient cancer cells (Figure 7G, Supplementary Figure S10B). These findings were congruent with western blot analysis, which displayed a noticeable increase in cleaved caspase-3 in cells exposed to the TMZ-RA1 combination compared to cells treated solely with TMZ (Figure 7H).
Consequently, these results indicate that RA-1's cleavage of TMZ-induced AP sites yields toxic intermediates (β, δ-elimination product). These intermediates impede repair through the BER pathway, which leads to the formation of DSBs. Simultaneously, this mechanism enhances the activation of both ATM-Chk2 and ATR-Chk1 pathways, leading to S-phase arrest and ultimately culminating in apoptosis and necrosis in both MMR-proficient and deficient cancer cells.
Discussion
Alkylating agents find widespread application in the treatment of brain tumors, ovarian cancer, and malignant melanomas. However, the emergence of resistance poses significant obstacles to successful treatment outcomes. Also, 50% of GBM (glioblastoma) patients subjected to TMZ therapy exhibit unresponsive results (49). The cytotoxic response of the O6-MeG DNA adduct induced by TMZ is dependent upon the MMR pathway status of the cancer cells, notably fostering chemoresistance in MMR-deficient cancer. Since TMZ accumulates higher levels of N7-MeG and N3-MeA DNA adducts, we conducted an investigation into their repair through the BER pathway in both MMR-deficient and MMR-proficient cancer cells (Figure 1A, B). Our study highlights that TMZ enhances the accumulation of DNA abasic sites in cancer cells via the BER pathway in both types of cancer cells (Figure 1F). This acquisition is accompanied by the overexpression of short-patch BER proteins, particularly MPG, Pol β, and LIG3 enzymes, which are involved in the repair of TMZ-induced N7-MeG and N3-MeA DNA adducts, ultimately promoting cell survival (Figure 1G, H) (25). This observation is consistent with a prior study (50), where the expression levels of MPG and MGMT were found to be elevated in the TMZ-resistant glioma cell line (T98G) compared to TMZ-sensitive glioma cells (A-172). Additionally, it has been established that MPG influences the potentiation of TMZ under BER inhibition in a Pol β-dependent manner (51). Moreover, combined inhibition of LIG3 (inhibitor L189) with TMZ demonstrated enhanced TMZ activity in HeLa cells (52). Thus, overexpression of MPG, Pol β and LIG3, along with the heightened accumulation of abasic sites in both MMR-proficient and deficient cancer cells, suggests that N7-MeG and N3-MeA are the primary adducts of TMZ that induce abasic sites in cancer cells. These findings emphasize the significance of DNA abasic sites as a rational target for enhancing TMZ responses in both MMR-proficient and deficient cancers.
In this context, we have developed and systematically explored quinoxaline-based small molecules (RA-1 to RA-6) designed to cleave DNA abasic sites under physiological conditions (Figure 2A). Based on the SAR studies, RA-1 represents an optimized version capable of generating both β and β, δ-elimination products upon cleaving both DNA-AP sites and TMZ-induced AP sites at lower concentrations via Schiff base formation (Figures 2 and 3). The 3′ ends generated from both β and β, δ-elimination products are unlikely to be repaired by the BER pathway, thereby enhancing the impact of TMZ (Figures 5C, E, F, 6A) (44). Although the 3′-phosphate generated from the β,δ-elimination product by RA-1 can be repaired by polynucleotide kinase phosphatase (PNKP), recent research in this aspect on mitoxantrone cleaving DNA abasic sites via β, δ-elimination, revealed no significant difference in sensitivity to mitoxantrone-induced cytotoxicity between PNKP-proficient and PNKP-deficient HCT116 cells (53). Nonetheless, the impact of RA-1 on PNKP-mediated repair requires further extensive investigation.
Typically, each cell can generate approximately 10,000 abasic sites in a given day, and it is devoid of Waston–Crick bases, resulting in the formation of a large hydrophobic pocket (34,54). Similarly, in cancer cells, the high fold of 8-oxoG adducts from ROS compared to normal cells simultaneously elevates the number of abasic sites (1), and these abasic lesions are chemically unstable, forming an electrophilic carbonyl group (54). The bases opposite the AP sites serve as target nucleobases for hydrophobic ligands (34). Thus, the data of the fluorescence quenching analysis demonstrated a distinct preference of RA-1 for AP-ctDNA over ctDNA (Figure 4A–C), along with a selective affinity for adenine nucleobases opposite to the AP site binds via base stacking, and it is an entropically favourable process. (Table 1, Supplementary Figure S5) (35).
Collectively, it has been established that the O6-MeG adduct induced by TMZ undergoes direct repair through the action of MGMT. However, when the O6-MeG adduct remains unrepaired, it leads to the formation of O6-MeG: T mispairs. In MMR-proficient cancer, MMR proteins recognize O6-MeG: T mispairs, initiating a futile cycle of DNA resection and processing. This, in turn, results in the collapse of the DNA replication fork and the generation of DSBs. If the DSBs are not repaired through the homologous or non-homologous end-joining pathway, it triggers programmed cell death through apoptosis (3) (left panel in Figure 8). However, MMR-deficient cells harbouring mutations in MMR pathway proteins fail to recognize or repair erroneous O6-MeG: Thymine mispairs, leading to persistent DNA replication via translesion DNA synthesis (TLS), causing resistance to TMZ (right panel in Figure 8) (55). Similarly, TMZ-predominated DNA adducts such as N7-MeG and N3-MeA are excised by the MPG enzyme, resulting in the formation of AP sites. This initiates a series of events involving the sequential incision of the 5′ DNA backbone by the APE1 enzyme, resulting in the creation of SSBs characterized by a 3′-OH and a 5′-dRP. Following this, Pol β removes the 5′-dRP moiety using its lyase activity and proceeds to fill the resulting gap. Ultimately, the DNA Ligase (LIG3) enzymes seal the nicks, culminating in cell survival through the completion of the BER pathway (56) (Figures 8 and 1G–H).
![Proposed model for the synergistic enhancement of TMZ response with RA-1 via BER pathway-mediated cleavage of abasic sites. TMZ-induced dominant N7MeG adduct repair by the BER pathway resulted in elevated accumulation of abasic sites in both the MMR-proficient [left panel (red dot box)] and deficient [right panel (blue dot box)] cancer cells. Subsequently, RA-1 cleaves these DNA abasic sites via β and β, δ-elimination mechanisms, impairing the BER pathway and leading to the generation of DNA DSBs, which promote apoptosis. This impairment results in synergistic responses to TMZ in both cancer cell types.](https://oup.silverchair-cdn.com/oup/backfile/Content_public/Journal/narcancer/6/3/10.1093_narcan_zcae034/1/m_zcae034fig8.jpeg?Expires=1748333612&Signature=JD1oGSSNnS~67sJLT7wwT1kniqiLhp0grBdaKcMecXa5vL1K2RoXzsgEKVwM9SJtMndCIC4Ce6U8TEti9CdRlCKxKLcF3CtOPh6r3dzAeU3fdAHD3mGJkEIPmD~YNdDyMf7yca88U4IJS5KrW~FO5k2MKqOffLJjrIPPTwopZ7kolz~Bj2igprAs01BMNNsd~3VEruqff6UM6FR~jkxk2O55fyHYTZsQXE6nPLUZyHth3FDo2DTn4dNG5oqJA5IQt1oIVDEhgsCeeLlNy4XSP3WpmlrdXDIaS~HL9vbQKWS6q9enpwVC-RrmACX3dTm8n47nnr6i7f1xPcwtFgi9gw__&Key-Pair-Id=APKAIE5G5CRDK6RD3PGA)
Proposed model for the synergistic enhancement of TMZ response with RA-1 via BER pathway-mediated cleavage of abasic sites. TMZ-induced dominant N7MeG adduct repair by the BER pathway resulted in elevated accumulation of abasic sites in both the MMR-proficient [left panel (red dot box)] and deficient [right panel (blue dot box)] cancer cells. Subsequently, RA-1 cleaves these DNA abasic sites via β and β, δ-elimination mechanisms, impairing the BER pathway and leading to the generation of DNA DSBs, which promote apoptosis. This impairment results in synergistic responses to TMZ in both cancer cell types.
Given these insights, we propose a model (Figure 8) wherein the targeting of DNA abasic sites using the amino-quinoxaline small molecule RA-1, which in conjunction with TMZ (TMZ-RA1) synergistically enhances the response to TMZ in both MMR-proficient and deficient cancers, as evidenced by reductions in cell viability and colony formation (Figure 5). The molecular mechanism of synergism is evidenced through the RA-1 generating β and β, δ-elimination products from AP site cleavage, and these products are unusable substrates for Pol β that plausibly resulted in impairment of the BER pathway (Figure 6A, 2D Supplementary Figures S8D–S9A) (5,44). Consequently, the persistence of such SSBs due to an unrepaired BER pathway resulted in the accumulation of DNA DSBs during DNA replication. This process generates DNA DSBs, which can be visualized by the extent of the comet tail in a neutral comet assay (Figure 6B–C). Concurrently, there is a significant rise in the percentage of cells that have elevated γH2AX foci in response to DNA DSBs accumulation (Figure 6D, E). Moreover, this synergistic effect triggers a cascade of signalling pathways, including activation of pATM-Chk2 and pATR-Chk1 pathways, in response to DSBs, leading to S-phase arrest (Figures 6F and 7A–F) (57). Ultimately, these events promote apoptosis (Figure 7G, H) and synergize TMZ responses in both MMR-proficient and deficient cancer cells (Figure 8).
In summary, our findings underscore the significant potential of utilizing DNA abasic sites to improve the efficacy of TMZ treatment in both MMR-proficient and deficient cancers. We present compelling data that can guide the development of potent and selective small molecules targeting DNA abasic sites. Our results suggest that combining an alkylating agent with amino-quinoxaline small molecules capable of abasic site cleavage holds great promise as a therapeutic approach for cancer treatment. Thus, our research emphasizes the potential for investigating vulnerabilities within DNA damage pathways to improve the sensitivity of cancer cells to therapeutic agents.
Data availability
The data underlying this article are available in the article and its online Supplementary material.
Supplementary data
Supplementary Data are available at NAR Cancer Online.
Acknowledgements
A.B., R.P. and C.S.M. acknowledge CSIR for the Research Fellowship. We are thankful to Sounak Bhattacharya for his assistance with confocal microscopy, Jishu Mandal for CD experiments, Mr. Tapas Chowdhury for iBright imaging system settings, and Dr Abhi Das for supporting ITC data analysis. Thankful for the assistance of Mayank Gardia in crafting illustration images.
Funding
Council for Scientific and Industrial Research (CSIR), India through the Grant [MLP-139].
Conflict of interest statement. None declared.

Comments