


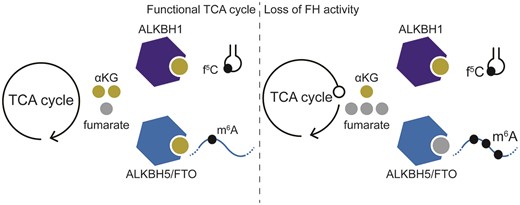
Abstract
Metabolic reprogramming is a hallmark of cancer that facilitates changes in many adaptive biological processes. Mutations in the tricarboxylic acid cycle enzyme fumarate hydratase (FH) lead to fumarate accumulation and cause hereditary leiomyomatosis and renal cell cancer (HLRCC). HLRCC is a rare, inherited disease characterized by the development of non-cancerous smooth muscle tumors of the uterus and skin, and an increased risk of an aggressive form of kidney cancer. Fumarate has been shown to inhibit 2-oxoglutarate-dependent dioxygenases (2OGDDs) involved in the hydroxylation of HIF1α, as well as in DNA and histone demethylation. However, the link between fumarate accumulation and changes in RNA post-transcriptional modifications has not been defined. Here, we determine the consequences of fumarate accumulation on the activity of different members of the 2OGDD family targeting RNA modifications. By evaluating multiple RNA modifications in patient-derived HLRCC cell lines, we show that mutation of FH selectively affects the levels of N6-methyladenosine (m6A), while the levels of 5-formylcytosine (f5C) in mitochondrial tRNA are unaffected. This supports the hypothesis of a differential impact of fumarate accumulation on distinct RNA demethylases. The observation that metabolites modulate specific subsets of RNA-modifying enzymes offers new insights into the intersection between metabolism and the epitranscriptome.
Introduction
Cellular plasticity and identity depend upon metabolic and environmental cues, and metabolic rewiring is essential for commitment to specific cellular lineages during all stages of development (1). The tricarboxylic acid (TCA) cycle is a central metabolic pathway used by organisms to generate energy, in the form of ATP, as well as building blocks for protein, nucleic acid and fatty acid synthesis (2). Cellular metabolic reprogramming is an important mechanism by which cells rewire their metabolism to promote proliferation. This process is frequently observed in tumors, and is considered a hallmark of cancer (3,4). Aerobic glycolysis, commonly referred to as the Warburg effect, is characterized by decreased ATP synthesis and increased aerobic metabolism of glucose to lactate. Mutations in TCA cycle enzymes that disrupt oxidative phosphorylation are a known driver of metabolic rewiring and have been linked to specific cancer subtypes, such as gliomas, acute myeloid leukemia, gastrointestinal stromal tumors, and paragangliomas (5–10). To date, mutations associated with oncogenesis have been described for four TCA enzymes: isocitrate dehydrogenase 1 and 2 (IDH1 and IDH2) (11–13), succinate dehydrogenase (SDH) and fumarate hydratase (FH). Gain-of-function mutations in IDH1 and IDH2 lead to the de novo production of 2-hydroxyglutarate (2HG) (5,6). Conversely, loss of SDH or FH activity results in the accumulation of succinate and fumarate, respectively (7,8,14–16). Critically, aberrant accumulation of these metabolites can disrupt the activity of cellular enzymes, leading to changes in gene expression and signaling, thereby promoting tumorigenesis. Loss of function mutations in FH have been identified in individuals with the familial cancer syndrome hereditary leiomyomatosis and renal cell carcinoma (HLRCC) (15–17). These patients are at risk for the development of cutaneous and uterine leiomyomas as well as kidney tumors. These renal tumors readily metastasize, leading to a highly aggressive form of renal cell carcinoma (18).
One group of enzymes that is sensitive to changes in TCA cycle metabolites, including fumarate accumulation, is the 2-oxoglutarate-dependent dioxygenase (2OGDD; also known as alpha-ketoglutarate (αKG)-dependent dioxygenases) family (11,12). Enzymes in this family catalyze hydroxylation reactions on lipids, proteins, and nucleic acids (19). Critically, the activity of these enzymes is dependent upon the availability of iron, oxygen, and the ratio of αKG to related TCA cycle metabolites such as succinate and fumarate (20,21). Aberrant accumulation of 2HG, succinate, or fumarate can disrupt the activity of 2OGDDs, leading to changes in gene expression programs and promoting tumorigenesis. Previous work has demonstrated that high levels of fumarate can upregulate the transcription factor Hypoxia Inducible Factor (HIF) by inhibiting HIF prolyl hydroxylase activity (22). Additionally, accumulation of fumarate has been shown to promote hypermethylation of DNA and histones (23,24) and drive an epithelial-to-mesenchymal (EMT) phenotypic switch in HLRCC (25).
While previous studies have focused on the effect of metabolic changes on DNA and chromatin demethylation, less is known about the impact of fumarate accumulation on 2OGDDs that act on RNA substrates. The AlkB proteins are a highly conserved family of 2OGDDs with nine human homologs (ALKBH1-8 and FTO). Five of these members have been demonstrated to act on RNA (ALKBH1, ALKBH3, ALKBH5, ALKBH7 and FTO) (reviewed in (26,27)). These enzymes catalyze the removal of RNA modifications and can act on a diverse set of modified nucleobases and types of RNA including messenger RNA (mRNA), transfer RNA (tRNA) and ribosomal RNA (rRNA). Recent studies have revealed roles for several ALKBH family members in cancer, where they can function either as oncogenes or tumor suppressors in a cell-type specific fashion (28–30). Considering the potential for ALKBH enzymes to serve as a link between metabolism and gene expression, we set out to define the consequences of fumarate accumulation in HLRCC on the levels of RNA modifications that are substrates of 2OGDD enzymes. Here we report that mutation of FH selectively affects the levels of N6-methyladenosine (m6A), while the levels of 5-formylcytosine (f5C) in mitochondrial tRNA are unaffected. This supports the hypothesis of a differential impact of fumarate accumulation on distinct RNA demethylases. The observation that certain 2OGDD enzymes are more sensitive than others to fumarate accumulation offers new insights into the intersection of metabolism and gene regulation.
Materials and methods
General cell culture
The parental UOK262 (UOK262-PAR) (15) and HK2 (ATCC CRL-2190) cells were grown in heat-inactivated Dulbecco's modification of Eagle's medium (DMEM; Gibco 10313021) supplemented with 10% heat-inactivated fetal bovine serum (FBS; Sigma Aldrich #F4135), 2% glutamax (ThermoFisher #35050061), and 1% penicillin–streptomycin (PenStrep; ThermoFisher #15140122). HEK-293T cells (ATCC CRL-11268) were grown in DMEM supplemented with 10% fetal bovine serum, 1% glutamax and 1% PenStrep. Cells were grown at 37ºC in 5% carbon dioxide and were split every 2–3 days at approximately 80% confluency. All cell lines were routinely tested for mycoplasma contamination by the MycoAlert Mycoplasma Detection Kit (Lonza #LT07-318).
Generation of isogenic UOK cell lines
The stable UOK262 isogenic cell lines were generated by lentivirus. Briefly, the FH gene was cloned into the pLEX_305 lentiviral backbone where we swapped the puromycin resistance for geneticin resistance. The pLEX_305 vector was a gift from David Root (Addgene plasmid #41390). Viral particles were generated using 2nd generation lentiviral system plasmids (31). Briefly, 4.5 μg of Δ8.9 plasmid, 1.5 μg of vsv-g plasmid (gifts from Howard Chang), 6 μg of pLEX_305 vector plasmid, 600 μl of Opti-MEM (ThermoFisher #31985062) and 36 μl of Fugene (Promega #E2691) were mixed and incubated at room temperature for 15 min before being added to a 10-cm plate containing 5 million HEK-293T cells. The following day, the media was changed on the 10-cm plate. After 2 days, media was removed and viral particles concentrated using lenti-X concentrator solution (Takara Bio #631232). Concentrated viral particles were distributed into single-use aliquots and stored at −80ºC until use. Viral aliquots were titrated using the Lenti-X™ qRT-PCR Titration Kit (Clontech #631235). For cell line transduction of the UOK cells, a range of viral dilutions was added to the cells. The following day, media was changed, and cells were selected with geneticin (G418; ThermoFisher #10131035) for 4–5 days. A mock viral-treated plate containing UOK262 cells was used as a control for G418 selection. Introduction of FH-FLAG was confirmed by qPCR and Western Blot, and WT and MUT cell lines were paired based on FH expression. Plasmids pLEX_305_FH_G418 and pLEX_305_FHmut_G418 have been deposited with Addgene.
Generation of knockout cell lines
An RNP complex consisting of 4 μg of sgRNA (IDT), 6 μg of Cas9 enzyme (IDT), and 1 μg of linear donor template (5′-loxP-EF-1α promotor-TurboGFP-Puromycin Cassette-SV40-loxP-3′) was electroporated into 1 million UOK262-WT cells using a Lonza 4D Nucleofector (Lonza Biosciences) with program DS-137 and nucleofection solution SG. The pMAX-GFP plasmid was used as a nucleofection control. Following 48 h recovery, cells were selected with puromycin for 48–72 h. Single-cell clones were selected by limiting dilution onto a feeder layer of mouse embryonic fibroblasts (Millipore Sigma #PMEF-N) and 40% pre-conditioned UOK262 media. Following dilution, cells were expanded over 4–6 weeks. Knockout of the desired enzymes was validated by Western Blot and PCR. Primers used for sgRNA design and sanger sequencing can be found in Supplementary Table S1.
Quantitative real-time PCR
Total RNA was collected from 1–2 million UOK262 cells using Trizol reagent (ThermoFisher #15596026) according to the manufacturer's protocol. Following separation of the aqueous and organic phases, the aqueous phase was removed and purified with a Qiagen RNeasy Mini kit (#74004) according to the manufacturer's protocol. RNA was eluted in 100 μl of nuclease-free water and RNA concentration and purity were determined by nano-volume spectrophotometric analysis (DeNovix). Reverse Transcription (RT) was performed with 0.5–1.0 μg of total RNA input material in 20 μl of total volume using SuperScript IV Vilo reverse transcriptase (ThermoFisher #11754050) and following the manufacturer's protocol for thermal cycling: 25ºC for 10 min; 50ºC for 10 min; 85ºC for 5 min; 4ºC hold. A control reaction containing the no reverse-transcriptase solution was also prepared. Upon completion of the reaction, cDNA was diluted to a final volume of 100 μl in nuclease-free water. In some experiments, the reverse-transcribed cDNA was stored overnight at 4°C. The RT reaction was primed with random nucleotide hexamers present in the Vilo master mix.
Quantitative real-time polymerase chain reaction (qPCR) reactions were set up manually in 96-well plates using either Sybr Green chemistry (25 μl reactions using Applied Biosystems Power SYBR green PCR mix #4367659) or hydrolysis probe chemistry (20 μl reactions Taqman probes, ThermoFisher) following the manufacturers’ protocols. Sybr Green chemistry reactions: 12.5 μl 2× Sybr Green Master Mix, 3 μl of cDNA, 2 μl of 10 µM primer mix, 7.5 μl nuclease-free water. Primers for the Sybr Green qPCR reactions (Supplementary Table S1) were ordered from IDT with no modifications and standard desalting. Hydrolysis probe chemistry reactions: 1 μl 20X Taqman gene expression probe; 10 μl 2× Taqman Gene Expression Fast Advanced Master Mix (ThermoFisher #4444557), 4 μl cDNA template, 5 μl Nuclease-free water.
Amplification was measured on a QuantStudio3 RT-qPCR thermal cycler using the recommended parameters for each chemistry. Sybr Green reactions were performed in standard run mode with the following parameters: 95ºC for 10 min, 40 cycles of 95ºC for 15 s, 60ºC for 60 s. Melting curves were measured from 65ºC to 95ºC in steps of 0.5ºC. Hydrolysis probe reactions were performed in fast run mode with the following parameters: 50ºC for 2 min, 95ºC for 20 sec, 40 cycles of 95ºC for 1 s, 60ºC for 20 s. Hydrolysis probes (Supplementary Table S1) were ordered from ThermoFisher Scientific. To test for contamination of the RNA, we performed control reactions to omit the SuperScript IV. To test for contamination of the PCR reagents, we performed ‘no-template controls’ (NTC). mRNA values were normalized relative to reference genes GAPDH, Actin, or PP1A. The standard comparative cycle threshold method was used for quantification. All reverse transcription reactions (biological replicates) and qPCR reactions (technical replicates) were performed at least three times. Data are plotted as mean ± s.d. in either GraphPad Prism (v 9.0) or R-studio (v 3.6.3).
Western Blot
Cell pellets from 100 000–300 000 UOK262 cells were lysed in RIPA buffer (50 mM Tris, pH 7.4, 150 mM NaCl, 1% NP-40, 0.1% SDS, 0.5% sodium deoxycholate), supplemented with a protease inhibitor cocktail tablet (Millipore Sigma # 11697498001). Lysates were harvested by centrifugation at 21 000 × g for 30 min at 4ºC. Protein was quantified by bicinchoninic acid (BCA) assay (ThermoFisher #23227). Protein (between 10 and 20 µg) was resolved by sodium dodecyl sulfate–polyacrylamide gel electrophoresis (SDS-PAGE; ThermoFisher #NP0335) in 1× MOPS buffer (40 mM 3-(N-morpholino) propanesulfonic acid (MOPS), 10 mM sodium acetate, 1 mM EDTA), transferred to nitrocellulose membranes (Li-COR #926–31092), and membranes were blocked in Intercept (TBS) Blocking Buffer (LI-COR #927-60001). Membranes were incubated overnight with primary antibodies at 4ºC with gentle rocking. The following morning, membranes were rinsed 3× with phosphate buffered saline supplemented with Tween-20 (PBS-T; 1.37 M NaCl, 27 mM KCl, 100 mM Na2HPO4, 18 mM KH2PO4, 0.5% Tween-20) and incubated with fluorophore-conjugated species-specific secondary antibodies (LI-COR) for 1 h at 20ºC with gentle rocking. Fluorescence was detected on a LI-COR Odyssey instrument and analyzed using the LI-COR ImageStudio software. A list of all primary and secondary antibodies as well as the dilution factors used is provided in Supplementary Table S2.
Subcellular fractionation
For subcellular fractionation, the procedure was adapted from previously described protocols (32). Briefly, 1.5 million trypsinized cells were washed 2× with 5 ml of PBS and re-suspended thoroughly in 600 μl HEPES–sucrose–Ficoll–digitonin solution (HSFD, 20 mM HEPES–KOH, 6.25% Ficoll, 0.27 M sucrose, 3 mM CaCl2, 2 mM MgCl2. pH 7.4) with freshly added digitonin and proteinase inhibitors and lysed on ice for 10 min. Following lysis, cells were centrifuged at 1000 × g for 3 min and the supernatant was removed and centrifuged again at 15 000 × g for 10 min to generate the cytosol fraction. The pellet of nuclei was washed with HSFD buffer while the supernatant was collected as the washed fraction. The pellet was lysed by sonication in 100 μl of RIPA buffer. Following sonication, fraction was incubated on ice for 30 min, and then centrifuged to 15 000 × g for 10 min. After centrifugation, the supernatant was collected as the nuclear extract fraction. The concentration of protein from each fraction was quantified by BCA Assay (ThermoFisher #23227). Protein (between 10 and 20 μg) was resolved by SDS-PAGE and proteins of interest were detected as above described.
FH and MDH native In-gel activity assay
Cells collected from 1 T75 flask (approx. 1–2 million) were pelleted and frozen until use. Frozen cell pellets were lysed by sonication on ice in 200 μl pre-chilled Lysis Buffer (10 mM Tris, pH 8.0, 0.1% Triton X-100, 3 mM KCl, 3 mM MgCl2, 3 mM sodium citrate) supplemented with an EDTA-free protease inhibitor tablet (SigmaAldrich #04693116001). Lysates were clarified by centrifugation at 4ºC for 30 min at 21 000 × g. Supernatant was removed and protein concentration was quantified by BCA assay (ThermoFisher #23227) according to the manufacturer's protocol. 20 μg of protein sample was loaded onto 7% Tris-Acetate gels (ThermoFisher #EA03552) with ice-cold 1X Tris-glycine buffer and run at 125V and 4ºC for approximately 1 h. Upon completion, gels were washed gently with deionized water for 5 min at 20ºC with gentle rocking. After 5 min, 10 ml of fumarate assay buffer (0.1 M Tris, pH 7.4, 1 mg/ml 3-(4,5-dimethylthiazol-2-yl)-2,5-diphenyltetrazolium bromide (MTT; Sigma Aldrich #M2128), 1 mM NAD+, 20 μl malic dehydrogenase (SigmaAldrich #M2634), 0.182 mg/ml phenazine methosulfate (PMS; Sigma Aldrich #P9625) and 5 mM sodium fumarate (SigmaAldrich #F1506)) or malic dehydrogenase assay buffer (0.1M Tris, pH 7.4, 1 mg/mL MTT, 0.182 mg/ml PMS, 5 mM l-malate (Sigma Aldrich #112577) were added to the tray containing the gels. Gels were incubated for 5–15 min in a heated rocker oven at 37ºC until colorimetric bands appeared in the native gel. Gels were destained in ddH2O for 5–15 min and scanned on an Epson Perfection V700 Scanner in transmitted color mode.
Immunohistochemistry
Five-micron thick formalin-fixed paraffin-embedded sections were cut from UOK262 tumor xenografts and a human renal cortex specimen. Immunohistochemistry staining was performed by VitroVivo Biotech (Rockville, MD) using standardized methodologies, using either anti-ALKBH5 (1:250) or anti-FTO (1:800) antibodies. Images were captured using an AxioScan.Z1 Slide Scanner (Zeiss, Oberkochen, DE). A list of antibodies is provided in Supplementary Table S2.
Immunofluorescence
Adherent cells were grown on ethanol-sterilized glass coverslips previously coated with poly-d-lysine solution (ThermoFisher #A3890401). Cells were fixed with 4% paraformaldehyde (PFA; ThermoFisher #28908) for 10 min and then permeabilized with 0.3% Triton X-100 for 5 min. Blocking was carried out for 1 h with PBS containing 5% FBS. Primary antibodies were incubated overnight at 4°C in blocking solution. Coverslips were washed gently for 15 min with PBS and then incubated for 1 h at 20ºC with secondary antibodies. Coverslips were gently washed 3× with PBS. After washing, DNA was counterstained with DAPI (ThermoFisher #62248) and coverslips were mounted with ProLong™ Glass Antifade Mountant (ThermoFisher #P36980). Images were acquired using a Nikon SoRa spinning disk microscope equipped with Photometrics BSI sCMOS camera and 60× apochromat TIRF (N.A. 1.49) oil immersion lens and images were analyzed using FIJI (33). A list of antibodies is provided in Supplementary Table S2.
RNA sequencing
Total RNA was extracted from cells using Trizol Reagent (ThermoFisher #15596018) according to the manufacturer's protocol. Following phase separation, the aqueous phase was applied to a RNeasy Mini Kit column (Qiagen #74106) and RNA was purified according to kit instructions. RNA-seq libraries were prepared using Illumina TruSeq Stranded Total RNA Library Prep Kit v2 (Illumina #RS-122-2001 and #RS-122-2002) and sequenced on NextSeq 500 using paired-end sequencing (2 × 75). Read quality was checked with FastQC (v 0.11.9). Reads were trimmed for adapters using cutadapt (v2.5) (34) and aligned against a custom genome of repetitive sequences before alignment with the hg38 reference genome(gencode v35) using Spliced Transcripts Alignment to a Reference (STAR v2.7.6a (35,36)). PCR duplicates were marked and removed with Picard's MarkDuplicates (v 2.25.0). Sample counts were obtained with htseq-count (v 0.9.1) (37) and differential gene expression was analyzed with DESeq2 package (38) in R (v 3.6.3).
Analysis of previously published HLRCC RNA-seq data
HLRCC patient RNA-seq data generated by a previous study (39) was used to examine changes in gene expression between metastatic and primary tumor sites. Paired fastq data was downloaded from SRA (GSE157256) using sratoolkit and verified based on md5 hash. Adapters were trimmed from the fastq files using cutadapt (v2.5) (34) before alignment with the hg38 reference genome (gencode v35) using STAR (v2.7.6a) (35,36). Duplicates were marked and removed with Picard's MarkDuplicates (v2.25.0). Sample counts were extracted using htseq-count function (v 0.9.1) (37) and differential gene expression was performed with the DESeq2 package (38) in R (v 3.6.3).
m6A-immunoprecipitation
Total RNA was collected from 1-2 million UOK262 cells using Trizol reagent (ThermoFisher #15596026) according to the manufacturer's protocol. Following separation of the aqueous and organic phases, the aqueous phase was removed and purified with a Qiagen RNA Mini kit (#74004) according to the manufacturer's protocol. RNA was eluted in 100 μl of nuclease-free water and RNA concentration and purity were determined by nano-volume spectrophotometric analysis (DeNovix). mRNA was polyA selected through two rounds of selection with oligo d(T)25 magnetic beads (NEB #S1419S). Following polyA selection, 5 μg of mRNA was fragmented using ZnCl2 fragmentation reagent (Life Technologies #AM8740) to a size of approximately 100 nucleotides. Fragmented mRNA was purified using Zymo Research RNA Clean and Concentrator Kit (Zymo Research #R1013). For m6A-immunoprecipitation (m6A-IP) both proteinA (ThermoFisher #10008D) and proteinG beads (ThermoFisher #1009D) were bound overnight at 4ºC with tumbling end-over-end to rabbit polycolonal anti-m6A (Synaptic Systems #202-003). m6A-IP was performed in 200 μl of IP buffer (150 mM NaCl, 0.1% NP-40, 10 mM Tris, pH 7.5) with 1 μl of RNaseOUT (ThermoFisher #10777019) for 3 h tumbling end-over-end at 4ºC. mRNA was first bound to proteinG beads and 5% of fragmented material was reserved for ‘input’ samples during library construction. Bead-bound antibody-RNA complexes were recovered on a magnetic stand and washed 2× with IP buffer, 2× with high-salt buffer (10 mM Tris, pH 7.5, 500 mM NaCl, 0.001% NP-40) 2× with low-salt buffer (10 mM Tris, pH 7.5, 50 mM NaCl, 0.001% NP-40) and 1× with IP buffer. After all washes, RNA was eluted from the proteinG beads with buffer RLT (Qiagen #74004) and cleaned on a RNeasy spin column and eluted in water. Eluted RNA was added to proteinA-antibody conjugated beads in IP buffer, and the binding, wash, and elution steps were repeated. After washing proteinA beads, the final elution was performed in 100 μl of nuclease-free water. Samples were dried by vacuum freeze drying to a volume <10 μl.
RNA 3′-ends were dephosphorylated in a 10 μl reaction with 2 μl T4 PNK (NEB; #M0201S) 1 μl of FastAP Thermosensitive Alkaline Phosphatase (ThermoFisher #EF0651), and 1 μl of RiboLock (ThermoFisher #EO0381) for 60 min in dephosphorylation buffer (70 mM Tris pH 6.5, 10 mM MgCl2, 1 mM DTT) with shaking. After 60 min, the components of the 3′-adaptor reaction were added (1 μl pre-adenylated and 3′-adaptor, 1 μl of 10× RNA ligase Buffer, 1 μl of T4 RNA Ligase (NEB #M0437M), 1 μl of 100 mM DTT, and 6 μl of PEG 8000) and the reaction was incubated overnight with shaking at 16ºC.
The following day, excess linker was removed by adding 2 μl of 10X deadenylation buffer, 1 μl 5′deadenylase (NEB #M0331S), 1 μl of RiboLock (ThermoFisher #EO0381) and 1 μl of RecJF (NEB #M0264S). Reactions were incubated for 1 h at 37ºC. Samples were cleaned up with Zymo Research RNA Clean and Concentrator Kit (Zymo Research #R1013). RNA was reverse transcribed with SuperScript IV reverse transcriptase (ThermoFisher #18090050) according to the manufacturer's protocol. cDNA was purified by Streptavidin C1 magnetic beads (ThermoFisher #65002) in Biotin Buffer (100 mM Tris, pH 7.0, 1 M NaCl, 0.1% Tween-20, 1 mM EDTA). The reaction was allowed to bind for 30 min at 20ºC with end-over-end tumbling. After 30 min, the reaction was applied to a magnetic stand and reactions were washed 2× with High Stringency Buffer (15 mM Tris–HCl, pH 7.5, 5 mM EDT, 1% Triton X-100, 1% sodium deoxycholate, 0.001% SDS, 120 mM NaCl, 25 mM KCl) and 2× with PBS. Samples were resuspended in 2 × 6 μl nuclease-free water and were boiled from the beads for 5 min at 95ºC. cDNA was circularized in a 15 μl reaction containing 12 μl cDNA, 0.5 μl circLigase II (Lucigen # CL9025K) 1.5 μl 10× circLigase buffer, 0.75 μl of 50 mM MnCl2 and nuclease-free water to 15 μl. Reactions were incubated for 2 h at 60ºC and purified by Ampure XP beads (Beckman #A63881). Libraries were PCR amplified in a 30 μl reaction containing 14 μl circularized library, 15 μl Phusion HF 2X master mix (NEB #M0531L), 0.75 μl of 20 μM P3/P6 tall primer mix and 0.25 μl of 25× Sybr Green (ThermoFisher #S7563). Libraries were amplified for 8–12 cycles as determined by RT-qPCR on a QuantStudio3 RT-qPCR thermal cycler. Amplified libraries were cleaned up using Ampure XP beads and eluted in 10 μl of nuclease-free water. Three additional cycles of PCR were performed in 20 μl total volume containing 10 ul Phusion HF 2× master mix and 250 nM of P3/P6 Solexa primer mix. All primers are listed in Supplementary Table S1.
Library cleanup was performed using a Zymo DNA Cleanup kit (Zymo #D4014) according to the manufacturer's protocol to remove dNTPs and to concentrate the volume. Libraries were then size selected by gel purifying DNA on a 10% TBE gel and cleanup was performed using a Zymo DNA Cleanup kit (Zymo # D4014) and the manufacturer's protocol. Library QC was performed on a DNA High Sensitivity D1000 Tape Station (Agilent) and subsequently sequenced on an Illumina NextSeq 550 instrument (1 × 50 bp).
Following sequencing, library barcode splitting, read collapse, and trimming of adaptor sequences was performed using scripts from the icSHAPE pipeline (https://github.com/qczhang/icSHAPE) (40). Trimmed reads were first mapped to a custom genome that includes rRNA and repeated genomic sequences. Reads that did not map to the costume genome were then aligned to the human genome (hg38) using STAR (v.2.7.6a) (35,36). We identified peaks using MACS2 (41). Peaks were required to appear in at least 2 replicates for further analysis. We extended the MACS2 identified peak summits to 100 nt to simulate the IP peak and performed intersection with the hg38 longest transcript isoforms using bedtools (v 2.30.0) (42). We identified peak changes using a generalized linear model and the DESeq2 (38) and QNB (43) programs in R (v 3.6.3). To control for changes in gene expression, gene level expression changes were subtracted from changes in IP peak reads for significantly modified peaks (44). Motif enrichment was calculated using HOMER (45) while metagene plots were constructed using MetaPlotR (46). GO-term annotation and enrichment was performed using Metascape (47) and GO-terms were collapsed with REVIGO (48) and plotted in R.
SLAM-seq
Metabolic labeling to determine RNA half-life followed the method of Herzog et al.(49) UOK262 cells were seeded the day before the experiment at a density that would allow for exponential growth for the duration of the experiment (approx. 50% confluency). The morning of the experiment, UOK262 media was removed and replaced with UOK262 media supplemented with 100 μM 4-thiouridine (4SU; Carbosynth #NT06186) to begin the ‘pulse’. 4SU-containing media was exchanged every 8 h during the 24 h ‘pulse’ period to increase the efficiency of labeling. Following 24 h labeling, the ‘pulse’ media was removed. Cells were washed 2× with PBS. Cell culture growth medium containing 10 mM uridine (i.e. 100× excess over 4SU; Sigma Aldrich #U3003-5G) was added to the cells to begin the ‘chase’. At select time points of interest, ‘chase’ media was removed, and cells were lysed in Trizol Reagent (ThermoFisher #15596026) according to the manufacturer's protocol with the following modifications: (a) RNA isolation was performed in the dark and (b) DTT (Sigma Aldrich #43816) was added to the aqueous phase (final concentration 0.1 mM) to keep samples under reducing conditions. RNA iodoacetylation was performed according to Herzog et al. To each reaction, we added 6 μg of RNA, 5 μl of 100 mM iodoacetamide (SigmaAldrich #I6125), 5 μl of 500 mM NaPO4, pH 8.0, 25 μl of DMSO and nuclease-free water to a final volume of 50 μl. Reactions were incubated in the dark for 15 min at 50ºC. Reactions were quenched with the addition of 1 μl of 1 M DTT. RNA was isolated by ethanol precipitation and resuspended in a final volume of 10 μl and RNA quality control was performed on RNA High Sensitivity TapeStation (Agilent).
Library preparation was performed using the QuantSeq 3′ mRNA library prep kit for Illumina (Lexogen #015) using the manufacturer's protocol and recommended maximum input amount (500 ng). Library sequencing was performed on a HiSeq 3000 machine in PE100 mode. Following the recommendation of Herzog et al., read 2 was discarded. Demultiplexed fastq files were applied to the SLAMDUNK pipeline (https://github.com/t-neumann/slamdunk) (Herzog et al. v 0.4.2) (49) and mapped against hg38. The optional –multimappers flag was enabled. Following the pipeline, the tcount output file was collapsed using the included SLAMDUNK Alleyoop collapse module. Curve fitting was performed according to a first-order decay reaction in R (v 3.6.3).
Ribosome profiling
Protocols were adapted from Arango et al.(50) and Ingolia et al. (51). Cells were plated in triplicate at a seeding density of 1.5 million cells per plate on 15-cm plates and grown to 80–90% confluency. At collection, media was aspirated, and cells were immediately flash frozen by submerging the bottoms of dishes in liquid nitrogen for 5–10 s. Cells were maintained on dry ice until collection. Cells were collected by scraping on wet ice using 500 μl Lysis buffer (10 mM Tris–HCl, pH 7.4, 5 mM MgCl2, 100 mM KCl, 1% Triton X-100, 2 mM DTT, and 100 μg/ml cycloheximide (Millapore-Sigma #C4859-1ML)). Lysis buffer was transferred from one plate to the next to collect the cells from all three plates (approx. 1.5 mL total volume). Cell lysates were then triturated 10 times with a 25-gauge needle and clarified by centrifugation at 20 000 x g for 10 min at 4°C. Lysates were aliquoted in 500 μl and stored at –80ºC until use.
Each lysate was treated with 0.3 U/μl (1.5 μl for 500 μl of lysate) of RNase I (ThermoFisher # AM2294) for 40 min at 20ºC, while the remaining lysate was flash frozen in liquid nitrogen for later total RNA isolation. Following the RNase I digestion, 7.14 μl of SUPERase-In (ThermoFisher # AM2694) were added to each sample, and the samples were loaded onto 15–45% sucrose gradients that were made in 5 mM Tris–HCl pH 7.4, 37.5 mM KCl, 0.75 mM MgCl2 buffer and by using a BioComp Gradient Master (BioComp), and centrifuged at 37 000 rpm in 4ºC for 2 h. Samples were then fractionated with BioComp fractionator. Fractions containing 80S monosomes were precipitated with 1 ml of 100% ice-cold ethanol at −80ºC. After precipitation, monosome containing fractions were pooled and resuspended in 250 μl of Trizol Reagent (ThermoFisher #15596026). Sample workup was performed with the Direct-Zol kit (Zymo Research #R2050) following the manufacturer's protocol. Samples were dried by vacuum freezing and quantified for ribodepletion.
Input samples were prepared from a 200 μl aliquot of the starting lysates in 800 μl of Trizol Reagent according to the manufacturer's protocol. Following phase separation, the aqueous phase was applied to a RNeasy Mini Kit (Qiagen # 74106) and RNA was purified according to kit instructions. Eluted input samples were then DNase treated using 4 U of Turbo DNaseI (ThermoFisher #AM2239) in 100 μl total reaction volume for 30 min at 37ºC. Following DNase treatment, reactions were cleaned on a RNeasy Mini Kit (Qiagen # 74106) following kit instructions. Samples were dried by vacuum freezing and quantified for ribodepletion.
For ribodepletion, 10 μg of each replicate (in 2 × 5 μg reactions) was ribodepleted using the RiboPool ribosome RNA Homo sapiens depletion kit (siTools Biotech #054). We supplemented this pool using custom-made oligos (designed by siTools) designed to be specific for our UOK cell line (1 μl of standard kit oligo + 1 μl of 1:30 dilution of custom oligos). The manufacturer's instructions were followed for ribodepletion. Duplicate reactions were pooled at the final elution step. Following ribodepletion, ribosome protected fragments (RPFs) were cleaned using a Zymo RNA cleanup kit (Zymo Research #R1016) following the manufacturer's protocol. The final elution was performed in 2 × 6 μl nuclease-free water. Inputs were spiked with 2 μl of 1:10 diluted ERCC Spike-in mix (ThermoFisher #4456740) and cleaned using a Zymo RNA cleanup kit (Zymo Research #R1016) following the manufacturer's protocol. The final elution was performed in 2 × 6 μl nuclease-free water. The cleaned input reactions were subsequently fragmented using Ambion RNA Fragmentation reagent (ThermoFisher #AM8740) for 4 min at 95ºC followed again by clean-up using a Zymo RNA cleanup kit and elution in 2 × 6 μl of water.
RPFs and inputs were electrophoresed on denaturing 15% Urea PAGE gels and RNA between 20 and 34 nt was size-selected. RNA was recovered from the gel by crush and soak and EtOH precipitation. RNA 3′-ends were dephosphorylated in a 10 μl reaction with 2 μl T4 PNK (NEB; #M0201S) 1 μl of FastAP Thermosensitive Alkaline Phosphatase (ThermoFisher #EF0651), and 1 μl of RiboLock (ThermoFisher #EO0381) for 60 min in dephosphorylation buffer (70 mM Tris pH 6.5, 10 mM MgCl2, 1 mM DTT) with shaking. After 60 min, the components of the 3′-adaptor reaction were added (1 μl pre-adenylated and 3′-adaptor, 1 μl of 10× RNA ligase Buffer, 1 μl of T4 RNA Ligase (NEB #M0437M), 1 μl of 100 mM DTT, and 6 μl of PEG 8000) and the reaction was incubated overnight with shaking at 16ºC.
Ligations were cleaned with a Zymo RNA cleanup kit (Zymo Research #R1016) and excess adaptor was removed through electrophoresis on a 15% denaturing Urea-PAGE gel. Following gel purification, RNA was reverse transcribed with SuperScript IV reverse transcriptase (ThermoFisher #18090050) according to the manufacturer's protocol. Following RT, samples were pooled as follows: WT RPFs, MUT RPFs, WT inputs and MUT inputs. Pooled samples were cleaned using the Zymo DNA Clean and Concentrator kit (Zymo Research #D4014) according to the manufacturer's protocol. Cleaned pools of samples were gel purified to remove excess primer and eluted cDNA was cleaned through Zymo DNA Clean and Concentrator kit (Zymo Research #D4014).
The cDNA from twice-cleaned pooled samples was circularized in at 15 μl reaction containing 12 μl cDNA, 0.5 μl circLigase II (Lucigen # CL9025K) 1.5 μl 10× circLigase buffer, 0.75 μl of 50 mM MnCl2 and nuclease-free water to 15 μl. Reactions were incubated for 2 h at 60ºC and purified by Ampure XP beads (Beckman #A63881). Libraries were PCR amplified in a 30 μl reaction containing 14 μl circularized library, 15 μl Phusion HF 2X master mix (NEB #M0531L), 0.75 μl of 20 μM P3/P6 tall primer mix (see Supplemental Table S1) and 0.25 μl of 25× Sybr Green (ThermoFisher #S7563). Libraries were amplified for 8–12 cycles as determined by RT-qPCR on a QuantStudio3 RT-qPCR thermal cycler. Amplified libraries were cleaned up using Ampure XP beads and eluted in 10 μl of nuclease-free water. Three additional cycles of PCR were performed in 20 μl total volume containing 10 uL Phusion HF 2× master mix and 250 nM of P3/P6 Solexa primer mix and were again cleaned using Ampure XP beads. Samples were subject to a final gel purification through a 10% non-denaturing TBE PAGE, to maximize the purification of RPF and input libraries, and to remove empty adapter bands. Samples were sequenced on a NextSeq 2000 P2, two independent times to obtain enough reads for analysis. All primers are listed in Supplementary Table S1.
Following sequencing of the input and IP samples, barcode splitting, read collapse, and trimming of adaptor sequences was performed using scripts from the icSHAPE pipeline (https://github.com/qczhang/icSHAPE) (40). Trimmed reads were first mapped to a custom genome that includes rRNA and repeated genomic sequences. Reads that did not map to the custom genome were then aligned to hg38 using STAR (v.2.7.6a) (35,36). Mapped reads were counted by htseq-count program (v 0.9.1) (37) and differential analysis was performed using DEseq2 (38) in R (v 3.6.3).
miRNA-seq
Total RNA was extracted from cells using Trizol Reagent (ThermoFisher #15596026) according to the manufacture's protocol. Following phase separation, the aqueous phase was applied to a RNeasy Mini Kit (Qiagen) and RNA was purified according to kit instructions. Libraries were prepared using the QIAseq microRNA Library Kit (Qiagen #331502) and sequenced using Illumina NovaSeq SP run with 100 base single-end reads. Reads for each sample were trimmed for adapters and low-quality bases using cutadapt (v 3.4) (34) and umitools (v 1.1.1) (52). Reads were mapped to hg38 using STAR (v 2.7.6a) (35,36) and were counted by htseq-count (v 0.9.1) (37). Differential analysis was performed using DEseq2 (38) in R (v 3.6.3).
RNA mass spectrometry
Total RNA was extracted from cells using Trizol Reagent (ThermoFisher #15596026) according to the manufacturer's protocol. Following phase separation, the aqueous phase was applied to a RNeasy Mini Kit (Qiagen) and RNA was purified according to kit instructions. For tRNA, tRNAs were separated on a 12% PAGE gel and bands between 70 and 90 nt were excised from the gel. The tRNAs were eluted from the gel overnight at 4ºC with end-over-end tumbling in an extraction buffer (10 mM Tris pH 7.5, 500 mM NaCl, 1 mM EDTA, 0.1% SDS). Eluted tRNAs were subsequently separated from gel pieces by passing the slurry through a 0.45 μM spin filter and were cleaned using Zymo Research RNA Clean and Concentrator Kit (Zymo Research #R1013) according to the manufacturer's protocol.
For polyA RNA, total RNA underwent two rounds of polyA selection using NEB oligo-d(T)25 beads and protocol, followed by one round of ribodepletion (ThermoFisher human/mouse transcriptome isolation kit #K155002) following the manufacturer's protocol for incubation and ethanol precipitation. RNA was decapped for 4 h at 37ºC in a total volume of 50 μl containing 500 ng RNA, 5 μl 10X NEB Buffer #2 (NEB #B7002S), 5 μl RppH (NEB #M0356S). Decapped RNA was cleaned using Zymo Oligo clean and concentrator kit (Zymo Research #D0460) following the manufacturer's protocol. The final elution was performed in 2 × 12 μl of nuclease-free water.
Total tRNA or decapped RNA was subsequently digested to nucleosides (53) in a 30 μl reaction containing 24 μl RNA, 1 μl of 2 U/μl Nuclease P1 (Sigma Aldrich, #N8630), 3 μl 1 M ammonium acetate, pH 5.2 and 100 fmol of 13C-adenosine (Cambridge Isotope #CLM-3678-0.05) as an internal standard. Reactions were digested for 3 h at 45ºC. After 3 h, 3μl of 1 M ammonium bicarbonate and 1 μl of 0.002 U/μl of snake venom phosphodiesterase from Crotalus ademanteus (Sigma Aldrich #P3243) were added to the reaction and incubation continued for 2 h at 37ºC. After 2 h, 1 μl of 1 U/μl bacterial alkaline phosphatase (ThermoFisher #18011015) was added to the reaction and the reaction continued for 1 h at 37ºC. Digested nucleosides were passed through a 3 kDa MWCO spin filter (Amicon # UFC500396) and the filter was rinsed with 3 × 200 μl nuclease free water before being dried under vacuum. Dried samples were dissolved in 45 μl Buffer A (0.1% formic acid). Nucleosides were separated on a Luna Omega C18 reverse-phase column (1.6 um PS, 100 Å, 30 mm, ID 2.1 mm, Phenomenex) with a flow rate of 0.200 μl/min under the following conditions. Buffer A = 0.1% formic acid in HPLC-grade water; Buffer B = 0.1% formic acid in acetonitrile with the gradient described in Supplementary Table S3. Following chromatography, nucleosides were resolved on a SciEX 500 QTOF in positive electrospray ionization mode using a Multiple-reaction-monitoring (MRM) MS method over the range of 100–350 Da (spray voltage = 5500 V; curtain gas = 35; CAD gas = 7; temperature = 600ºC; declustering potential = 60 V; collision energy = 10 V; accumulation time = 0.1 s). The nucleosides were quantified using the nucleoside to base ion mass transitions and analyzed as the ratio of m6A/A or m6Am/A. The precursor and product ions are listed in Supplementary Table S4.
Metabolite mass spectrometry
Cellular metabolites were extracted in 80% ice-cold methanol. The TCA metabolites were derivatized with 3-Nitrophenylhydrazine (3NPH; Sigma Aldrich #N21804) (PMID: 23580203) In a 500 μl plastic vial, 15 μl each of the extract (or standard), internal standard (IS), 1-ethyl-3-(3-dimethylaminopropyl) carbodiimide (EDC; Sigma Aldrich #39391) and 3NPH solutions were mixed. After heating at 40°C for 30 min, the vials were cooled on ice and 7 μl of butylated hydroxytoluene (BHT; Sigma Aldrich #PHR1117) was added. After centrifugation, the supernatant was transferred to injection vials. Liquid chromatography (LC) was performed with a Shimadzu 20AC-XR system. MS/MS was performed with a TSQ Quantiva triple quadrupole mass spectrometer (Thermo Fisher Scientific) operating in SRM mode with negative ionization. The injection volume was 3 μl. Separation was achieved at 60°C with a 2.1 × 100 mm, 2.7 μm Cortex C18 column (Waters). Mobile phase A was 0.01% formic acid in water and mobile phase B was 0.01% formic acid in acetonitrile. The flow rate was 300 μl/min and the metabolites were separated with a gradient (0–0.2 min/5% B; 12 min/60% B; 12.1–13 min/95% B; 13.1–15 min/5% B). The TCA metabolites and amino acids in the cell extracts were determined by calibration curves generated by the Thermo Xcalibur software. Calibration curves, constructed by plotting the peak area ratios versus standard concentrations, were fitted by linear regressions with 1/x weighting. The peak area ratios were calculated by dividing the peak areas of the target compounds by the peak areas of the corresponding isotopic internal standards.
m6A-IP qPCR
Positive and negative control transcripts were generated through in vitro transcription with the RNA MAXIscript T7 transcription kit (Thermo Fisher AM1312). Negative control transcripts (FLuc) were transcribed as normal, containing unmodified NTPs. For the positive control (mCherry), m6A-ATP (TriLink N-1013) was spiked into the in vitro transcription reaction at a ratio of 1:5 with regular ATP. In vitro transcription reactions were performed according to the manufacturer's protocol. Reactions were purified by the Zymo Research RNA Clean and Concentrator Kit (Zymo Research #R1013) according to the manufacturer's protocol and purity was checked by Tape Station. Positive and negative control transcripts were spiked into polyA selected mRNA following fragmentation and prior to immunoprecipitation (44). mRNA was polyA selected through two rounds of selection with oligo d(T)25 magnetic beads (NEB #S1419S), and fragmented and immunoprecipitated as described for the m6A-IP library generation. Ten percent of the sample was reserved prior to immunoprecipitation as the ‘input’ control. IP-enriched samples were dried by vacuum to a volume <16 μl. Reverse Transcription was performed with SuperScript IV Vilo reverse transcriptase (ThermoFisher #11754050) following the manufacturer's protocol for thermal cycling. qPCR reactions were normalized against the positive control m6A-containing mCherry transcript. All primers are listed in Supplementary Table S1.
m6A select
Antibody-independent quantification of m6A sites was performed following single-base elongation and ligation-based PCR amplification (SELECT) (54). Briefly, 1 ug of total RNA was mixed with 40 nM UP primer, 40 nm DOWN primer and 5 μM dNTP in 10X CutSmart Buffer (NEB) in a total reaction volume of 17 μl. The RNA and primers were annealed by incubating the mixture with the following temperature gradient: 90ºC for 1 min; 80ºC for 1 min; 70ºC for 1 min; 60ºC for 1 min; 50ºC for 1 min; then 40ºC for 6 min. Subsequently, a 3 μl mixture containing 0.01 U Bst 2.0 polymerase (NEB M0537S), 0.5 U SplintR ligase (NEB M0375S), and 10 nmol ATP was added. The final reaction mixture was incubated at 40ºC for 20 min, and then kept at 4ºC. qPCR amplification was measured on a QuantStudio3 RT-qPCR thermal cycler using the recommended parameters, as above described. All reverse transcription reactions (biological replicates) and qPCR reactions (technical replicates) were performed at least three times. Data are plotted as mean ± s.d. in either GraphPad Prism (v 9.0) or R-studio (v 3.6.3). All primers are listed in Supplementary Table S1.
Analysis of f5C modifications in tRNA
Treatment and analysis was performed as previously described (55). Briefly, total RNA was extracted from cells using Trizol Reagent (ThermoFisher #15596018) according to the manufacturer's protocol. 10 μg of extracted RNA was treated with 2 U of Turbo DNase (Invitrogen #AM2238) for 30 min at 37ºC, followed by subsequent cleanup on a Zymo Research RNA Clean and Concentrator Kit (Zymo Research #R1013). RNA samples were treated with sodium cyanoborohydride (1 M in H2O) or vehicle (H2O) in a final reaction volume of 100 μl. Reactions were initiated by the addition of 1 M HCl to a final concentration of 100 mM and incubated for 30 min at 60ºC. Reactions were quenched by the addition of 30 μl of 1 M Tris–HCl pH 8.0. The quenched reactions were adjusted to 200 μl with H2O and purified via ethanol precipitation. Reverse transcription was performed with SuperScript III (ThermoFisher # 18080044) according to the manufacturer's protocol. DNA was amplified using Phusion HF polymerase (NEB #M0530S) and reactions were cleaned on a Zymo DNA Clean and Concentrator kit (Zymo Research #D4014) prior to sanger sequencing. C-to-T mismatches in the sanger sequencing data were quantified using EditR (56). For high-throughput sequencing of f5C-containing tRNAs, RT was instead performed with barcoded primers. Libraries were amplified for 8–12 cycles as determined by RT-qPCR on a QuantStudio3 RT-qPCR thermal cycler. Amplified libraries were cleaned up using Ampure XP beads and eluted in 12 μl of nuclease-free water. DNA quality was assessed on a Agilent D1000 tape station. Barcoded cDNA samples were pooled at equimolar amounts and bands of the correct size were further purified by 10%-PAGE gel. DNA was extracted overnight by crush and soak then cleaned with a Zymo DNA Clean and Concentrator kit (Zymo Research #D4014) and DNA quality assessed on Agilent a D1000 tape station. Barcoded samples were pooled and sequenced on an Illumina MiSeq Micro in paired-end read mode. Demultiplexed reads were aligned to the human genome (hg38) using STAR (v.2.7.6a) (35,36). Misincorporation frequency was defined as the percentage of C-to-T mismatches at position 34, with a higher misincorporation frequency corresponding to a higher frequency of modification. Primers are listed in Supplementary Table S1.
m1A misincorporation analysis
Total RNA was extracted from cells using Trizol Reagent (ThermoFisher #15596018) according to the manufacturer's protocol. Following phase separation, the aqueous phase was applied to a RNeasy Mini Kit column (Qiagen #74106) and RNA was purified according to kit instructions. Following purification, the 28S and mt-ND5 transcripts were reverse transcribed 20 μl reaction using transcript-specific primers downstream of the m1A sites with Thermostable Group II Intron Reverse Transcriptase (TGIRT; InGex #TGIRT50) following the manufacturer's protocol. Completed reactions were cleaned on a Zymo DNA Clean and Concentrator kit (Zymo Research #D4014). Transcripts were amplified with barcoded oligos (Supplementary Table S1) targeting either 28S or mt-ND5 for 8–14 cycles as determined by RT-qPCR on a QuantStudio3 RT-qPCR thermal cycler. Reactions were purified by Ampure XP beads (Beckman #A63881) following the manufacturer's protocol. DNA quality was assessed on an Agilent D1000 tape station. Barcoded samples were pooled and sequenced on an Illumina MiSeq Micro in paired-end read mode. Demultiplexed reads were aligned to the human genome (hg38) using STAR (v.2.7.6a) (35,36). The presence of m1A was quantified using samtools-mpileup (57) to create individual base-pair frequencies for every position within the mt-ND5 and 28S rRNA transcripts. A window of 5 nucleotides centered on the m1A site was assessed. Misincorporation frequency was defined as the percentage of non-canonical base reads at a given site, with a higher misincorporation frequency corresponding to a higher frequency of modification. Misincorporation frequency was quantified by the sum of the frequencies of mis-read bases divided by the total read depth of a position.
Transwell migration assay
The transwell assays were performed using an adapted version of the protocol described in Justus et al.(58). Cells were serum starved overnight using 1% FBS. The following day, 15000 cells were plated evenly across each Permeable Support for 24-well plate with 8.0mm Transparent PET Membrane (Corning #353097) in triplicate, using a total of 100 mL of media. Next, 600 mL of complete media (containing 10% FBS), serving as a chemoattractant, was added to the lower chamber, while 600 ml of low serum (1% FBS) media was added to the lower chamber of the control wells. After 24–48 h of incubation in normal culture conditions, cells were removed from the upper chamber using a cotton tipped swab and fixed for 15 min in 70% ethanol. Cells were then stained for 30 min with 1% crystal violet aqueous solution (Sigma Aldrich #V5265) and washed several times in nuclease-free water. Membranes were allowed to dry before being imaged using the Lionheart FX Automated Microscope (Biotek). Migrated cells were then counted using ImageJ (v1.52k), and statistical analysis and plots were generated with R (v 3.6.3).
Reagents and biological resources
For a complete list of Biological Resources and Software, please refer to Supplementary Table S5.
Statistical analyses
All statistical tests, meaning, and values are listed in the main text or figure legends. The following statistical tests were used as appropriate: Student's two-tailed t-test, Fisher's exact test, Mann–Whitney U test, two-tailed binomial test, two-tailed Z test, ANOVA with multiple comparison assuming non-Gaussian distribution.
Results
Establishment of a system to study fumarate accumulation
Loss of FH activity and subsequent fumarate accumulation drive tumor development in HLRCC patients (15,18). To determine the effect of fumarate accumulation on levels of RNA methylation, we used a lentiviral system to generate isogenic cell lines that are distinguished solely by FH activity. To achieve this, we expressed either a FLAG tagged wild-type (UOK262-WT) or inactive version of FH (UOK262-MUT) in UOK262 cells (UOK262-PAR), an immortalized renal tumor cell line derived from a HLRCC patient (15) (Figure 1A). The FH transgene expressed in UOK262-MUT cells carries the same FH Q396P mutation as the parental UOK262 cells, which abrogates enzymatic activity, leading to the accumulation of high levels of fumarate (15). Although the isogenic cell lines express FH protein at equivalent levels (Figure 1B top, Supplementary Figure S1A), only the expression of wild-type FH restores enzymatic activity (Figure 1B middle, Supplementary Figure S1B). In-gel activity of the downstream TCA cycle enzyme, malate dehydrogenase (MDH), is similar in the two cell lines, demonstrating sample preparation preserved enzymatic activity (Figure 1B bottom and Supplementary Figure S1C).
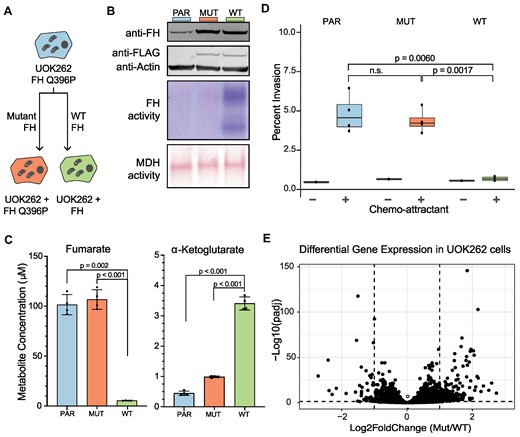
A cellular system to study the effect of fumarate accumulation on gene expression. (A) Cell lines used in the present study. The patient derived UOK262 cell line, which carries the fumarate hydratase (FH) Q396P mutation (blue) was used to generate isogenic cell lines that express either a WT (green) or mutant (orange) version of the FH protein. This color scheme is used throughout the manuscript. (B) Top panel: level of FH protein expressed in UOK262-PAR, UOK262-MUT or UOK262-WT cells as determined by western blot. Actin is used as a loading control. Middle panel: FH activity in UOK262 PAR, MUT and WT cell lines determined by an MTT-based colorimetric in-gel activity assay. Bottom Panel: Malate dehydrogenase (MDH) activity of UOK262-PAR, MUT, and WT cell lines determined by an MTT-based colorimetric in-gel activity assay. MDH activity was used as a loading control for FH activity. (C) LC–MS/MS analysis of fumarate (left) and αKG metabolite (right) levels from UOK262-PARENT, UOK262-MUT, and UOK262-WT cell lines. Error bars indicate mean ± s.d. from n = 4 replicates and statistical significance was determined by Student's t-test. Values to generate this plot are included in Supplementary Table S6. (D) Analysis of invasion potential of UOK262-PAR, UOK262-MUT, and UOK262-WT cell lines was measured on a transwell invasion assay. Error bars indicate mean ± s.d. for n = 3 replicates, and statistical significance was determined by t-test. (E) Volcano plot depicting steady state fold change in mRNA levels between UOK262-MUT and UOK262-WT cells. Changes in gene expression are determined with DESeq2. Values used to generate this plot are included in Supplementary Table S8.
Expression of the wild-type FH protein results in a 50-fold reduction in the level of fumarate and a significant increase in αKG compared to the UOK262-PAR and UOK262-MUT cell lines (Figure 1C). Previous work has demonstrated that a high αKG/succinate ratio promotes the activity of DNA and histone demethylases, and that modifying this ratio is sufficient to regulate multiple chromatin modifications (20,59). In our isogenic system the ratio between αKG and succinate changes approximately 30-fold from 0.143 in UOK262-MUT cells to 4.4 in UOK262-WT cells (Supplementary Figure S1D, Supplementary Table S6). The ratio observed in UOK262-WT cells is comparable to the ratio measured in the non-cancerous kidney cell lines HK2 (ratio = 2.0) and HEK293 (ratio = 5.1) (Supplementary Table S6). Together, this suggests that the metabolic environment in the UOK262-MUT cells disrupts the activity of 2OGDDs, which may contribute to changes in downstream modifications.
We examined whether the wild-type transgene restored the defective TCA cycle in the UOK262 parent cells. FH functions in the TCA cycle by catalyzing the interconversion of fumarate to malate. Metabolite levels in the TCA cycle (Supplementary Figure S1D), including malate, are restored by expression of wild-type FH enzyme (Supplementary Figure S1D). Additionally, in FH-deficient cells, argininosuccinate is generated from fumarate via reversal of the urea cycle enzyme argininosuccinate lyase (60). As expected, argininosuccinate levels in the UOK262-MUT cells were elevated compared to the UOK262-WT cells (Supplementary Figure S1E) (60,61).
Restoration of the TCA cycle also results in increased levels of ATP in UOK262-WT cells (Supplementary Figure S1F). Disruption of the TCA cycle often leads to high dependency on glucose for catabolism and anabolism (15) in cell lines. In agreement with previous research, the UOK262-PAR and UOK262-MUT cells are highly dependent on glucose for growth, while expression of wild-type FH in UOK262 decreases glucose dependency (Supplementary Figure S1G). Accumulation of fumarate caused by FH mutations can enhance cellular migration and invasion properties (25,62). Consistent with this observation, we found that restoration of FH activity significantly abrogates transwell cell invasion (Figure 1D) (63), suggesting that metabolic rewiring supports oncogenic phenotypes. Together, these results demonstrate that our isogenic system serves as a suitable model system to study the effects of fumarate accumulation.
To further characterize these cells, we performed gene expression profiling. Although introduction of the flag-tagged FH Q396P mutation has minimal impact on the transcriptome of the UOK262-PAR cells (Supplementary Figure S1H), the presence of functional FH (UOK262-WT) results in significant changes in gene expression (Figure 1E). Overall, we observe 1359 genes with significant changes in gene expression (padj < 0.05) between UOK262-MUT and UOK262-WT cells (Supplementary Table S7). Among the differentially expressed genes, we identified transcripts coding for proteins involved in chemotaxis, regulation of cell migration, and cell–cell adhesion (Supplementary Figure S2A). In agreement with previous work, we found genes in the PI3K-Akt signaling and the NRF2 pathways, which are dysregulated in UOK262 cells in response to fumarate accumulation (63,64), to be enriched among genes differentially expressed between UOK262-MUT and UOK262-WT cells (Supplementary Figure S2B, S2C). Previous work identified overexpression of microRNA hs-miR-200b-3p as a driver of EMT in cells that accumulate fumarate (25). In our isogenic cell system, we observed modest differences in miRNA levels between UOK262-MUT and UOK262-WT cells (Supplementary Figure S2D) (Supplementary Table S9). Additionally, we found no significant differences in mRNA level for hs-miR-200b-3p or hs-miR-200b-3p targets (Supplementary Figure S2E).
Expression of RNA demethylases of the 2OGDD family is not affected by metabolic rewiring
A high αKG-to-succinate ratio is necessary for the activity of αKG-dependent dioxygenases, and changes in this ratio have been shown to affect gene expression (20,59). Competitive inhibition of 2OGDDs by fumarate has been proposed to drive cellular transformation by inhibiting the activity of enzymes in this family. Five enzymes in this family act upon methylated RNAs, raising the possibility that RNA methylation levels can change in response to fumarate accumulation. An in vitro study found that the affinity of 2OGDD family members to fumarate, succinate and 2HG differs between individual enzymes (65). Therefore, we rationalized that the effect of fumarate accumulation on different RNA modifications might be varied. Of the 2OGDD enzymes that target RNA (Figure 2A), we evaluated the expression level of ALKBH1, ALKBH5 and FTO, which have been previously linked to cancer. When comparing UOK262-WT and UOK262-MUT cells, we observed no differences at either the mRNA or protein level of ALKBH1, ALKBH5 or FTO (Figure 2B, Supplementary Figure S2F, S2G). Similarly, the expression level of ALKBH1, ALKBH5 or FTO mRNAs is not significantly different when comparing normal renal cortex, primary and metastatic HLRCC sites in patient data (Figure 2C, Supplementary Figure S2H, Supplementary Table S10, Supplementary Table S11) (39). Thus, metabolic rewiring does not seem to impact the expression level of the ALKBH family members ALKBH1, ALKBH5 or FTO.
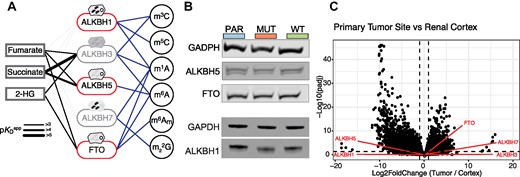
Changes in gene expression in response to fumarate accumulation. (A) Scheme depicting the 2OGDD family members that are known to act on RNA modifications. Those that are the subject of this study are highlighted. Subcellular localization is depicted above each enzyme. The thickness of the line between the metabolites and the enzymes represents the apparent pKD as described in (65). (B) Representative western blot of demethylases ALKBH1, ALKBH5 and FTO in UOK262 parental, MUT, and WT cell lines. GAPDH is used as a loading control. (C) Volcano plot of gene expression changes in patient mRNA samples between primary tumor and renal cortex sites. Changes in gene expression are determined with DESeq2. ALKB demethylases are highlighted in red. Values used to generate this plot are included in Supplementary Table S10.
ALKBH1 target modifications do not respond to fumarate accumulation
ALKBH1 localizes to multiple cellular compartments, including mitochondria (66–70) where fumarate levels are expected to be the highest (39–73). ALKBH1 removes m1A from tRNAs in the mitochondria and the cytoplasm (Supplementary Figure S3A), and plays a critical role in mitochondrial respiration by regulating the conversion of 5-methylcytosine (m5C) to f5C in the anticodon of mitochondrial tRNA-Methionine (mt-tRNA-Met) (Figure 3A, Supplementary Figure S3A) (67,74). As mitochondria localized ALKBH1 is exposed to high levels of fumarate, we examined whether f5C in mt-tRNAMet is impacted by accumulation of fumarate. Using a recently reported f5C sequencing assay to assess the presence of f5C in mt-tRNAMet (55), we observe no differences in f5C levels between UOK262-MUT and UOK262-WT cells (Figure 3B). To confirm that ALKBH1 is required for f5C formation in UOK262 cells we depleted ALKBH1 expression in the UOK262-WT background, where levels of fumarate are low and not expected to interfere with enzymatic function. We observe significant loss of f5C signal in UOK262 cells after ALKBH1 silencing by CRISPRi (Supplementary Figure S3B, Supplementary Figure S3C, S3D), and a complete loss of f5C in ALKBH1 CRISPR KO cell lines (Figure 3C, Supplementary Figure S3E). Exogenous expression of ALKBH1 in the ALKBH1 CRISPR KO cell lines partially restores f5C levels (Figure 3C, Supplementary Figure S3E). Combined, these data confirm that as previously shown (67,74,75), ALKBH1 is required for f5C formation in mt-tRNA-Met, but its activity towards m5C is not inhibited by high levels of fumarate. It is noteworthy that even with reduced levels of protein expression we do not observe any difference in f5C levels between our two isogenic cell lines (Supplementary Figure S3D). In addition to f5C, ALKBH1 demethylates the m1A modification in tRNA in both cytoplasm and mitochondria (Supplementary Figure S3A). We are not able to determine if fumarate accumulation inhibits ALKBH1 activity towards tRNA m1A since we do not observe significant differences in tRNA m1A levels after ALKBH1 depletion in our system (Supplementary Figure S3F).
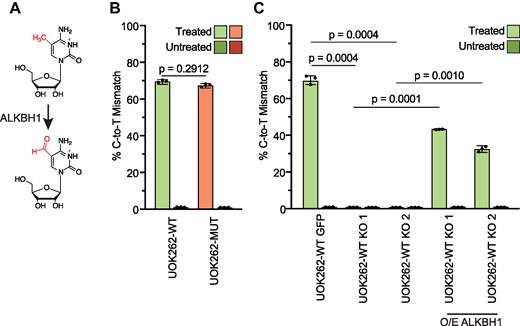
Changes in ALKBH1-dependent demethylation in response to fumarate accumulation. (A) Scheme depicting the oxidation of 5-methylcytosine to 5-formylcytosine by ALKBH1. (B) Percentage of C-to-T misincorporation at position 34 of mt-tRNA-Met for 5-formylcytosine in UOK262-WT (green) and UOK262-MUT (orange) cells. RNA treated with reducing agent is light green/orange and untreated RNA is dark green/orange, respectively. Error bars indicate mean ± s.d. of n = 3 replicates and p-values were calculated using Student's t-test. (C) Percentage of C-to-T misincorporation at position 34 of mt-tRNA-Met for 5-formylcytosine in ALKBH1 KO and ALKBH1 KO cells overexpressing ALKBH1 from a plasmid. UOK262-WT GFP were generated by targeting UOK262-WT cells with a sgRNA targeting the AAVS1 locus. Two independent ALKBH1 KO lines were generated by targeting ALKBH1 with two distinct sgRNAs. RNA treated with reducing agent is light green and untreated RNA is dark green, respectively. Error bars indicate mean ± s.d. of n = 3 replicates and P-values were calculated using Student's t-test.
Finally, we wondered whether fumarate accumulation affects mitochondrial mRNA methylation. Several transcripts, including mt-ND5, are known to contain the m1A modification (76). We leveraged the property of m1A to induce nucleotide misincorporation during cDNA synthesis to determine if m1A at mt-ND5 responds to fumarate. Targeted sequencing of the mt-ND5 m1A site showed no differences in cDNA misincorporation between UOK262-MUT and UOK262-WT, although overall the levels of misincorporation were relatively low (Supplementary Figure S3G). Sequencing of an amplicon containing position 1302 in 28S rRNA, which is known to contain the m1A modification at high stoichiometry, showed a high level of misincorporation in both UOK262-MUT and UOK262-WT cells (Supplementary Figure S3H), confirming the assay can detect m1A misincorporation.
Fumarate inhibits mRNA demethylation
While fumarate is thought to accumulate to the highest levels in the mitochondria, it has been shown that accumulation of fumarate or succinate inhibits 2OGDD enzymes found in the cytoplasm and nucleus (8,22–25,77–81). We sought to determine if loss of FH activity and subsequent accumulation of fumarate inhibits the activity of 2OGDDs that target RNA and localize outside of the mitochondria, such as ALKBH5 and FTO (Figure 4A). In this case, inhibition of these enzymes would result in mRNA m6A hypermethylation. Indeed, by LC–MS/MS we observe that high levels of fumarate correlate with increased levels of m6A in the mRNA fraction of the UOK262-MUT cells (Figure 4B). In addition to m6A, FTO can also remove N6,2′-O-dimethyladenosine (m6Am). However, by LC–MS/MS we did not observe a statistically significant difference between UOK262-WT and UOK262-MUT m6Am levels (Figure 4B).
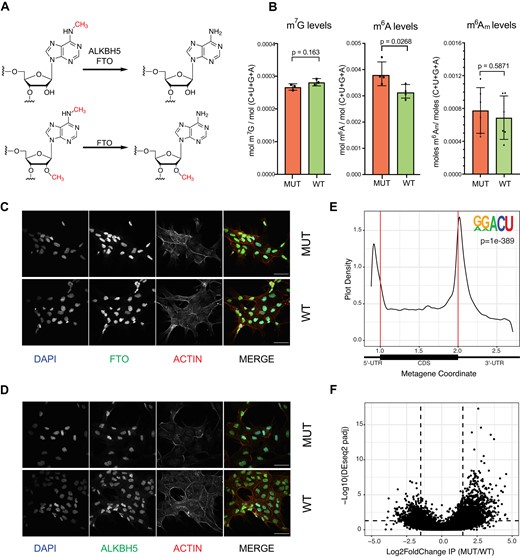
Changes in m6A and m6A-demethylase expression and localization in response to fumarate accumulation. (A) Scheme depicting the demethylation reactions performed by ALKBH family demethylases FTO and ALBKH5. (B) LC-MS/MS quantification of m7G, m6A and m6Am in polyadenylated RNA in UOK262-MUT and UOK262-WT cells. Error bars indicate mean ± s.d. for n = 4 replicates and p-values were determined by Student's t-test. (C) Representative immunofluorescent images of subcellular localization of FTO (green) in UOK262-MUT and UOK262-WT cells. The nucleus was stained with DAPI (blue) and the cytoplasm was visualized with actin (red). Scale bars = 10 μM. (D) Representative immunofluorescent pictures of subcellular localization of ALKBH5 (green) in UOK262-MUT and UOK262-WT cells. The nucleus was stained with DAPI (blue) and the cytoplasm was visualized with actin (red). Scale bars = 10 μM. (E) Metagene plot of peaks identified across transcripts in UOK262-MUT and UOK262-WT cells and motif enrichment analysis showing the most significantly enriched sequence across peaks identified with MACS2. De novo motif enrichment was performed with HOMER, p = 1e-120). (F) Volcano plots depicting fold change of reads in m6A peaks (m6A differential modification) in UOK262-MUT to UOK262-WT cells. Changes in m6A expression are present in Supplementary Table S12.
Considering the levels of FTO and ALKBH5 are similar between UOK262-MUT and UOK262-WT cells, one explanation for the elevated m6A levels could be due to changes in expression of the m6A methyltransferase complex. However, we observe no differences in mRNA or protein expression of the core components of the m6A methyltransferase complex (METTL3 and METTL14) when comparing UOK262-MUT and UOK262-WT cells (Supplementary Figure S4A, S4B), supporting the hypothesis that changes observed in m6A levels result from inhibition of demethylase activity by fumarate. While we do not observe changes in the protein levels of the core components of the methyltransferase complex or the demethylases (Figure 2A, Supplementary Figure S4A), differences in m6A levels could be derived from changes in demethylase localization, as demethylase localization has been shown to impact substrate choice and activity (82). Through a combination of cellular fractionation and immunohistochemistry we determined that loss of FH activity does not affect localization of FTO or ALKBH5. In both UOK262-MUT and UOK262-WT cells, FTO is found mainly in the nucleus, where the preferred substrate is m6A (82), while ALKBH5 is found in both nucleus and cytoplasm (Figure 4C, D; Supplementary Figure S4C). The same localization pattern for FTO and ALKBH5 can be observed in human renal cortex and UOK262 xenograft sections (Supplementary Figure S4D). Together, these results support the hypothesis that accumulation of fumarate in HLRCC inhibits the m6A erasers FTO and ALKBH5 and leads to RNA hypermethylation.
m6A-IP identifies changes in m6A sites
To identify sites of RNA hypermethylation dependent on fumarate accumulation, we performed m6A-immunoprecipitation (m6A-IP-seq) on both UOK262-MUT and UOK262-WT. In both cell types, the known m6A motif (RRACH) was identified through de novo motif discovery in regions enriched after m6A immunoprecipitation (Figure 4E). In agreement with previous studies, we observed a higher density of m6A enriched regions near the stop codon and the beginning of the 3′UTR (Figure 4E, Supplementary Figure S4E) (83,84). The m6A antibody can also capture the m6Am modification, which occurs exclusively in adenosines next to the mRNA cap (85–87). We observe an enrichment of m6A signal near the TSS, which could reflect sites of m6Am modification (Figure 4E).
We identified a total of 15501 m6A(m) peaks (across 7248 genes) in FH-deficient cells (UOK262-MUT) and 15122 m6A(m) peaks (across 6956 genes) in cells with active FH (UOK262-WT) (Collectively, we refer to the base modifications detected through m6A-IP as m6A(m), although most are likely m6A). When we performed differential m6A methylation analysis comparing UOK262-MUT and UOK262-WT peaks (44,88), we identified 1129 peaks with higher m6A(m) signal (Padj < 0.05; log2FoldChange (l2fC) ≥ 1.5) in cells that accumulate fumarate (UOK262-MUT) as compared to UOK262-WT (Figure 4F). These peaks are distributed across 943 transcripts, and the majority of these m6A peaks (800 peaks) are detected exclusively in UOK262-MUT, while the remaining 143 peaks are detected in both cell types. m6A-IP-RT-qPCR analysis of peaks identified in our differential methylation analysis confirmed higher signal after m6A immunoprecipitation in the UOK262-MUT cells (Supplementary Figure S4F). For two of the regions with higher signal in both the m6A-IP-seq and m6A-IP-RT-qPCR we were able to design SELECT probes. For at least one m6A site in each peak we observed less cDNA signal in UOK262-MUT cells, in line with an increase in m6A (Supplementary Figure S4G). The number of upregulated peaks per transcript ranges from one to five, with the majority (806 transcripts) having a single upregulated peak (Supplementary Figure S4H). Additionally, we identified a small subset of transcripts (192) where all detected m6A peaks are upregulated. Of these, 13 transcripts have multiple m6A peaks, while on the remaining transcripts we detected a single m6A peak. Conversely, we identified 499 peaks with lower m6A levels (Padj < 0.05; l2fC ⇐ −1.5) in cells that accumulate fumarate (Figure 4F). Of the 443 genes with peaks with lower m6A levels, 56 transcripts have m6A sites where all peaks are downregulated.
Given the size of the RNA fragments in our IP experiment, peaks within the first 100 nt of the transcript could represent sites of m6Am modification, which can also be recognized by the m6A-antibody. In our data sets, approximately 20% (3672) of peaks are found within the first 100 nt of the transcript (Supplementary Figure S4I)). Of the 3553 transcripts with a peak in the first 100 nt, about 46% (1631 transcripts) have previously been identified as m6Am modified (Supplementary Table S12) (89–91). Among the 1129 upregulated peaks, 137 peaks (55 previously identified as m6Am modified) are found in the first 100 nucleotides and are potential m6Am sites. Finally, for the transcripts identified with a single upregulated site, 53 are potential m6Am sites. Overall, the m6A-IP-seq data agrees with the observed increase of m6A on a global level and identifies transcripts with increased levels of m6A modification.
Impact of fumarate dependent m6A hypermethylation on RNA metabolism
Transcripts with higher m6A(m) levels in UOK262-MUT are enriched for the biological process GO-terms cell adhesion (GO:0030155), and actin cytoskeleton organization (GO:0030036) (Figure 5A). Among the peaks with higher m6A signal we identified the gene Oxoglutarate Dehydrogenase (OGDH), a known target of ALKBH5 (92) and RARA, a known target of FTO (93). Additionally, since a fumarate-dependent invasion phenotype is one of the hallmarks of HLRCC, we asked if genes involved in epithelial to mesenchymal transition (EMT), known to be an important driver of this phenotype, are represented among the hypermethylated genes. We identified 89 ‘EMT signature’ genes among the transcripts with higher m6A levels in cells that accumulate fumarate (Supplementary Table S13). Among these we identified vimentin, ZEB1, and ZEB2, genes previously implicated in EMT in UOK262 cells (25).
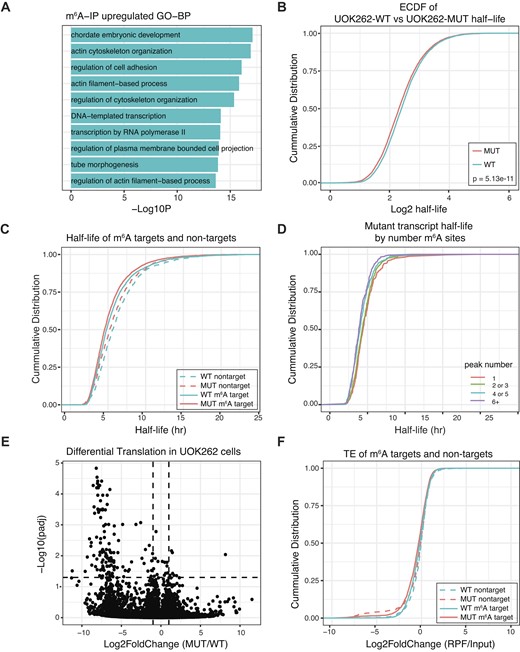
Transcriptome-wide mapping of m6A shows changes in cells with fumarate accumulation. (A) GO-biological term enrichment analysis for genes that are upregulated (l2fc > 1.5 and Padj < 0.05; blue) in m6A-IP data. Depicted are the top 10 enriched GO-terms. (B) Cumulative distribution function (CDF) of high-confidence transcript stabilities for approx. 6800 transcripts (n = 3 replicates). P-value was determined with KS-test. (C) CDF plot depicting mRNA half-life of m6A-target and non-target transcripts between UOK262-MUT and UOK262-WT cells. P-values were determined with KS-test. (D) Representative CDF plot depicting the half-life of transcripts from UOK262-MUT cells as a function of the number of m6A-peaks on each transcript. (E) Volcano plot depicting fold changes in mRNA translation between UOK262-MUT and UOK262-WT cells. Changes in ribosome occupancy for each transcript, relative to input levels, are determined with DEseq2. (F) CDF depicting translational efficiency of m6A-target and non-target transcripts between UOK262-MUT and UOK262-WT cells. P-values were determined with KS test. Values from half-life figures are available in Supplementary Table S14 and values from Ribo-seq figures are available in Supplementary Table S15.
Previous literature implicates a role for m6A in mRNA stability and translation (reviewed in (94)). To understand if fumarate dependent changes in m6A levels affect mRNA stability in FH deficient cells we used metabolic labeling to determine transcript half-life in both UOK262-WT and UOK262-MUT cells (Figure 5B, Supplementary Table S14) (49). As previously described, we observed that m6A modified transcripts have a shorter half-life than transcripts with no m6A modification in both UOK262-WT (transcripts with no m6A modification vs modified transcripts: KS-test = P = 4.22 × 10⁻¹⁵) and UOK262-MUT cells (transcripts with no m6A modification vs modified transcripts: KS-test P= 2.2 × 10⁻¹⁶) (Figure 5C). Furthermore, transcripts with a higher number of m6A sites display a shorter half-life (Figure 5D). As observed in other studies (49,95), transcripts with longer half-lives are enriched for genes associated with cellular macromolecule metabolism (Supplementary Table S14), while transcripts with shorter half-lives are enriched for genes associated with regulation of cellular death and differentiation (Supplementary Table S14).
Comparison of mRNA half-life between WT and MUT cells shows a trend of shorter half-life for transcripts in cells that accumulate fumarate (mean half-life MUT= 5.69 h; WT = 6.14 hr, KS-test P = 5.13e-11) (Figure 5C). Transcripts with shorter half-lives in UOK262-MUT cells are enriched for genes associated with mitochondrial translation and mitochondrial gene expression while those with longer half-lives are associated with regulation of cell death and regulation of cell differentiation (Supplementary Figure S5A–D). While we observe decreased mRNA stability in UOK262-MUT cells, these differences are not specific to transcripts with fumarate dependent changes in m6A levels (Figure 5C, LS-means = 0.441). Thus, we conclude that fumarate-dependent gain of m6A is not driving loss of mRNA stability in UOK262-MUT cells.
Finally, to determine if fumarate dependent changes in m6A levels affect translation, we examined ribosome occupancy across the transcriptome through sequencing of ribosome protected fragments (Ribo-seq) (Supplementary Table S15) (51). Comparing the translation efficiency (TE) in UOK262-WT and UOK262-MUT cells (Figure 5E), we observed minor differences between the two cell types. The majority of these differentially translated transcripts are found at low levels in the ribosome fraction. Finally, when we assessed the role of m6A modification in TE, we did not observe differences between m6A modified transcripts and transcripts with no m6A modification (Figure 5F). Together, these observations suggest fumarate accumulation does not substantially affect translation of m6A-containing RNAs.
Discussion
Throughout development, cells utilize distinct metabolic strategies to support growth, produce energy and meet the unique demands of each tissue to maintain homeostasis (96,97). In cancer, metabolic reprogramming facilitates cellular proliferation and acquisition of new properties (3,4). One instance of cancer-associated metabolic reprogramming with a significant role in cancer is the shift to aerobic glycolysis driven by mutation of metabolic enzymes, such as the TCA cycle enzyme FH. This change results in altered cellular metabolite levels, which affect cellular signaling and gene expression (21). The shift in metabolism driven by loss of FH activity generates an inhibitory environment for enzymes in the 2OGDD family. This family of enzymes catalyzes hydroxylation reactions on proteins, nucleic acids, and lipids, and is involved in multiple pathways critical to maintaining cellular homeostasis (19). While previous studies have demonstrated inhibition of 2OGDDs acting on DNA, histones, and the HIF transcription factor by fumarate (8,22–25,77–81), no study has addressed the role of fumarate accumulation on RNA post-transcriptional modifications. Here, we sought to determine how the intracellular metabolic environment in HLRCC tumors, caused by loss of FH, affects the activity of ALKBH1, ALKBH5 and FTO, three RNA demethylases in the 2OGDD family. While these enzymes share a requirement for αKG, oxygen, and Fe2+ for catalysis, they have diverse substrate specificities and act on different classes of RNA transcripts (Figure 2A). As such, accumulation of fumarate can have a wide impact on RNA methylation.
Accumulation of fumarate does not affect ALKBH1 activity
ALKBH1 is localized to multiple sub-cellular compartments where it regulates the level of methyl modified nucleotides on cytoplasmic and mitochondrial tRNAs (74). In addition, ALKBH1 is required for the formation of f5C at position 34 of the cytoplasmatic tRNALeu (CAA) and the mitochondrial tRNAMet. On mt-tRNAMet the cytosine at position 34 is methylated by NSUN3 to m5C and then converted to f5C by ALKBH1. Modification of the anti-codon loop of mt-tRNAMet with f5C is required for translation of non-universal initiation codons (AUA and AUU) in mammalian mitochondria (67,74,98,99). Loss of either NSUN3 or ALKBH1, and subsequent loss of f5C negatively affects mitochondrial function and has been linked to a number of diseases, including cancer (67,74,98,100). Given the critical importance of ALKBH1 to mitochondria function, and the previous observations that mitochondrial function in HLRCC is impaired (15,25,62,39), we hypothesized that accumulation of fumarate contributes to loss of mitochondria function through disruption of f5C modification on mt-tRNAMet. An analysis of f5C levels at the anti-codon loop of mt-tRNAMet revealed no loss of f5C in cells that accumulate high levels of fumarate (Figure 3B). We propose that ALKBH1 activity in the conversion of m5C to f5C is not sensitive to fumarate as an inhibitor, perhaps reflecting selective pressure on ALKBH1 to be functional in a cellular compartment that experiences fluctuations in metabolite accumulation, including fumarate, throughout development. We are unable to evaluate the effect of fumarate accumulation on ALKBH1 activity towards m1A on tRNAs, as we do not observe an effect on m1A tRNA levels in cells lacking ALKBH1 activity. Our observations in the UOK262 cell line agree with previous studies that measured druggability of enzymes in the 2OGDD family and found ALKBH1 to be less susceptible to inhibition by αKG related oncometabolites (65).
Accumulation of fumarate leads to mRNA m6A hypermethylation
While fumarate is thought to accumulate to the highest levels in mitochondria, it has been shown that accumulation of fumarate or succinate inhibits enzymes of the 2OGDD family found in the cytoplasm and nucleus, resulting in pseudohypoxia, by stabilizing the transcription factor HIF1α (22,77,78) and hypermethylation of DNA (8,23–25,79–81). We therefore asked if FTO and ALKBH5, two enzymes of the 2OGDD family that localize to the nucleus or cytoplasm and act on mRNA, are affected by accumulation of fumarate. Both FTO and ALKBH5 are capable of demethylating m6A at internal positions (82), while FTO can additionally remove the m6A methyl group from m6Am, a modification present in the extended cap structure of mRNA (89,90). In accordance with potential inhibition of FTO, ALKBH5, or both by fumarate, we observed an increase in global mRNA m6A levels when cells accumulate fumarate (Figure 4B). We observe no changes in expression, or localization, of the methyltransferases or demethylases in our isogenic cell lines that could explain the differences we observe in m6A levels. This is consistent with previous work that has demonstrated that the ability of FTO to demethylate single-stranded DNA can be inhibited by fumarate (101), and that FTO activity is sensitive to the balance between metabolites in the TCA cycle (102,103).This increase of m6A is not homogenous across the transcriptome, as we observe a gain in m6A in less than 10% of total sites detected in our experiment. This specificity likely reflects the differences in affinity of FTO and ALKBH5 for each site across the transcriptome (82,86,104,105). In contrast to m6A, we did not observe a statistically significant difference in global m6Am levels between UOK262-WT and UOK262-MUT cells (Figure 4B).
Hypermethylated transcripts include genes involved in multiple cellular processes, including cell migration and EMT. To understand how fumarate dependent changes in m6A levels impact gene expression in fumarate deficient cells we compared RNA stability and translation in UOK262-MUT and UOK262-WT cells. In our isogenic system, we did not find statistically significant changes in half-life for the m6A modified population of transcripts between the two cell lines (Figure 5C). Yet the observation that m6A modified transcripts tend to have a shorter half-life in both UOK262-MUT and UOK262-WT cells, and that this effect depends on the number of m6A regions (Figure 5D), supports a role for m6A in controlling transcript stability in our isogenic system. The lack of impact of fumarate dependent m6A hypermethylation might be related to the distribution of hypermethylated sites. The distribution of hypermethylated regions (peaks) is heterogenous, and in most hypermethyated transcripts, there is a single upregulated peak. It is possible that upregulation of m6A on only a fraction of possible sites on a transcript is not enough to affect its half-life. Across the transcriptome, while we see differences in RNA stability among transcripts with one and six or more m6A regions, differences between groups that differ by one or two m6A regions are modest. In fact, a recent study (106) has suggested that m6A-dependent regulation of half-life is complex, as only small differences in RNA expression levels were observed for groups of transcripts with high levels of methylation. It is also possible that fumarate dependent changes in m6A can affect RNA half-life, but not under the conditions used to culture the cells for our assays. It is worth pointing out that under proliferation conditions, in rich media containing an excess of glucose, the two cell lines have similar growth kinetics. It is only under conditions that mimic invasion that cells lacking FH activity show a phenotype. Under different conditions, such as during the process of invasion which is modulated by fumarate, differences in signaling pathways and other cellular processes could sensitize pathways controlling mRNA stability or translation to respond to fumarate dependent changes in m6A. In fact, across several systems loss of methyltransferase complex is tolerated under some conditions, such as proliferation, but blocks other cellular processes such as differentiation (107–111). Future work will determine if manipulation of ALKBH5 or FTO activity affects the fumarate dependent invasion phenotype of these cells. It is also important to acknowledge, when performing comparative analysis of the m6A-IP-seq and SLAM-seq datasets, that there are inherent limitations associated with each methodology. In this study we used m6A-IP-sequencing to identify m6A modified transcripts and evaluate if m6A levels at each transcript region are responding to fumarate accumulation. This approach may lack the sensitivity required to fully characterize changes in m6A in response to inhibition of demethylase activity, making it difficult to distinguish m6A sites that respond to fumarate accumulation from sites that do not change. Future studies leveraging techniques capable of measuring m6A stoichiometry at individual loci, are poised to yield new insights into the effect of fumarate accumulation on m6A levels.
Accumulation of fumarate has different impacts on ALKBH family members
RNA demethylases in the αKG-dependent dioxygenase family act on diverse RNA modifications. We hypothesized that inhibition of these enzymes by accumulation of fumarate, or other structurally related metabolites, can globally remodel the RNA methylome. Given the differences in the binding affinity for αKG, or related TCA metabolites, between different RNA demethylases in the 2OGDD family, the effect on each type of RNA methylation will be different. In fact, previous work on the druggability of 2OGDDs found that ALKBH1, found in the mitochondria, is highly specific for αKG, and less susceptible to inhibition by the oncometabolites 2GH, succinate, and fumarate (65). Our observations that ALKBH1 targets are not affected by fumarate accumulation agree with this early study (Figure 2A). One hypothesis is that the demethylases with essential roles in mitochondria function have evolved to perform their vital functions in an environment with fluctuating levels of co-factors and potential inhibitors. In contrast, ALKBH5 and FTO have some sensitivity to both fumarate and succinate, two metabolites that accumulate because of loss of FH activity. The affinity of FTO for fumarate was found to be similar to that of EGLN1 (also known as PHD2), an enzyme shown to respond to fumarate accumulation (65). It is interesting to note that ALKBH5 is predicted to be more sensitive to the effects of fumarate than FTO, and to therefore hypothesize that targets of ALKBH5 may be more affected by fumarate accumulation. It remains to be determined if both ALKBH5 and FTO are impacted by excess fumarate. Not only do the two enzymes have different affinities to αKG and fumarate, differences in localization between the two proteins could result in different levels of inhibition. FTO, which is exclusively nuclear, and the nuclear pool of ALKBH5 might be inhibited to different levels than the cytoplasmic pool of ALKBH5. Previous work has demonstrated that chromatin-associated RNA (caRNAs), including enhancer RNAs and retrotransposable elements, and mitochondrial polycistronic transcripts are methylated and substrates for enzymes in the ALKB group. Further work will be necessary to determine if other types of RNA modifications, or modifications on other types of RNA transcripts, are affected by fumarate accumulation.
In summary, we report a link between loss of FH and regulation of RNA methylation through the demethylases in the 2OGDD family. While our results focus on fumarate accumulation, it is interesting to note that the diversity of metabolic rewiring observed in tumors, including mutations in different enzymes of the TCA cycle, can affect RNA post-transcriptional modifications in distinct ways. In addition, underlying tissue-specific factors, and the sensitivity of these enzymes to different inhibitors, may lead to pro-tumorigenic or non-growth promoting environments, as well as opportunities for future therapeutic interventions. The distinct impact of each metabolite on different enzymes opens the door to targeted inhibition and modulation of specific modifications.
Data availability
The raw sequencing data obtained from the RNA-seq, miRNA-seq, m6A-IP, ribosome profiling, SLAM-seq and reported in this paper have been deposited in GEO (Accession number GSE228565). The high-throughput sequencing data from patient samples were previously generated and is available at GEO at GSE157256. High-throughput sequencing data was processed using freely available software. Scripts used to process data and generate plots can be found at https://github.com/BatistaLab/UOK_manuscript and https://figshare.com/articles/software/UOK_manuscript/22674100. For a complete list of software, please refer to Supplementary Table S5. Plasmids for lentiviral expression of FH created in this study have been deposited with Addgene.
Supplementary data
Supplementary Data are available at NAR Cancer Online.
Acknowledgements
We thank Jaye Gardiner, Susan Gottesman, Sezen Meydan Marks, Khoa Tran, Joana Vidigal and members of her lab, and Sandra Wolin for critical reading of the manuscript. The authors thank the Center for Cancer Research (CCR) Genomics Core in Bethesda, Maryland, as well as the CCR Sequencing Facility in Frederick, Maryland, for help with high-throughput sequencing. The authors would also like to thank the CCR mass spectrometry core for their help with the metabolite MS experiments, and the CCR Microscopy core for their help with the IF experiments. This work utilized the computational resources of the NIH HPC Biowulf cluster (http://hpc.nih.gov). We appreciate the editorial assistance of George Leiman. The views expressed in this article are those of authors and may not reflect the official policy or position of the National Institute of Health, Department of the Army, Department of Defense. Mention of trade names, commercial products, or organizations does not imply endorsement by the U.S. Government.
Author contributions: Conceptualization: C.M.F., P.J.B. Methodology: C.M.F., M.D.M., D.R.C., J.L.M., W.M.L., P.J.B. Formal analysis: C.M.F., M.D.M., J.C.L., D.C., S.S.M., A.C.S., S.T.G., C.L., L.M.J., T.A., K.C., D.R.C., P.J.B. Investigation: C.M.F., M.D.M., J.C.L., D.C., S.S.M., A.C.S., S.T.G., C.L., T.A., K.C., L.M.J., D.R.C. Resources: L.M.J., W.M.L., P.J.B. Data Curation: C.M.F., M.D.M., S.S.M. and P.J.B. Writing - Original Draft: C.M.F., P.J.B. Writing - Review & Editing: C.M.F., M.D.M., D.R.C., J.L.M., P.J.B. Visualization: C.M.F., M.D.M., J.C.L., D.C., S.S.M., P.J.B. Supervision: J.L.M., W.M.L., P.J.B. Funding acquisition: C.M.F., J.L.M., W.M.L., P.J.B.
Funding
J.L.M., W.M.L. and P.J.B. are supported by the Intramural Research Program at the National Cancer Institute (NCI) of the National Institutes of Health; C.M.F. is partially supported by a Postdoctoral Fellowship from the American Cancer Society (PF-19-157-01-RMC).
Conflict of interest statement. None declared.

Comments