


Abstract
Stromal cells promote extensive fibrosis in pancreatic ductal adenocarcinoma (PDAC), which is associated with poor prognosis and therapeutic resistance. We report here for the first time that loss of the RNA-binding protein human antigen R (HuR, ELAVL1) in PDAC cells leads to reprogramming of the tumor microenvironment. In multiple in vivo models, CRISPR deletion of ELAVL1 in PDAC cells resulted in a decrease of collagen deposition, accompanied by a decrease of stromal markers (i.e. podoplanin, α-smooth muscle actin, desmin). RNA-sequencing data showed that HuR plays a role in cell–cell communication. Accordingly, cytokine arrays identified that HuR regulates the secretion of signaling molecules involved in stromal activation and extracellular matrix organization [i.e. platelet-derived growth factor AA (PDGFAA) and pentraxin 3]. Ribonucleoprotein immunoprecipitation analysis and transcription inhibition studies validated PDGFA mRNA as a novel HuR target. These data suggest that tumor-intrinsic HuR supports extrinsic activation of the stroma to produce collagen and desmoplasia through regulating signaling molecules (e.g. PDGFAA). HuR-deficient PDAC in vivo tumors with an altered tumor microenvironment are more sensitive to the standard of care gemcitabine, as compared to HuR-proficient tumors. Taken together, we identified a novel role of tumor-intrinsic HuR in its ability to modify the surrounding tumor microenvironment and regulate PDGFAA.
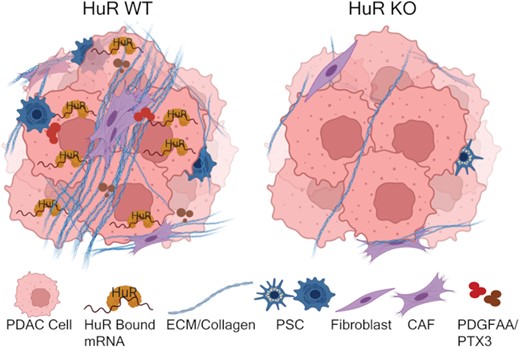
Loss of the RNA-binding protein human antigen R (HuR) in pancreatic cancer cells leads to reprogramming of the tumor microenvironment and decreased secretion of signaling molecules PDGFAA and PTX3.
INTRODUCTION
The poor survival rate for pancreatic ductal adenocarcinoma (PDAC), 11.5% for 5 years, is largely due to the aggressive and chemoresistant nature of the disease (1). It is believed that the heterogeneous tumor microenvironment (TME) of PDAC contributes toward the lethal nature of this disease (2–4). With up to 80% of the tumor mass consisting of non-cancer stromal cells and extracellular matrix (ECM), these tumors are a complex ecosystem (5). The PDAC stroma involves multiple cell types, including pancreatic stellate cells (PSCs) and cancer-associated fibroblasts (CAFs). During carcinogenesis, these stromal cells become activated, promoting extensive fibrosis, or desmoplasia, in the PDAC TME (6–10). Desmoplasia has been linked to poor clinical outcomes in patients with PDAC, and is associated with compromised drug delivery, resistance to cytotoxic therapies, hampered immune infiltration, and tumor growth and proliferation (2–4,6,11–17). For instance, CAF and PSC stromal cells play active roles in gemcitabine (GEM) resistance by scavenging GEM, limiting its availability to affect tumor cells, in addition to releasing deoxycytidine as a competitive inhibitor of GEM (18–20). Thus, targeting and understanding the relevance of stroma in relation to chemotherapy responses is at the forefront of interest in the field (14,21–30).
The RNA-binding protein human antigen R (HuR, ELAVL1) has been shown to drive PDAC drug resistance (31–34). Upon cellular stressors that are either intrinsic (e.g. low glucose, hypoxia, DNA damage) or extrinsic (e.g. chemotherapy), HuR translocates from the nucleus to the cytoplasm where it typically binds to adenine- and uridine-rich RNA elements in the 3′ untranslated region, resulting in increased stability and translation of target transcripts (31–37). An increase in overall and cytoplasmic abundance of HuR has been shown in multiple tumor types (e.g. PDAC, breast, ovarian, prostate, colon) (38–45). Cytoplasmic HuR is commonly associated with poor clinical outcomes in these diseases (e.g. high grade, poor prognosis, poor survival) (39–48).
Utilizing a transgenic mouse model, we previously demonstrated that pancreas-specific overexpression of HuR alone did not initiate tumorigenesis; however, we observed increased fibroblast presence, fibrosis and collagen deposition, ultimately resulting in an altered pancreas microenvironment (43). Interestingly, with the addition of a pancreas-driven KRASG12D mutation, enhanced pancreas-specific HuR expression increased the incidence of precursor neoplastic lesions and PDAC (43). Along those lines, forced overexpression of HuR in a subcutaneous xenograft mouse model enhanced tumor growth (45). Accordingly, we demonstrated that HuR CRISPR knockout (HuR KO) PDAC cells have a subcutaneous xenograft lethal phenotype (i.e. HuR KO cells are unable to engraft in the flank of nude mice) (49).
Based on these observations, in addition to HuR shown to be activated by TME elements [i.e. low glucose, hypoxia, DNA damage (31–36)], we wanted to directly address whether deletion of HuR in PDAC cells in a physiologically relevant TME would impact tumor growth. To date, tumor-intrinsic HuR in its relation to the TME has yet to be thoroughly explored. Therefore, we utilized orthotopic xenograft mouse models to further elucidate the impact of tumor-intrinsic HuR on the PDAC TME. We show that although HuR deficiency does not inhibit tumor growth, HuR is crucial for the integrity of the PDAC TME landscape, impacting collagen deposition and stromal cell presence, and ultimately hampering GEM effectiveness.
MATERIALS AND METHODS
Tissue microarrays
Pancreatic tissue microarrays (TMAs) of PDAC and normal pancreas samples were constructed using formalin-fixed, paraffin-embedded samples from patients at Oregon Health & Science University Hospital (Portland, OR). Patients were consented to the Institutional Review Board approved protocol # 3609, Oregon Pancreas Tissue Registry. Samples were deidentified before authors’ acquisition and analysis. These TMAs consisted of 56.6% female patients, with the median age being 66 years (interquartile range was 58–71 years). Verification of tissue staging and grading was performed by a pathologist (T.K.M.) on hematoxylin and eosin stained adjacent TMA sections.
Adjacent serial sections of TMAs were stained for HuR via immunohistochemistry. Slides were deparaffinized in xylene, rehydrated and blocked for endogenous peroxidase activity in 1% hydrogen peroxide for 30 min. Antigen retrieval was performed by boiling slides for 20 min in a citrate-based solution, pH 6 (# H-3300-250, Vector Laboratories, Burlingame, CA). Sections were blocked with 5% BSA and 2% NGS in Tris-buffered saline with 0.1% Tween (TBS-T). Next, slides were incubated overnight at 4°C with the primary HuR antibody diluted 1:300 in blocking buffer. Slides were next rinsed and incubated with a biotinylated secondary antibody (1:500) and ABC solution (# PK-6100, Vector Laboratories, Burlingame, CA). Sections were developed utilizing DAB substrate (3,3′-diaminobenzidine, # SK-4100, Vector Laboratories, Burlingame, CA), counterstained with hematoxylin, dehydrated and mounted with cytoseal.
TMA total HuR IHC scoring was performed by a pathologist (T.K.M.) on ductal cells where grading was defined as follows: strong diffuse = high; weak limited (<60% of ductal cells) to weak diffuse = low/absent. Cytoplasmic HuR IHC scoring was performed by three authors (G.A.M., A.J. and J.M.F.), independently and blindly on ductal cells using the same scaling as total HuR IHC scoring. Scores were averaged and then plotted.
Cell lines
HPNE, MIA PaCa-2, PANC-1, PANC-1-Luc2 and Hs766T cells were obtained from ATCC (Manassas, VA). Conditionally reprogramed PDAC cells (4671-T-CRC) were a gift from Dr. Rosalie Sears from Oregon Health & Science University (OHSU). CRC cells were cultured in 3:1 DMEM:F12 medium supplemented with 5% FBS, 0.4 μg/ml hydrocortisone, 5 μg/ml insulin, 8.4 ng/ml cholera toxin, 10 ng/ml EGF, 24 μg/ml adenine, 0.25 μg/ml amphotericin B, 1× primocin and 1× ROCK inhibitor. All other cell lines were cultured in DMEM medium supplemented with 10% FBS, 1% l-glutamine and 1% penicillin–streptomycin. All cells were incubated at 37°C and 5% CO2, as recommended. Cells were authenticated via short tandem repeat analysis and mycoplasma tested monthly, using PCR-based mycoplasma detection kit (# MP0035, Sigma–Aldrich, St Louis, MO). STR profiling for human cell line authentication was performed in the OHSU DNA Services Core; this work utilized a 3730xl DNA Analyzer purchased with funding from NIH SIG grant S10 OD010609. Cells were passaged twice after thawing before experimental use.
MIA PaCa-2 cells were transduced with viral particles carrying the firefly luciferase gene and supplemented with 1 μg/ml polybrene (# TR-1003-G, Sigma–Aldrich, St Louis, MO). Viral particles were generously provided by Drs Scott Waldman and Adam Snook from Thomas Jefferson University. Cells containing firefly luciferase were selected by puromycin (# P8833, Sigma–Aldrich, St Louis, MO) and validated for luciferase activity using ONE-Glo Luciferase Assay System (# E6110, Promega, Madison, WI). Validated cell lines are denoted as MIA PaCa-2-Luc.
Conditioned medium preparation
MIA PaCa-2-Luc and PANC-1-Luc2 cells were plated at 0.5 × 10⁶ per six-well dish in 2 ml of DMEM supplemented with 10% FBS, 1% l-glutamine and 1% penicillin–streptomycin. The next day, cells were washed twice with 1× phosphate-buffered saline (PBS), and 1 ml of non-supplemented DMEM was added to the cells. After 48 h, conditioned medium was collected and then spun down at 1500 × g for 10 min to remove debris.
Cytokine array
After conditioned medium was collected, a maximum of 500 μl was incubated on Human XL Cytokine Arrays (# ARY022B, R&D Systems, Minneapolis, MN). Volumes were normalized to cell number at time of collection. Cytokine arrays were processed according to manufacturer’s instructions. Signal was measured using LI-COR Image Studio Lite software. Signals <1000 pixels were excluded from analysis.
Immunoblot analysis
Protein was extracted from cells via ice-cold RIPA buffer (# sc-24948A, Santa Cruz Biotechnology Inc., Dallas, TX) supplemented with fresh protease inhibitors (# 78430, Life Technologies Corporation, Carlsbad, CA). Nuclear and cytoplasmic fractions were extracted using NE-PER Nuclear and Cytoplasmic Extraction Kit (# 78833, Thermo Fisher Scientific, Waltham, MA) according to manufacturer’s instructions. Lysates were immunoblotted and membranes were scanned using ChemiDoc Imaging System (# 17001402, Bio-Rad, Hercules, CA). Immunoblots were blocked with Intercept® (TBS) Blocking Buffer (# 927-60003, LI-COR Biosciences, Lincoln, NE), and all antibodies were diluted in this buffer. Primary antibodies used were HuR (1:1000, # sc-5261, Santa Cruz Biotechnology Inc., Dallas, TX), lamin A/C (1:1000, # 2032S, Cell Signaling, Danvers, MA), α-tubulin (1:5000, # A11126, Invitrogen, Waltham, MA) and β-actin (1:5000, # AM4302, Thermo Fisher Scientific, Waltham, MA), followed by Thermo Fisher Scientific Alexa secondary antibodies.
For conditioned media immunoblots, conditioned media from six-well plates were collected, spun, filtered and then concentrated using Ultra-0.5 Centrifugal Filter Units (# UFC500396, Millipore Sigma, Burlington, MA). Cells remaining on the six-well plates were counted and protein was extracted for whole cell lysates via ice-cold RIPA buffer (# sc-24948A, Santa Cruz Biotechnology Inc., Dallas, TX) supplemented with fresh protease inhibitors (# 78430, Life Technologies Corporation, Carlsbad, CA). Whole cell lysates and conditioned media were immunoblotted. Volumes of samples were normalized to cell number at time of collection. Membranes were stained with Ponceau (# 59803S, Cell Signaling, Danvers, MA) for total protein detection and scanned using iBright Imaging System (Thermo Fisher Scientific, Waltham, MA). Immunoblots were blocked with Intercept® (TBS) Blocking Buffer (# 927-60003, LI-COR Biosciences, Lincoln, NE), and all antibodies were diluted in this buffer. Primary antibodies used were collagen-1 (1:250, # PA1-26204, Thermo Fisher Scientific, Waltham, MA), pentraxin 3 (PTX3, 1:250, # HM2242, Hycult Biotech, Uden, The Netherlands) and platelet-derived growth factor AA (PDGFAA, 1:500, # MAB2211, R&D Systems, Minneapolis, MN), followed by Thermo Fisher Scientific Alexa secondary antibodies.
Small interfering RNA for transient knockdown
MIA PaCa-2-Luc and PANC-1-Luc2 cells were transfected with either ON-TARGET plus Non-targeting Control siRNA (# D-001810-01-05, GE Dharmacon, Lafayette, CO) or custom-made HuR siRNA. Custom siHuR sequence is as follows: siHuR2, 5′-AAACCAUUAAGGUGUCGUAUGUUUU-3′. Transfections were performed with 30 nM of oligonucleotides and Lipofectamine RNAiMAX (# 13778150, Thermo Fisher Scientific, Waltham, MA) according to manufacturer’s instructions.
RT-qPCR and mRNA expression analysis
RNA was extracted using RNeasy Mini Kit (# 74106, Qiagen, Germantown, MD). RNA concentrations and quality were assessed by NanoDrop spectrophotometer (Thermo Fisher Scientific, Waltham, MA). Complementary DNA (cDNA) was made from 1000 ng RNA using High Capacity cDNA Reverse Transcriptase Kit (# 4368813, Thermo Fisher Scientific, Waltham, MA). Relative quantifications were assessed using the 2–ΔΔCt method, using 18S for normalization.
RNA sequencing
RNA was isolated from flash-frozen tumors or fresh cell lines using RNeasy Mini Kit (# 74106, Qiagen, Germantown, MD). RNA concentrations and quality were assessed by NanoDrop spectrophotometer (Thermo Fisher Scientific, Waltham, MA). Preparation of RNA library and transcriptome sequencing were conducted by Novogene Co., Ltd (Sacramento, CA) using the HiSeq Illumina platform.
Actinomycin D assessment of RNA stability
MIA PaCa-2-Luc and PANC-1-Luc2 cells were transfected with either siControl or siHuR2. Twenty-four hours later, cells were treated with actinomycin D (5 μg/ml) and RNA was isolated at indicated time points. Relative quantifications were assessed using the 2–ΔCt method, normalizing to time = 0. PDGFA mRNA half-lives were calculated from decay curves by linear regression (50).
Ribonucleoprotein immunoprecipitation assay
MIA PaCa-2-Luc and PANC-1-Luc2 cells were washed with 1× PBS, harvested using CellStripper Dissociation Reagent (# MT25056CI, Fisher Scientific, Waltham, MA) and fractionated using NE-PER Nuclear and Cytoplasmic Extraction Kit (# 78833, Thermo Fisher Scientific, Waltham, MA) according to manufacturer’s instructions. Cytoplasmic lysates were subjected to immunoprecipitation using 30 μg of either anti-HuR antibody (# RN007M, MBL International, Woburn, MA) or anti-IgG control (# 2729S, Cell Signaling, Danvers, MA) as previously reported (32,51,52). RNA was isolated from immunoprecipitation and analyzed via RT-qPCR analysis.
Animal studies
Animal protocol # IP00003322 was approved by Institutional Animal Care Regulations and Use Committee of OHSU. This protocol is specifically applicable to the experiments reported in this manuscript.
NOD-Rag1−/−IL2RgammaCnull (NRG) mice were generously provided by Drs Scott Waldman and Adam Snook from Thomas Jefferson University. Athymic nude (nude) mice were purchased from Envigo (# 069, Envigo, Indianapolis, IN). Tumor engraftment success rates were taken into consideration when determining the lowest possible number of animals required to reach statistical significance. Experimental sizes were refined as the study continued. Studies performed in NRG mice used 5 mice per experimental arm, while studies in nude mice used 10 mice per experimental arm with the exception of GEM treatment experiment that used 5 mice per experimental arm. Six-to-nine-week-old mice of mixed sex were randomized into experimental arms, where HuR WT tumors were used as the control group. During experimental use, mice were exposed to 3% isoflurane for anesthesia purposes. All downstream analyses were blinded during data processing.
A maximum of five mice per cage were housed at 70°F and 30–70% humidity. Mice from different experimental arms were housed separately. Light cycle was kept at 12 h on and 12 h off. Bedding and PicoLab Mouse Diet 20 (5058) were replaced every 2–3 weeks. Mice had access to water via an automatic watering system.
Orthotopic xenograft PDAC mouse model
Using orthotopic survival surgery, 1 × 10⁶ MIA PaCa2-Luc or PANC-1-Luc2 cells were injected directly into the tail of the pancreas of 6–9-week-old NRG or nude mice (mixed male and female). Injection of cells was 50 μl in 1:1 cold PBS:cold Matrigel. After injection, needle was exchanged with a cotton swab to eliminate leakage of cells. The peritoneum was closed using absorbable Vicryl Rapide sutures (# VR834, McKesson, Irving, TX), and the skin was closed using wound clips (# 12022-09, Fine Science Tools, Foster City, CA). The researcher performing the procedure was blinded to which cells were being injected. After surgery, mice were injected with 0.1 mg/kg buprenorphine and monitored daily for a week for any signs of stress.
To monitor tumor volume, mice were injected subcutaneously behind the neck with 100 μl of d-luciferin (15 mg/ml, # LUCK, Gold Biotechnology, St Louis, MO). The bioluminescent signal was assessed with In Vivo Imaging System (Perkin Elmer, Waltham, MA). Tumor volumes were calculated as follows: volume = (length × width2)/2.
Mouse drug treatments
Two weeks after orthotopic injection of PDAC-1-Luc2 cells, mice were randomized into treatment groups and treated with either saline (0.9% NaCl) or 50 mg/kg GEM (# 50-149-2282, Fisher Scientific, Waltham, MA) (53). Randomized groups were checked for even distribution of sex and nonstatistically different tumor volumes prior to treatment. Mice were treated twice a week for the remainder of the study. Mouse weights and tumors were measured twice a week. Tumors were monitored based on luciferase activity as reported above.
Fluorescent immunohistochemistry detection of tumors
Tumors were fixed in 4% paraformaldehyde (# NC9288315, Fisher Scientific, Waltham, MA) overnight and then transferred to 70% EtOH. Tissue blocks and slides were made by the Histopathology Shared Resource Core at OHSU. Tissue sections of each tumor were deparaffinized and rehydrated prior to antigen retrieval (# H-3300-250, Vector Laboratories, Burlingame, CA). Tissues were blocked with 5% BSA and 2% NGS in TBS-T for 1 h and then stained with primary antibody in blocking solution overnight at 4°C. Primary antibodies used were podoplanin (1:250, # MA5-16113, Thermo Fisher Scientific, Waltham, MA), Ki67 (1:400, # 9449S, Cell Signaling, Danvers, MA) and phospho-histone H2A.X (1:1000, # 9718S, Cell Signaling, Danvers, MA). After washing slides in TBS-T, tissues were incubated in goat anti-mouse Alexa-555 (# ab150114, Abcam, Waltham, MA), anti-rabbit Alexa-488 (# ab150077, Abcam, Waltham, MA) or anti-Syrian hamster Alexa-647 (# A21451, Thermo Fisher Scientific, Waltham, MA) secondary antibody diluted 1:500 in PBS for 1 h. After washing tissues in PBS, autofluorescence was quenched with the TrueVIEW reagent (# SP-8400, Vector Laboratories, Burlingame, CA). Tissues were then stained with DAPI and mounted with Vectashield mounting medium provided in the TrueVIEW quenching kit. Methods were adapted from (54,55).
Slides were scanned by the Advanced Light Microscopy Core at OHSU. ZEN Digital Imaging for Light Microscopy (RRID:SCR_013672) was then used to obtain at least five 10× images per tissue. ImageJ software was used to either quantify the percent fluorescent staining or count the number of positive cells for each section (56). Podoplanin staining was quantified by converting 10× images to 8-bit color, applying a standard threshold and measuring the percent area covered by the staining. Nuclear staining (i.e. Ki67, phospho-histone H2A.X) was quantified by splitting the channels of 10× images, applying a standard threshold on the corresponding colored image and counting the number of particles >200 pixel2. Watershed was used to separate cells. Nuclear staining counts were normalized to DAPI staining counts.
Immunohistochemistry detection of tumors
Tumors were fixed in 4% paraformaldehyde (# NC9288315, Fisher Scientific, Waltham, MA) overnight and then transferred to 70% EtOH. Tissue blocks and slides were made and stained by the Histopathology Shared Resource Core at OHSU for trichrome, HuR (1:300, # sc-5261, Santa Cruz Biotechnology Inc., Dallas, TX), αSMA (1:1500, # 14395-I-AP, Thermo Fisher Scientific, Waltham, MA), desmin (1:100, # PA5-16705, Thermo Fisher Scientific, Waltham, MA) or Ki67 (1:400, # 9449S, Cell Signaling, Danvers, MA).
Slides were scanned by the Advanced Light Microscopy Core at OHSU. ZEN Digital Imaging for Light Microscopy (RRID:SCR_013672) was then used to obtain at least five 10× images per tissue. ImageJ software was used to quantify the percent staining for each section (56). All staining was quantified by running color deconvolution on 10× images, applying a standard threshold on the corresponding colored images and measuring the percent area covered by the staining. For trichrome staining, Alcian blue and H color deconvolution was used, while H-DAB color deconvolution was used on all other staining.
Magnetic resonance imaging
Magnetic resonance imaging (MRI) was performed at 11.7 T on a Bruker imaging system (Biospin, Karlsruhe, Germany). Animals were anesthetized during imaging with 2–2.5% inhaled isoflurane and monitored during imaging with respiratory monitoring. Imaging protocols included a triplane localizer, axial 2D rapid imaging with refocused echoes (RARE) multi-echo T2-weighted imaging and 2D T2*-weighted axial images. The images were acquired prior to and following intravenous injection of magnetic nanoparticles (7 mg/kg Fe, ferumoxytol, Feraheme®, AMAG Pharma, Waltham, MA). Multi-echo spin echo T2 maps were acquired with the following parameters: flip angle = 90°; matrix size = 192 × 192; TR = 2000 ms; TE = 3 equally spaced echoes at 9 ms intervals ranging from 9 to 27 ms; field of view (FOV) = 3.21 cm × 3.21 cm; and slice thickness = 1 mm. A single-echo gradient echo T2*-weighted axial sequence was acquired with the following parameters: flip angle = 40°; matrix size = 192 × 128; TR = 300 ms; TE = 1.65; FOV = 3.85 × 4.97 cm; and slice thickness = 1 mm.
MRI data analysis
All data were analyzed in Horos (The Horos Project) using code written in-house. Vascular volume fraction (VVF) was obtained by defining a region of interest (ROI) over the entire tumor area as previously described (57–61). This process was repeated for three central slices of the tumor for every animal, and the mean value within the ROI was calculated. T2 relaxation values were obtained using the RARE multi-echo data by plotting mean ROI value at each echo, and calculating the best-fit exponential decay function. R2 was defined as the inverse of the T2 values; ΔR2 was calculated as the ratio of values before and after iron contrast injection. VVF of the tumor was derived from the relationship of ΔR2 changes in the tumor and muscle, using the muscle values to calibrate the values assuming the VVF of muscle is a constant of 3%.
Statistical analysis
Student’s two-sample t-tests were performed using GraphPad Prism software (San Diego, CA) for all analyses, unless otherwise indicated. Results are expressed as mean ± standard error of mean.
RESULTS
HuR is highly expressed in PDAC
We have previously established that high cytoplasmic levels of HuR are present in human PDAC tumor cells compared to normal pancreas cells, as detected by immunohistochemistry in patient TMAs (43,62). In separate TMAs created at OHSU (Portland, OR), ∼50% of tumors from patients with PDAC showed high expression of both total and cytoplasmic HuR, which was only found in 8–10% of normal pancreas tissue (Supplementary Figure S1A and B, and Supplementary Table S1). In a panel of human PDAC cell lines, cytoplasmic HuR expression is significantly increased in comparison to the immortalized normal pancreatic ductal cell line HPNE (Supplementary Figure S1C). Moreover, we demonstrate that elevated cytoplasmic HuR expression is maintained in an orthotopic xenograft mouse model of PDAC using human MIA PaCa-2-Luc PDAC cells in tumor tissue versus adjacent normal pancreas (Supplementary Figure S1D). These data recapitulate and further support our evidence that cytoplasmic localization and high expression of HuR is linked to PDAC in multiple models and in patient samples, confirming that HuR plays a role in post-transcriptionally regulating PDAC cell survival and tumorigenesis.
Loss of HuR in PDAC cells does not impact tumor size or proliferation in an orthotopic xenograft model
Previous reports have shown that overexpressing HuR in cooperation with mutant KRASG12D increased the incidence rate of PDAC in a genetically engineered mouse model (43). In subcutaneous xenograft models, overexpression of HuR increased tumor growth (45), whereas loss of HuR in PDAC cells resulted in either significantly delayed tumor growth or subcutaneous xenograft lethality (33,49,63–65). With evidence that HuR is elevated in human PDAC, we sought to investigate how deletion of HuR from PDAC cells would impact tumor growth and proliferation in a more accurate milieu (i.e. the pancreas). Thus, we utilized an orthotopic xenograft model of PDAC (66). We generated human PDAC cell lines [MIA PaCa-2-Luc (MIA) and PANC-1-Luc2 (PANC-1) cells] with either HuR wild type (HuR WT) or CRISPR-mediated HuR knockout (HuR KO), and validated for loss of HuR at the DNA, RNA and protein levels (Supplementary Figure S2A–C) (63). These cells were injected into the tail of the pancreas, and the generated tumors were validated for loss of HuR via immunohistochemistry (Supplementary Figure S2D).
First, we orthotopically injected MIA cells in NRG mice, which are devoid of all functioning immune cells, to ensure maximum take rate (see a description of models in Supplementary Table S2). In this model, loss of HuR did not significantly impact tumor volume or take rate compared to the WT control arm (Figure 1A and D). This observation was recapitulated in an athymic (nude) mouse background for both MIA (Figure 1B and E) and two genetically different PANC-1 HuR KO clones (Figure 1C and F). Moreover, the percentage of proliferating (i.e. Ki67+) cells as observed by IHC did not significantly differ between HuR WT or HuR KO tumors (Figure 1G–I). Together, these data show that in an orthotopic xenograft model of human PDAC, tumor growth and proliferation is not significantly altered in HuR KO conditions in comparison to HuR WT tumors.
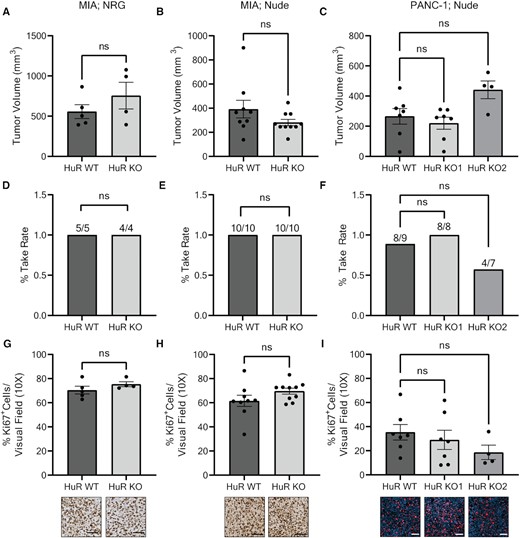
Loss of HuR in PDAC cells does not impact tumor size or proliferation in an orthotopic xenograft model. Tumor volumes of (A) MIA tumors in NRG mice, (B) MIA tumors in nude mice and (C) PANC-1 tumors in nude mice. Each data point represents a separate tumor. Tumor take rate of (D) MIA tumors in NRG mice, (E) MIA tumors in nude mice and (F) PANC-1 tumors in nude mice. Quantification of % Ki67+ cells per visual field imaged at 10× for (G) MIA tumors in NRG mice, (H) MIA tumors in nude mice and (I) PANC-1 tumors in nude mice. Each data point represents the average of at least five images per tumor stained for Ki67. Representative images are found below the corresponding bar graph. Statistical analysis was performed using a Student’s two-sample t-test for all panels, except panels (C), (F) and (I) that were performed using one-way ANOVA. Error bars represent standard error of the mean. ns, not significant. Scale bars represent 50 μm.
Additionally, we created a model in which multiple HuR KO PANC-1 cells were mixed with HuR WT PANC-1 cells. HuR KO cells were created using several guide sequences that resulted in various CRISPR-mediated genetic alterations. The mix of these genetically different HuR KO cells with HuR WT cells resulted in a cell line referred to as ‘Pooled’. The Pooled cell line has an intermediate amount of HuR RNA and protein expression (∼25%) when compared to HuR WT (100%) and HuR KO clones (0%) (Supplementary Figure S2B and C). In this model, there was no significant difference in tumor volume, take rate or percent of Ki67+ cells when comparing Pooled tumors to pure HuR WT tumors (Supplementary Figure S3).
Loss of HuR in vivo results in decreased collagen deposition, independent of tumor cell collagen secretion
Since the bulk of pancreatic tumors are characterized by a dense, fibrotic TME (67,68), and high levels of ECM deposition, 90% of which is collagen (67), we performed trichrome staining to assess collagen deposition in our models. We found that MIA HuR KO tumors had significantly less collagen deposition compared to MIA HuR WT tumors when developed in NRG mice (72.5% decrease, P = 0.0166; Figure 2A). This loss of collagen in HuR KO tumors compared to HuR WT tumors was recapitulated in nude mice for both MIA (55.9% decrease, P = 0.0004; Figure 2B) and the two genetically different PANC-1 clones (HuR KO clone 1: 25.8% decrease, P = 0.0220; HuR KO clone 2: 49% decrease, P = 0.0002; Figure 2C).
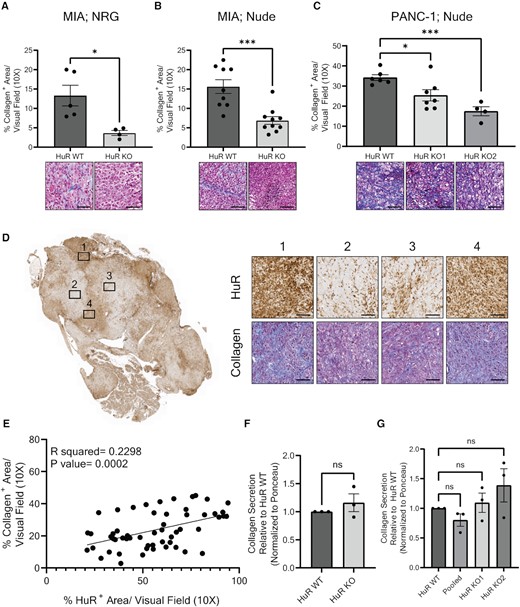
Loss of HuR results in decreased collagen deposition, independent of tumor cell collagen secretion. (A–C) Quantification of % collagen+ area per visual field imaged at 10×. Each data point represents the average of at least five images per tumor stained for collagen via trichrome. Representative images are found below the corresponding bar graph. Tumors analyzed were from the orthotopic model of (A) MIA cells injected in NRG mice, (B) MIA cells injected in nude mice or (C) PANC-1 cells injected in nude mice. Statistical analysis was performed using a Student’s two-sample t-test for panels (A) and (B), and one-way ANOVA for panel (C). (D) Representative whole tumor image of PANC-1 Pooled tumors stained for HuR expression. Subset images to the right show HuR and collagen expression of the same area, imaged at 10×. (E) Quantification of % collagen+ area and % HuR+ area in the same visual field imaged at 10× of PANC-1 Pooled tumors (n = 8) in nude mice. Statistical analysis was performed using Pearson’s correlation. (F) Quantification of collagen secreted from MIA PaCa-2 HuR WT and HuR KO cells in vitro. Statistical analysis was performed using a Student’s two-sample t-test. (G) Quantification of collagen secreted from PANC-1 HuR WT, Pooled and HuR KO cells in vitro. Statistical analysis was performed using a one-way ANOVA. Collagen quantification is normalized to Ponceau stain and relative to HuR WT collagen secretion. Error bars represent standard error of the mean. ****P < 0.0001, ***P < 0.001, **P < 0.01 and *P < 0.05; ns, not significant. Scale bars represent 50 μm.
Tumors generated from the PANC-1 Pooled model had distinct areas where the HuR expression strongly correlated with the amount of collagen deposition (i.e. high HuR with high collagen and low/absent HuR with low collagen, P = 0.0002; Figure 2D and E). These data convincingly and consistently demonstrate that HuR expression positively and significantly correlates with the amount of collagen in a tumor, and that PDAC cell-intrinsic HuR KO results in a decrease of collagen deposition in multiple mouse models. This strongly suggests that HuR regulates collagen deposition in PDAC.
HuR influences the strong stromal phenotype of PDAC tumors in vivo
Collagen is found in the dense, fibrotic patient PDAC tumors, yet only a small amount comes from tumor cells (67), and the majority is deposited by activated stromal cells, specifically CAFs [particularly myofibrotic CAFs (myCAFs)] (69) and PSCs (6–8,10,70). To determine whether the decrease of collagen in HuR KO tumors results from decreased PDAC cell collagen production, conditioned medium was collected from HuR WT and HuR KO cell cultures in vitro. We found no significant changes in collagen secretion between HuR WT and HuR KO cells in MIA and PANC-1 cell lines (Figure 2F and G, and Supplementary Figure S4), and that the amount of collagen secreted by PDAC cells depended on the number of cells present (Supplementary Figure S4). This suggests that other cell types are responsible for this phenotype; therefore, we investigated the impact of HuR on CAF and PSC presence in the PDAC TME.
We found that MIA HuR KO tumors in both the NRG and nude mouse backgrounds had a significant decrease in CAFs (podoplanin: NRG, 75.7% decrease, P = 0.0486; nude, 53.6% decrease, P = 0.0311), myCAFs [α-smooth muscle actin (αSMA): NRG, 64.6% decrease, P = 0.0349; nude, 59.7% decrease, P < 0.0001] and PSCs (desmin: NRG, 51% decrease, P = 0.0428; nude, 55.9% decrease, P = 0.0260) when compared to MIA HuR WT tumors (Figure 3A and B, and summarized in Supplementary Table S2). Similarly, PANC-1 HuR KO tumors in nude mice showed a decrease in CAFs (podoplanin: HuR KO clone 1, 74.8% decrease, P = 0.0247; HuR KO clone 2, 58.5% decrease, P = 0.1168), myCAFs (αSMA: HuR KO clone 1, 37.1% decrease, P = 0.0276; HuR KO clone 2, 68.5% decrease, P = 0.0047) and PSCs (desmin: HuR KO clone 1, 43.1% decrease, P = 0.1240; HuR KO clone 2, 61.9% decrease, P = 0.0911; Figure 3C).

HuR influences the stromal cell presence and abundance in PDAC tumors. Quantification of % podoplanin+, % αSMA+ and % desmin+ area per visual field imaged at 10× of (A) MIA cells orthotopically injected in NRG mice, (B) MIA cells orthotopically injected in nude mice and (C) PANC-1 cells injected in nude mice. Each data point represents the average of at least five images per tumor. Representative images are found below the corresponding bar graph. Statistical analysis was performed using a Student’s two-sample t-test for panels (A) and (B), and one-way ANOVA for panel (C). (D) Quantification of % HuR+ area and % podoplanin+, % αSMA+ or % desmin+ in the same visual field imaged at 10× of PANC-1 Pooled tumors (n = 8) in nude mice. Statistical analysis was performed using Pearson’s correlation. Error bars represent standard error of the mean. ****P < 0.0001, ***P < 0.001, **P < 0.01 and *P < 0.05; ns, not significant. Scale bars represent 50 μm.
Additionally, in the Pooled tumor model, we found that areas with high HuR expression also had high expression and significant positive correlation with these stromal markers (podoplanin: P < 0.0001; αSMA: P < 0.0001; desmin: P < 0.0001; Figure 3D). Taken together, our data suggest that tumor-intrinsic HuR influences the stromal cell presence and abundance in PDAC tumors.
RNA sequencing identifies decreased cell–cell communication with loss of HuR
In an effort to agnostically decipher the mechanism by which HuR impacts stromal cells and collagen abundance, we performed RNA sequencing on MIA HuR WT and HuR KO tumors, in vivo. Reactome analysis of RNA-sequencing data identified cell–cell communication as the top downregulated pathway in HuR KO tumors, suggesting that loss of HuR in tumors impairs cellular crosstalk (Figure 4A). GO pathway analysis also identified several cell adhesion pathways to be downregulated with loss of HuR, while upregulated pathways for Reactome and GO analysis involved processes in transcription and translation (Supplementary Figure S5).
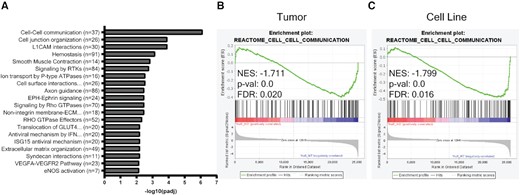
RNA sequencing identifies decreased cell–cell communication with loss of HuR. (A) Top significantly downregulated Reactome pathways in MIA HuR KO tumors compared to HuR WT tumors. Gene set enrichment analysis of cell–cell communication Reactome pathway from RNA-sequencing data collected from (B) MIA HuR WT and HuR KO orthotopic tumors in NRG mice and (C) MIA HuR WT and HuR KO cell lines.
Communication between tumor and stromal cells is bidirectional (67,71–73). Therefore, it is possible that the lack of stromal cells detected in HuR KO tumors could contribute to a loss in cell–cell communication. Thus, we sought to determine whether the decreased cell–cell communication in HuR KO tumors identified by RNA sequencing is due to intrinsic HuR function within tumor cells, rather than simply HuR KO tumors having less stromal cells. To address this, gene set enrichment analysis for the cell–cell communication Reactome pathway was performed on RNA-sequencing data from both in vitro cell lines and in vivo tumors. The cell–cell communication Reactome pathway was significantly de-enriched in the HuR KO setting in comparison to the HuR WT setting for both in vivo tumors (NES = −1.711, P = 0.0; Figure 4B) and in vitro cell lines (NES = −1.799, P = 0.0; Figure 4C). The list of genes in the cell–cell communication Reactome pathway significantly decreased in HuR KO in vitro cells and in vivo tumors can be found in Supplementary Table S3. These data suggest that the cell–cell communication pathway was altered likely as a direct loss of HuR in tumor cells, opposed to the altered TME, further suggesting that HuR is regulating transcripts vital for PDAC cells to communicate with other cells.
Loss of HuR impairs secretion of proteins involved in ECM organization, stromal activation, angiogenesis and inflammation
PDAC cells, through paracrine crosstalk, possess the ability to activate CAFs and PSCs to secrete collagen (69,70,74). Knowing that HuR KO PDAC cells, both in vitro and in vivo, resulted in decreased cell–cell communication, we next investigated how HuR affects secreted signaling molecules from PDAC cells. Conditioned medium was collected from MIA HuR WT or HuR KO cells and probed on a cytokine array (Figure 5A).
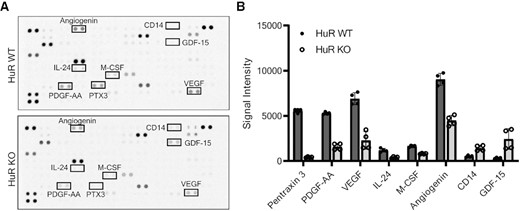
Loss of HuR impairs secretion of proteins involved in ECM organization, stromal activation, angiogenesis and inflammation. (A) Proteome Profiler Human XL cytokine arrays incubated with MIA HuR WT or HuR KO conditioned media. (B) Quantification of signal intensity measured from n = 2 arrays with two technical replicates per condition. Analytes that had either a 50% decrease or increase in secretion from HuR KO cells relative to HuR WT cells are shown in order of fold change. These analytes are identified on the cytokine array in panel (A). Error bars represent standard error of the mean.
Assessment of the top dysregulated secreted proteins showed that loss of HuR impacted secretion of proteins associated with ECM organization, stromal activation, angiogenesis and inflammation (Supplementary Table S4). The top downregulated secreted protein was PTX3, for which loss of HuR resulted in a 92.3% decrease in secretion compared to HuR WT (Figure 5B and Supplementary Table S4). Under acidic pH, seen commonly in the hypoxic PDAC TME, PTX3 is critical for ECM organization through binding and stabilizing many ECM proteins (75,76). The second most impacted secreted signaling molecule in the cytokine array was homodimer PDGFAA, a chemoattractant for CAFs and activator of PSCs (77–79), with a 68.6% decrease in HuR KO as compared to HuR WT (Figure 5B and Supplementary Table S4). Quantification of all analytes on the cytokine arrays can be found in Supplementary Table S5.
To validate the cytokine array findings, conditioned media from MIA HuR WT and HuR KO cells were evaluated via immunoblot analysis. HuR WT cells were capable of secreting both PTX3 and PDGFAA in a cell number-dependent manner, while HuR KO cells were not (P < 0.0001; Figure 6A and B).
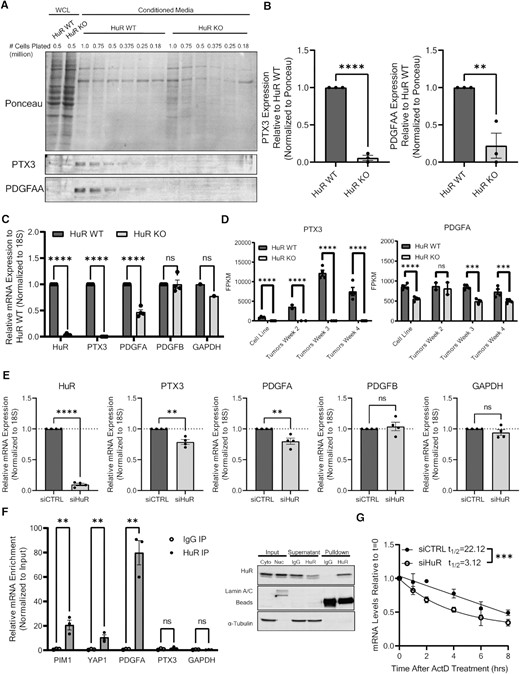
HuR regulates RNA abundance and secretion of PTX3 and PDGFA. (A) Representative immunoblot analysis of PTX3 and PDGFAA from whole cell lysates (WCL) and conditioned media from MIA cells. (B) Quantification of PTX3 and PDGFAA secreted from MIA HuR WT and HuR KO cells shown in panel (A). PTX3 and PDGFAA quantification is normalized to Ponceau stain and relative to HuR WT samples. Statistical analysis was performed using a Student’s two-sample t-test. (C) RT-qPCR analysis of mRNA in MIA HuR WT and HuR KO cells. mRNA expression was determined using 18S rRNA as a loading control and normalized to HuR WT expression. Statistical analysis was performed using a Student’s two-sample t-test. (D) FPKM counts of PTX3 and PDGFA RNA from RNA sequencing performed on MIA HuR WT and HuR KO cell lines, in addition to orthotopic tumors formed from these cells 2, 3 and 4 weeks post-injection into NRG mice. (E) RT-qPCR analysis of mRNA in MIA cells transfected with either siControl or siHuR. Statistical analysis was performed using a Student’s two-sample t-test. (F) Ribonucleoprotein immunoprecipitation (RIP) analysis of PTX3 and PDGFA mRNA pulldown with HuR in comparison to known HuR targets. Statistical analysis was performed using multiple paired t-test. Representative immunoblot validation of HuR pulldown in MIA cells found to the right of the graph. (G) MIA cells were transfected with either siControl or siHuR and treated with actinomycin D. PDGFA mRNA levels were assessed at indicated time by RT-qPCR. Statistical analysis was performed using comparison of decay curves by linear regression. Error bars represent standard error of the mean. ****P < 0.0001, ***P < 0.001, **P < 0.01 and *P < 0.05; ns, not significant.
Since HuR as an RNA-binding protein regulates targets at the RNA level, we set to determine the impact of HuR loss on PTX3 and PDGFA mRNA transcripts. In MIA HuR KO cells, we detected a significant decrease in PTX3 and PDGFA mRNAs, as compared to MIA HuR WT cells (P < 0.0001 and P = 0.0097, respectively), but not in the controls platelet-derived growth factor B (PDGFB) or GAPDH (Figure 6C). Importantly, the decrease of PTX3 and PDGFA mRNAs was confirmed in the analysis of RNA-sequencing data from both MIA HuR WT and HuR KO in vitro cell lines and in vivo orthotopic tumors at multiple time points through tumor growth (Figure 6D). To assess whether acute (i.e. siRNA) versus chronic (i.e. CRISPR-mediated KO) loss of HuR impacts the RNA abundance of PTX3 and PDGFA transcripts, MIA and PANC-1 PDAC cells were transiently transfected with either siControl or siHuR, and RNA levels were assessed 72 h post-transfection. Loss of HuR via siHuR resulted in significant decrease of PTX3 and PDGFA mRNA levels, while not altering the controls PDGFB or GAPDH, in both MIA and PANC-1 cells (Figure 6E and Supplementary Figure S6A, respectively).
With evidence that loss of HuR resulted in decreased mRNA abundance of PTX3 and PDGFA, we sought to determine whether HuR directly regulates these transcripts. We had previously performed a RIP array in MIA cells with HuR (80), under two different established HuR stressors, GEM (32) and olaparib [OLA (81)]. HuR was then pulled down via immunoprecipitation, and the bound RNA was sequenced. Analyzing this data set, we found that PDGFA pulled down with a fold change over IgG (GEM: 92.7; OLA: 116.39) greater than the previously established targets PIM1 (31) (GEM: 13.25; OLA: 14.42) and YAP1 (62) (GEM: 12.73; OLA: 13.83; Supplementary Figure S6B). The PTX3 mRNA transcript, however, did not significantly pull down with HuR (GEM: −1.90; OLA: −4.04). Similar trends were seen in vehicle (VEH)-treated cells [i.e. dimethyl sulfoxide (DMSO); PIM1: 17.43; YAP1: 17.77; PDGFA: 122.50; PTX3: −2.09]. These data suggest that HuR could be regulating these transcripts under normal conditions. To confirm these findings under normal conditions (i.e. no DMSO, GEM or OLA treatment), independent RIPs were performed with MIA cells (Figure 6F). HuR pulled down PDGFA with a fold change over IgG greater than PIM1 and YAP1 (PDGFA: 117.32; PIM1: 23.83; YAP1: 21.37), while PTX3 did not pull down (3.29). These results were replicated in PANC-1 cells (Supplementary Figure S6C). Therefore, HuR directly regulates PDGFA mRNA, with or without stress, while indirectly regulating PTX3 mRNA via another protein or signaling pathway.
HuR is known to directly regulate target transcripts by impacting RNA stability (82,83). To assess the impact of HuR on RNA stability of the PDGFA transcript, we performed actinomycin D assays (50). MIA and PANC-1 cells were transfected with either siControl or siHuR, and then 24 h later treated with actinomycin D to halt nascent transcription. RNA was collected every 2 h to assess the stability of PDGFA mRNA over time. We found that loss of HuR in MIA cells significantly decreased the half-life of PDGFA mRNA (P = 0.0004; Figure 6G). In PANC-1 cells, we saw a similar trend, although not reaching statistical significance (Supplementary Figure S6D). In sum, we identified PDGFA to be a novel HuR target, and given its role in stromal cell recruitment and activation, we postulate that the lack of collagen and stromal cells found in HuR KO tumors could be in part due to its regulation by HuR.
Loss of HuR sensitizes PDAC tumors to GEM treatment
Because PTX3, PDGFAA, stroma abundance and HuR have all been linked to poor treatment response, and seeing that these are all elements lost in HuR KO tumors, we next investigated how loss of HuR and the HuR-regulated TME would impact treatment efficacy.
GEM was the therapeutic of choice as stromal cells are known to cause resistance through direct (e.g. drug scavenging, regulation of nucleoside transporters, secretion of deoxycytidine) and indirect (e.g. collagen deposition) mechanisms (3,14,18,19,84–88). Additionally, we and others have previously shown that GEM engages with HuR biology (32,33). For the choice of model, we treated mice bearing either PANC-1 HuR WT or PANC-1 HuR KO clone 2 orthotopic tumors with GEM. PANC-1 cells were used for the model due to their slower tumor growth rate, providing the opportunity for long-term treatments. Moreover, HuR KO clone 2 cells were chosen as they showed the greatest decrease of collagen, αSMA and desmin staining (Figures 2C and 3C). Importantly, GEM was well tolerated in both HuR WT and HuR KO tumor-bearing mice, as indicated by no significant changes in body weights (Supplementary Figure S7A).
We found that while GEM treatment had no significant impact on HuR WT tumor volume, it significantly decreased the volume of HuR KO tumors in comparison to VEH treatment (P = 0.0436; Figure 7A). As a marker of GEM efficacy, γH2AX+ cells identifying DNA damage increased significantly and dramatically in HuR KO tumors treated with GEM in comparison to VEH (P < 0.0001; Figure 7B). There was no significant increase in γH2AX+ cells in HuR WT tumors treated with GEM. Additionally, there was no significant change of Ki67+ cells in HuR WT or HuR KO tumors treated with GEM, in comparison to VEH treatment (Supplementary Figure S7B). A significant decrease in collagen deposition and αSMA+ cells was maintained in HuR KO tumors when compared to HuR WT tumors within the same treatment group (Figure 7C and D). Podoplanin+ and desmin+ cells were significantly decreased when comparing HuR WT and HuR KO tumors in general (P = 0.0223 and P = 0.0071, respectively), but not significant within the same treatment group (Supplementary Figure S7C and D).
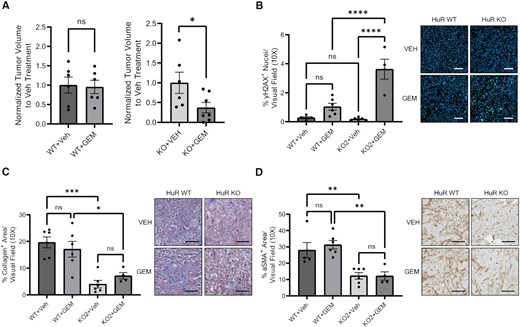
Loss of HuR sensitizes PDAC tumors to GEM treatments. (A) Tumor volumes of orthotopic PANC-1 HuR WT or HuR KO2 tumors from mice treated with either saline (VEH) or 50 mg/kg GEM twice a week. Tumor volumes are normalized to VEH treatment for each cell line. Statistical analysis was performed using a Student’s two-sample t-test. Quantification of (B) % γH2AX+ area, (C) % collagen+ area and (D) % αSMA+ area per visual field imaged at 10× of tumors from panel (A). Each data point represents the average of at least five images per tumor. Statistical analysis was performed using a one-way ANOVA. Error bars represent standard error of the mean. ****P < 0.0001, ***P < 0.001, **P < 0.01 and *P < 0.05, ns, not significant. Scale bars represent 50 μm.
Finally, we found no significant difference in RNA levels of GEM transporters or metabolizing enzymes between HuR WT and HuR KO cells in vitro, suggesting that HuR is not significantly impacting GEM import or metabolism in PDAC cells, although protein levels of these transporters and enzymes were not assessed (Supplementary Figure S8A and B). Moreover, in vitro sensitivity to GEM in MIA and PANC cells was not impacted by loss of HuR, further supporting the hypothesis that HuR does not impact PADC cell intrinsic sensitivity to GEM (Supplementary Figure S8C and D). We did observe a trend toward increased blood delivery to HuR KO tumors in comparison to HuR WT tumors, in vivo, suggesting HuR KO tumors may have increased delivery (Supplementary Figure S8E). Altogether, these data support our hypothesis that the increased efficacy of GEM seen in HuR KO tumors is likely due to the lack of stroma found in these tumors.
DISCUSSION
PDAC tumors are characterized by their dense stroma, including activated CAFs, PSCs and collagen abundance. This dense stroma is commonly associated with compromised drug delivery, resistance to cytotoxic therapies, hampered immune infiltration, tumor growth and tumor cell proliferation (2–4,6,11–17). PDAC cells are capable of recruiting and activating stromal cells through both direct contact and protein secretion. Among these secreted proteins are PTX3 and PDGFAA, both of which play a major role in ECM organization and stromal cell recruitment (75–79).
Herein, we found that genetically deleting ELAVL1 (HuR) from PDAC cells had no impact on orthotopic tumor growth or proliferation (Figure 1). This is in contrast to studies conducted in subcutaneous xenograft models where loss of HuR in PDAC cells resulted in either delayed tumor growth or xenograft lethality (33,49,63–65). It is likely that in the orthotopic model, where cells are injected into the same milieu, there is less stress and therefore less dependence on HuR as a stress response protein for survival and growth. This is supported by findings that in comparison to subcutaneous tumors, orthotopic tumors have lower levels of hypoxia and increased profusion, which can lead to higher nutrient delivery (89,90).
Independent of tumor growth, we found that loss of HuR in PDAC cells resulted in a decrease of collagen in in vivo tumors (Figure 2). This is a likely consequence of the decreased presence of CAFs (i.e. podoplanin+ and αSMA+ cells) and PSCs (i.e. desmin+ cells) that accompanied loss of tumor-intrinsic HuR (Figure 3). Supporting evidence for this hypothesis was seen in our previously published work, where overexpression of HuR in the pancreas resulted in an increase of vimentin+ and αSMA+ cells, markers of activated fibroblasts (43). Thus, we hypothesized that tumor-intrinsic HuR is, in part, responsible for activating the surrounding stroma to deposit collagen.
Contributing to this hypothesis, loss of HuR altered the transcriptome in that cell–cell communication Reactome pathway was impaired in HuR KO tumors in comparison to HuR WT tumors. This is a likely effect of tumor-intrinsic HuR, and not external factors in the PDAC TME, as we found the cell–cell communication Reactome pathway to be de-enriched in both in vivo tumors and in vitro cell lines (Figure 4). Of note, ECM organization was one of the top downregulated Reactome pathways, further confirming that tumor-intrinsic HuR impacts ECM in the PDAC TME (Figure 4A).
Because PDAC cells possess the ability to activate CAFs and PSCs to secrete collagen through paracrine crosstalk, we evaluated how loss of HuR would impact PDAC cell signaling molecule secretion. Only 34 out of the 104 assessed secreted proteins were impacted by loss of HuR (30 decreased, 4 increased). Because we did not see a global decrease in protein secretion with loss of HuR, it can be discerned that HuR impacts the secretion of certain signaling molecules rather than impacting global protein secretion, as predicted with the knowledge that HuR only regulates a subset of the transcriptome. Also, although HuR can inhibit the expression of mRNA transcripts, it is more commonly known for its positive regulation of transcripts, via mRNA stability or enhanced protein translation (82,83,91). This function of HuR is underscored in this cytokine array, as we see most of the impacted proteins to be decreased with loss of HuR.
We identified that HuR KO cells secrete less proteins involved in ECM organization and stromal activation, in particular PTX3 and PDGFAA (Figure 5). Further evaluation of these signaling molecules indicated that HuR directly binds PDGFA mRNA and is vital for its stability (Figure 6). To our knowledge, this is the first time that PDGFA has been reported to be a direct HuR target. Of note, the cytokine array showed that many of the proteins that were altered in secretion are involved with angiogenesis and inflammation. Future work will be directed in investigating these transcripts, and their impact on the PDAC TME.
Together, these data point to a novel function of HuR in PDAC tumorigenesis in regulating cell–cell communication. For the first time, we show that tumor cell-intrinsic HuR rewires the TME landscape. Due to the role of PTX3 in ECM organization, and PDGFAA being a potent chemoattractant for CAFs and activator of PSCs, we believe that the lack of stromal cells and collagen seen in HuR KO tumors compared to HuR WT tumors is the result of subsequent PTX3 and PDGFAA loss.
PTX3, PDGFAA, CAFs, PSCs, collagen deposition and HuR itself have all been linked to drug resistance, reduced drug delivery and poor response to treatment (2–4,6,11–17,31–34,92–94). Since there was a significant loss of all these factors in HuR KO PDAC cells and tumors, we sought to determine the efficacy of GEM treatment on HuR KO tumors (Figure 7). PANC-1 tumors treated with GEM showed significantly reduced tumor volume in HuR KO tumors, but not in HuR WT tumors. In this experiment, loss of stroma was maintained in HuR KO tumors, and GEM did not significantly impact tumor stromal composition. We identified a robust and significant increase of DNA damage in HuR KO tumors treated with GEM as marked by γH2AX+ nuclei, likely a direct result of GEM efficacy as it is a DNA damaging agent. This increase in γH2AX+ nuclei in response to GEM treatments was not seen in HuR WT tumors (Figure 7B). Our data suggest that the increased efficacy of GEM seen in HuR KO tumors is independent of the tumor cell-intrinsic impact of losing HuR, as we found no significant difference in GEM transporters, metabolizing enzymes or in vitro drug response between HuR WT and HuR KO cells (Supplementary Figure S8A–C). Moreover, utilizing MRI to assess the mean blood volume of tumors, we found that PANC-1 HuR KO tumors have a trend toward increased vascular volume (Supplementary Figure S8D). This suggests that HuR KO tumors may receive increased drug delivery, mirroring previous work in which treatment of a PDAC orthotopic model with angiotensin II receptor blocker to reduce desmoplasia resulted in high MRI-determined blood volumes and increased uptake of [18F]-5-fluorouracil (61).
To our knowledge, this is the first report of PDAC tumor-intrinsic HuR having an extrinsic effect on neighboring stromal cells. Since HuR is widely known across multiple tumor types to be pro-tumorigenic, our findings suggest that the stromal elements affected by HuR activity are pro-tumorigenic as well. Moreover, this work identified a novel mechanism of HuR biology in regulating cell–cell communication, in addition to defining PDGFA as a bona fide HuR target. Whether it be targeting HuR itself, a direct downstream cell–cell communication target such as PDGFAA or an indirect target such as PTX3, this axis of HuR biology could be exploited to improve standard-of-care chemotherapies like GEM.
DATA AVAILABILITY
The data supporting the conclusions of this manuscript have been submitted to NCBI Gene Expression Omnibus (GEO). RNA-sequencing data (raw BAM files and FPKM files) are available in GEO under the accession number GSE221250. RIP array files are available in GEO under the accession number GSE166951.
SUPPLEMENTARY DATA
Supplementary Data are available at NAR Cancer Online.
ACKNOWLEDGEMENTS
We thank Drs Scott Waldman and Adam Snook for providing luciferase lentiviral particles and protocols for the creation of our MIA PaCa-2-Luc cells. We are grateful for the technical help and support from the Histopathology Shared Resource and Advanced Light Microscopy Shared Resource at OHSU. Clinical specimens were provided by the Oregon Pancreas Tissue Registry (IRB study # 3609).
Author contributions: G.A.M. and J.R.B. conceived the study and determined the overall direction with input from R.D. G.A.M. designed and performed experiments, derived and validated orthotopic xenograft models with help of A.J., analyzed data and wrote the manuscript with input from all authors. All animal experiments were performed by G.A.M., with assistance by R.D., J.M.F. and Y.G. TMAs were made by T.A.W., D.K. and R.C.S., stained by J.M.F. and scored by T.K.M. for total HuR expression, and by G.A.M., A.J. and J.M.F. for cytoplasmic HuR expression. MRI imaging and analysis was performed by C.R.W. and A.R.G. All authors contributed to the shaping of this project by providing critical feedback on experimental approach, analysis and the manuscript.
FUNDING
National Institutes of Health [R21 CA263996 to J.R.B. and R.C.S.; R01 CA212600 to J.R.B.; U01 CA224012 to R.C.S. and J.R.B.] (15-90-25-BROD), AACR-PanCAN [to J.R.B.]; Brenden-Colson Center for Pancreatic Care at Oregon Health & Science University [to C.R.W., A.R.G., R.C.S. and J.R.B.]; OHSU Knight Cancer Institute; Code Biotherapeutics; Hirshberg Foundation for Pancreatic Cancer Research; Sarah Parvin Foundation.
Conflict of interest statement. None declared.

Comments