


ABSTRACT
Ewing sarcoma (EwS) is a small round blue cell tumor and is the second most frequent pediatric bone cancer. 85% of EwS tumors express the fusion oncoprotein EWS-FLI1, the product of a t(11;22) reciprocal translocation. Prior work has indicated that transcription regulation alone does not fully describe the oncogenic capacity of EWS-FLI1, nor does it provide an effective means to stratify patient tumors. Research using EwS cell lines and patient samples has suggested that EWS-FLI1 also disrupts mRNA biogenesis. In this work we both describe the underlying characteristics of mRNA that are aberrantly spliced in EwS tumor samples as well as catalogue mRNA splicing events across other pediatric tumor types. Here, we also use short- and long-read sequencing to identify cis-factors that contribute to splicing profiles we observe in Ewing sarcoma. Our analysis suggests that GC content upstream of cassette exons is a defining factor of mRNA splicing in EwS. We also describe specific splicing events that discriminate EwS tumor samples from the assumed cell of origin, human mesenchymal stem cells derived from bone marrow (hMSC-BM). Finally, we identify specific splicing factors PCBP2, RBMX, and SRSF9 by motif enrichment and confirm findings from tumor samples in EwS cell lines.
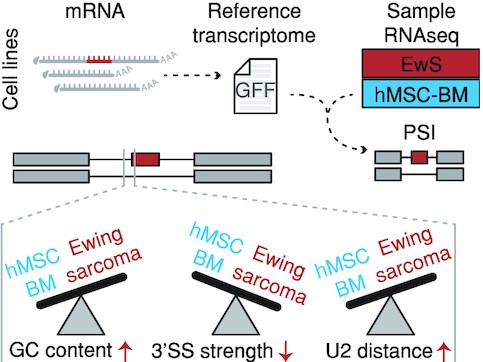
RNA splicing in Ewing sarcoma was quantified by first constructing a reference transcriptome using long-read sequencing of cell line models, then using tumor samples for per-event quantification. We find that altered RNA splicing in Ewing sarcoma is characterized by, among other things, higher GC content and lower 3' splice site strength.
INTRODUCTION
EwS is a bone and soft tissue sarcoma that typically presents between 15 and 30 years of age and is characterized by a t(11;22) reciprocal translocation that fuses EWSR1 with an ets-family transcription factor, frequently FLI1 (1,2). Current standard of care includes local resection, radiation, and multimodal chemotherapy. Many of these therapies can cause latent damage that manifests later in life (3). Even with aggressive therapy, patients that present with metastases have a 5-year survival rate of less than 30% (4,5). Understanding which tumors are more likely to require aggressive therapy has the potential to substantially improve quality of life for many patients. Aggressive treatment strategies have proven effective for some cases, but uniformity of treatment has also meant that prior stratification tools are less useful if most patients receive similar treatments (6). Current stratification strategies in patients with EwS utilize clinical characteristics such as tumor volume, metastatic stage, and location of metastasis. To date, it has been difficult to construct prognostic models using transcriptional information from tumors alone (7). Previously, using affinity mass spectroscopy, we demonstrated that the EWS-FLI1 interactome is enriched for spliceosome components (8). Subsequent work established that EWS-FLI1 regulates protein isoform expression of BCL-2 family members through modulation of mRNA splicing, increasing resistance to pro-apoptotic signaling (9,10). EWS-FLI1 also induces expression of an ARID1A protein isoform that alters BAF complex function to increase colony formation and invasion (11). A limitation of these previous studies was the lack of access to high-resolution transcriptome data detailing the transcript variants expressed in EwS and the relatively few number of samples evaluated. Here, we report a detailed compendium of the splicing events present in EwS tumors.
The goals of this study are twofold: (a) to identify unannotated mRNA splicing events in EwS and (b) to identify features, both splicing cis-regulatory sequences and RNA-binding proteins, that contribute to splicing events associated with EwS transcriptome formation. Our primary comparison is between EwS and the putative progenitor cell of EwS, bone marrow-derived mesenchymal stem cells (hMSC-BM) (12). The high-GC sequence context associated with splicing events that are changed in EwS suggests that there may be a relationship between the physical processes that drive splicing factor aggregation and the specific splicing events changed in EwS.
MATERIALS AND METHODS
Cell culture, SMRT long-read sequencing and analysis
EwS cell lines TC-32 and A4573 were a gift from the Triche lab and were grown in RPMI media (ThermoFisher) supplemented with 10% FBS (13). Both TC-32 and A4573 have a t(11;22) translocation that produces EWS-FLI1 and both TC-32 and A4573 express wild-type p53. TC-32 also has homozygous deletion of CDKN2A and both TC-32 and A4573 have a STAG2 frameshift mutation. TC-32 expresses EWS-FLI1 variant 1, which fuses exons 1-7 of EWSR1 to exons 6–9 of FLI1 and A4573 expresses EWS-FLI1 variant 3, which fuses exons 1–10 of EWSR1 to exons 6–9 of FLI1. SMRTbell libraries (Pacific Biosciences) were prepared from total mRNA per manufacturer instructions. mRNA size distribution was characterized by Bioanalyzer 2100 (Agilent) before and after adapter ligation. mRNA size ranges (1–2, 2–3, 3–6 and 6–10 kb) were selected by automated pulsed-field agarose gel separation using a BluePippin (Sage Science). All libraries were sequenced using a PacBio RSII and P6-C4 chemistry.
Reads were processed to produce circular consensus sequences (CCS), then filtered for those reads that had at least two full-length reads of the included transcript. These CCS were retained for further downstream processing. CCS from TC-32 and A4573 were joined (outer join) by concatenating read sets, aligned to GRCh38 using minimap2 (14), then collapsed to genome loci using Python scripts from the Cupcake-ToFu PacBio repository. Long-read-generated annotation was combined with GENCODE (v37) annotation and statistics were generated using gffcompare (15).
RNAseq processing and PSI quantification
Raw reads from dbGaP studies phs000463 (TARGET), phs000424 (GTEx), phs000720 and phs000768 were accessed via the NCBI Sequence Read Archive (SRA). Subsets of samples from SRA BioProjects PRJNA431247, PRJNA493024, PRJEB22756, PRJNA30709 (ENCODE) and PRJNA507603 were used to create comparison sets of samples and to examine transcriptome diversity. In total, 123 EwS, 84 rhabdomyosarcoma, 88 osteosarcoma, 168 neuroblastoma, 13 bone marrow-derived human mesenchymal stem cells, and 236 GTEx samples were analyzed. Transformed cell lines and samples from brain were excluded from GTEx data.
A subset of samples were aligned using STAR (v2.7.5a) for visualization of read density at splice event locations (16). We generated an index of splicing events annotated in the combined GENCODE-SMRT transcriptome, then used whippet (v0.11.1) to quantify the PSI for all samples at each event in the index (17). Gene expression in transcripts per million (TpM) was estimated concurrently, using the same tool. We quantified splicing on a per-event level, as opposed to entire transcripts, as quantification of complete transcripts with alignment-free strategies also requires a known and exhaustive transcriptome. Our approach has the benefit of allowing us to evaluate splicing accurately for any given splicing event, but has the disadvantage of not providing information regarding other splicing events taking place within the same transcript.
RNAseq visualization
Visualization of single splicing events in Figure 2D and E was conducted using ggsashimi (18). Five aligned RNAseq samples from each of the indicated groups was aligned to GRCh38 as described previously in RNAseq processing and PSI quantification. The numbers indicated on the arcs are the median number of junction reads for all of the randomly selected five samples across the indicated boundary. The y-axis indicates the read depth. The colored exons in Figure 2D and E are the same splicing events quantified in Figure 2B and C.
Splice site strength estimation
We used MaxEntScan tool, described in Yeo and Burge, 2004 to determine splice site strength for each of the splice sites from all events in the groups described in Figure 3A. We compared these results to those from using a inhomogeneous first-order Markov model, as described in Yeo and Burge (19). We saw consistent results from both methodologies, as had been observed before. The y-axis value is a score of the similarity to an ‘ideal’ splice site, as approximated by consensus across annotated splice sites. The ideal MaxEnt score is 13.59 for 3′SS and 11.81 for 5′SS, with lower values being indicative of increased diversion from ideal.
Branchpoint location and strength estimation
We used the tool BPP https://github.com/zhqingit/BPP to assess U2 complex binding location and strength (20). This allowed us to both estimate the conformity to canonical branchpoint structure as well as the location of the U2 spliceosome complex binding site for each of the mRNA splicing events that we had annotated.
R-loop and DNA methylation analysis
Existing DRIPseq R-loop data for EwS cell lines A4573 and TC-32 were downloaded from NCBI GEO accession GSE68845 (21). R-loop data from hMSC-BM samples was downloaded from NCBI GEO via accession GSE145964 (22). We established R-loop locations that were enriched in A4573 and TC-32 but were not in hMSC-BM. R-loop locations were processed using rtracklayer, GenomicRanges and the relative density of R-loop positive areas was visualized using ggridges and ggplot (23–25).
Reduced representation bisulfite sequencing or whole-genome bisulfite sequencing of EwS patient samples and hMSC-BM samples were downloaded from GSE88826 and GSE89026 (26). Differentially methylated regions (DMRs) were calculated using the R package bsseq (27). DMR were designated as significant or not significant (FDR ≤ 0.05) for hypomethylation or hypermethylation.
Permutation and significance of region overlaps
To estimate the significance of region overlap between DRIPseq R-loop regions or DMR regions and the groups of splicing events described in this work, we employed the regioneR package to conduct permutation testing (28). For R-loop overlap significance estimation we used 50 000 permutations to determine whether any overlap between the groups (Groups 1 and 2) in question and sites of R-loop formation constituted significant enrichment of overlap relative to the control group (Group 11). For significance of overlap with differentially methylated regions (DMR), we instead used the relative methylation level between hMSC-BM and EwS and again processed 50 000 permutations to estimate the significance of methylation level difference between Group 1 or 2 compared to Group 11.
Motif enrichment and analysis
We examined sequence from regions –1 kb to +100 bp surrounding cassette exon 3′SS locations. We used the AME tool from the meme suite to estimate relative enrichment of known motifs from Ray et al. and from the RNA binding factor motif database CISBP-RNA (29,30). A complete table of motifs and associated significance of enrichment as well as rates of incidence in positive groups and control groups is included in Supplementary Table S3. Enrichment of RNA binding motifs in Group 1 and Group 2 splicing events were defined relative to Group 11, or splicing events that were included at similar rates between the comparison groups. We compared this approach to using shuffled sequence as a reference but found that using real sequence provided a more appropriate control for the position-dependent effects of motifs surrounding exon splice sites.
Western blotting and splicing event PCR
Protein levels in EwS cell lines TC-32, STA-ET 7.2, RD-ES and A4573 as well as hMSC-BM were assayed by SDS-PAGE with primary antibodies to PCBP2 (Invitrogen PA5-30116), RBMX (Invitrogen PA5-63471) and SRSF9 (Abcam ab236414) as well as FLI1 (Abcam ab15289) and β-Actin (Abcam ab49900).
Splicing event PCR was conducted with exon or intron-spanning primer pairs for FLNB (F: 5-GTGGTTGATGCCAAGACTGC-3, R: 5-AAATCCCAGGCCGTTCATGT-3), MYO18A (F: 5-GAAAGCCTGGAGGCTGCTAA-3, R: 5-GCCTTGGAAGGTCCCTTGTT-3), and SPAG5 (F: 5-GCAGCTTGCAGTGTGAGAAC-3, R: 5-CAGTCAGCAGCCCTAGCTTT-3).
DepMap data filtering and visualization
DepMap cell line expression and CRISPR knockout data was grouped by sub-lineage, then filtered for sub-lineages with three or more cell lines. Sub-lineages were ordered by aggregate relative expression level or Cronos gene dependency score across the three genes examined (PCBP2, RBMX and SRSF9).
RESULTS
Defining the Ewing sarcoma transcriptome
Previous work has provided strong evidence for the involvement of EWS-FLI1, the key oncogene of EwS, in the regulation of mRNA splicing (8,11,31–33). Our first goal was to use EwS cell lines to define a more comprehensive transcriptome for use with EwS tumor RNAseq. This strategy allows us to quantify both previously unannotated as well as canonical mRNA splicing events by alignment-free quantification. We used PacBio long-read sequencing to sequence poly-A mRNA extracted from two EwS cell lines, A4573 and TC-32. Numbers of full-length transcripts from each cell line are indicated in Supplementary Table S1. After we joined quality-filtered reads from TC-32 and A4573 cell lines, we identified 12 518 high-confidence transcripts, 7316 of which were not completely contained in a longer read from the same locus.
We aligned filtered circular consensus sequences to a reference genome (GRCh38), with over 99.9% of the filtered reads aligning unambiguously to 5,926 discrete genomic loci. Within the isoforms sequenced, 98.7% of exons were previously annotated in GENCODE and 99.1% of retained introns were previously annotated. We then catalogued transcripts that were similar to existing annotation but contained internal variations indicative of unannotated splicing events. In total, we found 780 exons and 443 introns that were previously unannotated. We appended these isoforms to GENCODE annotation to create a transcriptome which we use throughout this work (GENCODEv37+long reads). Three of the events that were appended to the GENCODE reference to create the GENCODEv37+long reads reference are illustrated in Figure 1A and B, at the genes SPAG5 and KIF22, respectively. This reference transcriptome is available in standard GFF3 format as Supplementary Table S2.
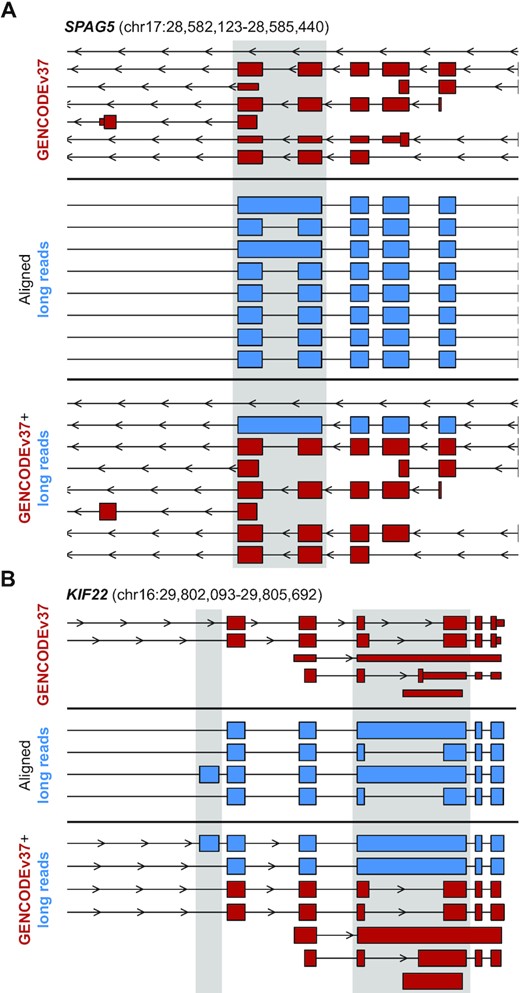
Alignment of PacBio SMRT long RNAseq reads to GRCh38. PacBio SMRT long RNAseq reads were filtered for high-confidence transcripts, then aligned to GRCh38. Previously unannotated regions are indicated with gray shading. (A) An example of an unannotated retained intron in SPAG5 is illustrated here, with the red top section illustrating the existing GENCODEv37 annotation at this locus, the blue center section is the aligned long reads after filtering, and the lower red and blue panel illustrates the combined GENCODEv37+long read transcriptome used for quantification of all samples. (B) Panel layout is the same as in (A), focusing on the KIF22 locus that has both an unannotated exon as well as an unannotated retained intron.
Classification of splicing event types by relative inclusion levels
To enable comparison of sequence features associated with splicing events that are consistently more frequently included or excluded in EwS samples compared to hMSC-BM samples, we classified each splicing event quantified by short-read RNAseq into one of a series of groups. These groups were based on both the difference in PSI between EwS tumor samples and hMSC-BM samples as well as the confidence in each PSI estimation. In order to focus on exon changes independent of gene expression levels, we included only splicing events that were located in genes with a difference in mRNA expression of <2-fold between hMSC-BM and EwS, as genes with substantial differences in expression levels may introduce unwanted artifacts into PSI quantification. The number of cassette exon and retained intron splicing events evaluated before and after filtering steps are detailed in Supplementary Table S4. The first discrete groups of splicing events we defined were those splicing events that have a shift in mean inclusion rate when comparing EwS and hMSC-BM samples but in neither sample group was an exon or intron entirely included or excluded. We defined splicing events with an increased rate of inclusion in EwS relative to hMSC-BM (ΔPSI ≥ 20%) as Group 1, and splicing events with a decreased rate of inclusion (ΔPSI ≤ –20%) as Group 2 (Figure 2A).
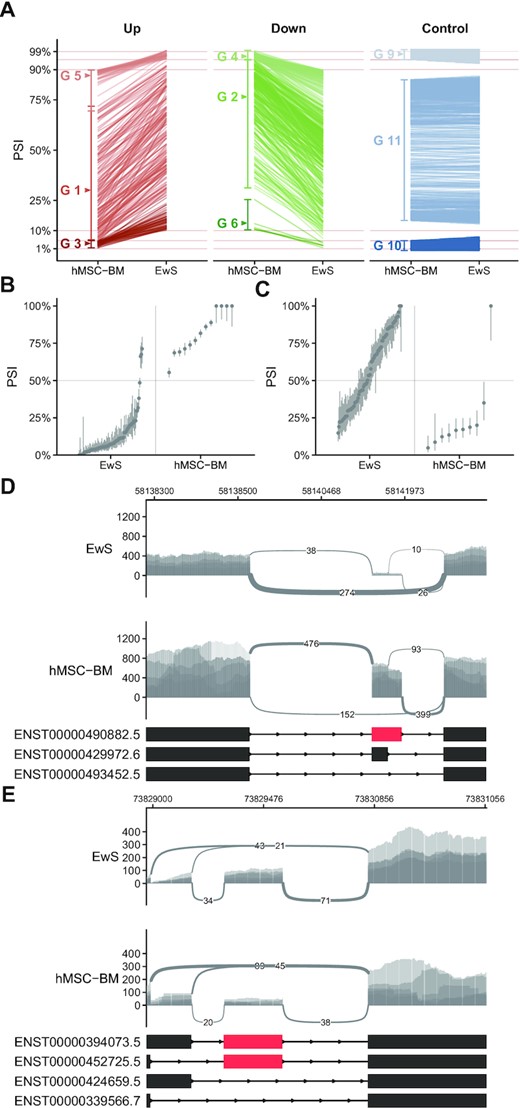
Grouping individual splicing events by relative difference. (A) Difference in mean PSI with individual cassette exon splicing events indicated by single lines and group membership indicated within the plot as G 1-11 (Group 1–11). Mean PSIs are calculated from 123 EwS samples and 13 hMSC-BM samples. (B, C) The estimated PSI and confidence intervals of individual samples indicated by points and vertical lines, respectively. (B) is an example of a Group 2 splicing event and (C) is an example of a Group 1 splicing event. (D, E) Sashimi plots of read density and number of junction-spanning reads at the same mRNA splicing events quantified in (B, C) using five RNAseq samples from each sample set.
We separated Group 1 and Group 2 events from those that were exclusively included or excluded in one set of samples. We defined near-complete inclusion as having a mean PSI ≥ 95%, and likewise, near-complete exclusion as having a mean PSI ≤ 5%. We generated Groups 3, 4, 5 and 6 as those splicing events that move from near-complete inclusion or exclusion to some intermediate rate of inclusion in either set of samples (Figure 2A). We have defined these as separate groups from Groups 1 and 2 because the regulatory elements that lead to near-complete inclusion of specific exons or introns in given sample sets should be treated separately from those that consistently produce intermediate rates of inclusion. Intermediate inclusion would indicate potential actively regulated targets that modify function of a given protein or modulate nonsense-mediated decay as opposed to constitutively included or excluded exons. We have likewise defined Groups 9, 10, and 11 as containing splicing events that, respectively, remain consistently included in both samples (PSI ≥ 95% ± 2%), remain consistently excluded in both samples (PSI ≤ 5% ± 2%), or remain at a consistent intermediate level in both samples (EwS PSI = hMSC-BM PSI ±2%). These serve as reference groups of splicing events when examining the sequence features surrounding splicing events in Groups 1–6. All groups and the conditions used to define them are detailed in Supplementary Table S5. We defined Groups 7 and 8 to group splicing events that went from near complete inclusion to exclusion (PSI ≥ 95% ± 2% to PSI ≤ 5% ± 2%) or vice versa, however we found no splicing events that met this criteria.
We performed the same splicing event classification with neuroblastoma (NBL), rhabdomyosarcoma (RMS), and osteosarcoma (OS), comparing RNA splicing from each of these cancers with a panel of normal tissue samples. We found that while there was some overlap in the splicing events identified, in the majority of cases each tumor type had a unique splicing profile (Supplementary Figures S1 and S2, Tables S6 and S7). This was largely unsurprising, as each tumor type also has a driving mechanism or mechanisms that make it distinct.
In total, we found 155 Group 1 cassette exon splicing events that were significantly different when comparing hMSC-BM to EwS, and 342 Group 2 cassette exon splicing events from the same comparison (Figure 2A). There were overall fewer intron retention events with a similar degree of change between the two groups, with 129 and 68 events in Group 1 and Group 2, respectively (Supplementary Figure S3A and B). The PSI distribution of single cassette exon splicing events classified as Group 2 and Group 1, respectively, are illustrated in Figure 2B and C with per-sample confidence intervals indicated by vertical lines across each sample point. These same two example splicing events are illustrated by RNAseq read density of five samples in each sample group plotted across the splicing event being evaluated (Figure 2D and E).
Weaker splice sites are more frequently utilized in Ewing sarcoma
Using our grouping of splicing events when comparing hMSC-BM with EwS, we investigated local sequence features that may contribute to the altered splicing at some sites in EwS. We first examined the nucleotide frequency immediately surrounding (+/-30bp) splicing events from each of the groups we had identified. We did not find any substantial differences at the splice site itself, with a similar majority of all splicing events in each group conforming to canonical GU–AG exonic boundary sequence (Supplementary Figure S4A–D).
We then examined both the maximum entropy (MAXENT) and first-order Markov model (MM) entropy score of each splicing event compared to other human splice sites to evaluate splice site strength (19). We examined 23 nucleotides of each 3′ splice site (3′SS): 20 bases of intronic sequence and three bases of exonic sequence. We also examined nine bases of each 5′SS, with 3 bases of exonic sequence and 6 bases of intronic sequence (Figure 3A).
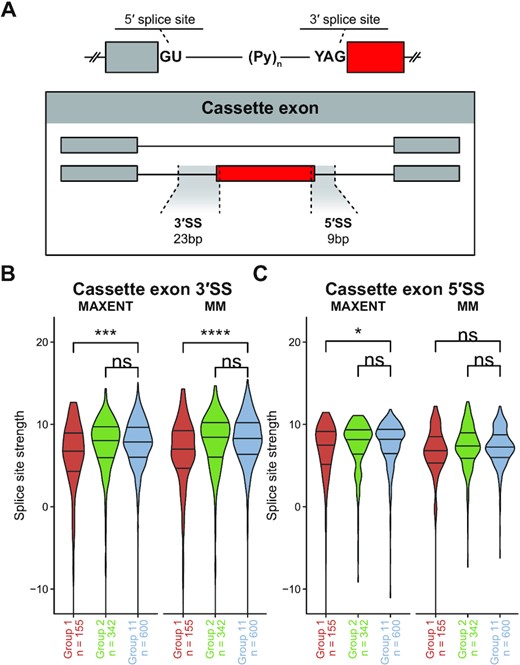
Cassette exons more frequently utilized in EwS have weaker 3′SS signal relative to canonical human splice sites. (A) Diagram of regions of interest when evaluating splice site strength for either cassette exons or retained introns, where the red exon or intron is the splicing event being evaluated. (B, C) Splice site strength as evaluated by maximum entropy (MAXENT) or first-order Markov model (MM) with 25th, 50th, and 75th quantiles indicated on violin plots, at the 3′SS (B) and 5′SS (C) of Groups 1, 2 and 11 cassette exons. (Wilcoxon signed-rank test; *P ≤ 0.05; **P ≤ 0.01; ***P ≤ 0.001; ****P ≤ 0.0001).
By both MAXENT and MM models, the 3′SS sequence was significantly weaker in Group 1 cassette exons (Figure 3B). Both MAXENT and MM models estimate divergence from canonical human splice sites and provide a measure of splice site strength. As Group 1 exons are those that are more frequently included in EwS compared to hMSC-BM, cassette exon splicing in EwS more frequently utilizes exons that have weaker 3′SS signal. We found strong consistency between splice site scores as assessed by MAXENT and MM. We also examined cassette exon 5′SS sequence and found only small differences between Group 1 and Group 11 or Group 2 and Group 11 (Figure 3C). We also examined 9 bases of 5′SS and 23 bases of 3′SS sequence surrounding retained introns (Supplementary Figure S3A) and likewise found only small differences in splice site strength between Groups 1 or 2 and Group 11 (Supplementary Figure S3C and D).
Ewing sarcoma more frequently utilizes exons with greater distance between 3′SS and branch point
We found the most significant sequence discrimination between Group 1 and Group 11 at the 3′SS, and we therefore wanted to determine whether RNA features associated with recognition sites of the U2 spliceosomal complex differ. We used the set of cassette exon events that we had previously partitioned into Group 1, 2 and 11 in the previous comparison between EwS and hMSC-BM and analyzed the difference in location of the branch point structure. We measured the relative distance to between the predicted U2 spliceosomal complex binding site and the 3′SS between Group 1 or Group 2 cassette exons with Group 11 cassette exons serving as a control group for both.
The branch point binding site of the U2 complex is generally located between 21 to 34 nucleotides upstream of the 3′SS, near the 5′ end of the polypyrimidine tract. We found that the branch point was predicted to be at a median of 27 nucleotides upstream of the 3′SS in cassette exons that were spliced in at similar levels in both EwS and hMSC-BM (Group 11), whereas the median branch point location was ∼32 bases upstream of exons that have a greater rate of inclusion in EwS relative to hMSC-BM (Figure 4A). However, we did not find that the distance between the 3′SS and the branch point location was significantly when comparing cassette exons in Group 2 and Group 11.
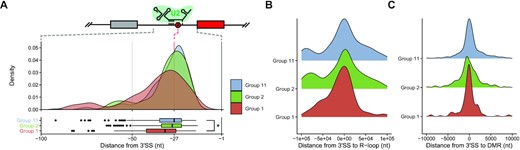
Cassette exon splice sites utilized in EwS are more likely to have distant U2 spliceosome subunit binding sites. (A) Density plot of branch point locations in Group 1, Group 2, and Group 11 cassette exons. (B) Distance from 3′SS to nearest R-loop binding site for Group 1, Group 2 and Group 11 cassette exons. (C) Distance from 3′SS to nearest differentially methylated region (DMR) between EwS and hMSC-BM (Wilcoxon signed-rank test; *P ≤ 0.05; **P ≤ 0.01; ***P ≤ 0.001; ****P ≤ 0.0001).
Sites of altered mRNA splicing in Ewing sarcoma correspond to altered DNA methylation but not R-loop formation
We tested two potential local factors that have established impacts on mRNA splicing; (i) R-loop formation or (ii) DNA methylation. Prior research into transcriptional abnormalities in EwS has uncovered that there is a higher rate of R-loop formation in EwS relative to other tissues and other tumor types (21). R-loops are a structure that forms co-transcriptionally wherein a nascent RNA strand re-invades DNA that is actively being transcribed, thereby forming a DNA:RNA duplex. Existing work has also indicated that R-loop formation takes place with higher frequency at sites with higher GC content and a greater likelihood of DNA secondary structure formation (34,35). There is also work that suggests that R-loop formation is enhanced when splicing factors that would normally protect nascent RNA are depleted (36). Using a dataset of immunoprecipitated and sequenced R-loops in EwS cell lines, we compared our sites of observed splicing changes with sites of known R-loop formation in EwS (21). While we did find that there was a strong relationship between sites of R-loop formation and 3′SS of cassette exons, we did not find a significantly higher frequency of local R-loop formation in the vicinity of Group 1 or Group 2 cassette exons relative to Group 11 cassette exons (Figure 4B, Supplementary Figure S5A and B).
Prior work has established a distinct DNA methylation signature associated with EwS (26). There have been a number of investigations into the impact of local DNA methylation on spliceosome site recognition. DNA methylation can impact mRNA splicing through a number of mechanisms. In the brain, MeCP2 interacts with YB-1 to promote exon inclusion in a methylation-dependent manner (37,38). CTCF can also promote methylation-dependent inclusion of weaker exons by inducing RNA polymerase II pausing and thereby increasing exon inclusion (39). HP1α and HP1β bind directly to H3K9me3, a histone modification that is co-localized with regions of methylated DNA, and serves as a scaffold for splicing factors (40).
We examined existing DNA methylation data from whole-genome bisulfite sequencing of EwS patient tumors and hMSC-BM samples to determine whether the mRNA splicing patterns that are altered in EwS are associated with the unique DNA methylation patterns observed in EwS (26,41). We first established regions of relative hypo- and hyper- methylation in EwS with respect to hMSC-BM and performed an enrichment analysis of regions from 5kb upstream and 60 bases downstream of 3′ cassette exon splice sites. We observed a significant relationship between sites of altered DNA methylation and altered rates of cassette exon inclusion in EwS. In particular, we found that both exons with greater and lesser rates of inclusion in EwS relative to hMSC-BM (Group 1 and Group 2, respectively) had lower rates of DNA methylation at CpG sites in the region investigated (Supplementary Figure S5). We did not observe, however that there was a difference in distance to the nearest differentially methylated region (Figure 4C) between any of the groups being compared.
GC content and skew determine altered exonic splicing in Ewing sarcoma
We next investigated whether sequence features farther upstream than the immediate splice site separate Group 1 and 2 cassette exons from reference exons in Group 11. We examined a region from −64 bp to −3 bp and 1–64 bp surrounding exonic boundaries to determine both the GC content and skew. GC content was evaluated in a 8 bp sliding window and fit to a third order polynomial at both the 3′SS and 5′SS of cassette exons (Figure 5A and B). We evaluated the same region in retained introns (Figure 5C and D).
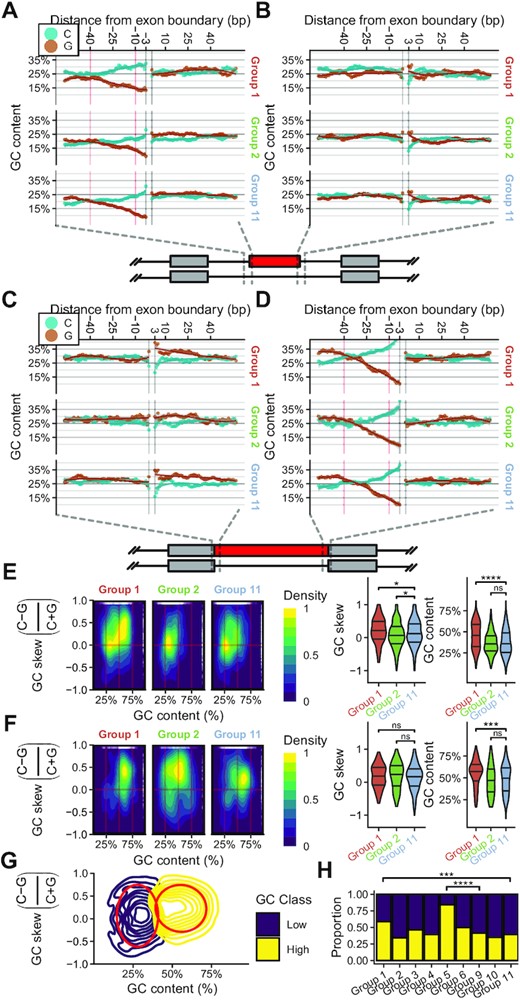
mRNA splicing events altered in EwS have significantly different GC content profiles. (A) Sliding window (8 bp) of G and C content of Group 1, 2 and 11 cassette exons from −64 bp to −3 bp, and from 1 bp to 64 bp relative to 3′ splice site (3′SS) or (B) 5′SS. Fit is a 3rd order polynomial with 95% confidence interval. The area indicated with red vertical lines is from −40 bp to −10 bp relative to the 3′SS. (C) Sliding window (8bp) of G and C content of Group 1, 2 and 11 retained introns from −64 bp to −3 bp, and from 1 bp to 64 bp relative to 5′SS or (D) 3′SS. Fit is a 3rd order polynomial with 95% confidence interval. The area indicated with red vertical lines is from −40 bp to −10 bp relative to the 3′SS. (E) Density distribution of GC skew and GC content for all cassette exon splicing events or (F) retained intron splicing events in Groups 1, 2 and 11 when comparing EwS to hMSC-BM. Violin plots indicate distributions evaluated in single dimensions. (G) 2D Gaussian mixed model fit to all quantified splicing events. The red boundary contains 75% of all events in the given class. (H) Proportion of each group classified as ‘High’ or ‘Low’ GC class by gaussian mixed model in (G). (Wilcoxon signed-rank test; *P ≤ 0.05; **P ≤ 0.01; ***P ≤ 0.001; ****P ≤ 0.0001).
We found that Group 1 cassette exons had substantially higher GC content and marginally higher GC skew upstream of exons that were more frequently included in EwS tumor transcripts. We further evaluated a region from −40 bp to −10 bp from the 3′SS of cassette exon splicing events and extracted both the GC content and GC skew (C−G/C+G) for the entire region. We examined the density of events across both GC content and GC skew and observed a significant difference in GC content between Group 1 and Group 11 cassette exons, with Group 1 cassette exons having greater GC content than Group 11 cassette exons (Figure 5E). We also evaluated the same −40 bp to −10 bp region from 3′SS sequence of retained intron splicing events in Group 1, 2 and 11 and found a similar distribution wherein Group 1 retained introns had significantly higher GC content than those in Group 11 (Figure 5F). We also checked whether Group 1 and Group 2 exons were consistently located towards the start or end of transcripts but found that there were no substantial differences in relative location of exons (Supplementary Figure S6A). We likewise found that while the relative location of retained intron splicing events was shifted towards the end of transcripts in Group 1 and Group 2 retained introns, this distribution mirrored that observed in Group 11 (Supplementary Figure S6B).
To quantify the degree to which Groups 1 and 2 cassette exons had altered GC content and skew, we generated a 2D gaussian mixed model of the GC content and skew of all splicing events quantified. We found two major peaks when examining all potential cassette exon splicing events. We assigned a GC class probability to each of these peaks, then quantified the number events in each group that were in either GC class (Figure 5G). We found that both Group 1 and Group 5 cassette exons were significantly enriched for sites that had high GC content/skew (Figure 5H). Groups 1 and 5 correspond to exons with substantially increased PSI in EwS samples relative to hMSC-BM. Group 1 and Group 5 exons were compared to their respective reference groups, Group 11 and Group 9, respectively.
Motif enrichment indicates involvement of PCBP2, SRSF9, RBMX, and IGF2BP3 in splice site selection in Ewing sarcoma
The identification of GC content as a determinant of splice site usage in EwS prompted us to next investigate whether we could identify trans-activating RNA binding proteins that regulate utilization of specific splice sites in EwS. We investigated whether there is enrichment for binding motifs of known RNA-binding proteins between −500 and +50 from the 3′SS of exons that exhibited altered rates of inclusion in EwS relative to hMSC-BM. We found that, consistent with our prior results, high-GC motifs were positively enriched near Group 1 splicing events and low-GC motifs were likewise depleted near Group 1 splicing events (Figure 6A, Supplementary Table S3). We used sequences from exons in Group 11 to create reference set; Group 11 were those exons that were included at a similar rate between both EwS and hMSC-BM. The high-GC binding motifs of PCBP2, SRSF9, RBMX, SRSF1, HNRNPH2 and LIN28A were among those most positively enriched in Group 1 exonic splicing events relative to Group 11 exonic splicing events. The low-GC RNA binding motifs of IGF2BP3 and KHDRBS2 were among those motifs seen at a significantly lower rate than would be expected by chance in Group 1.
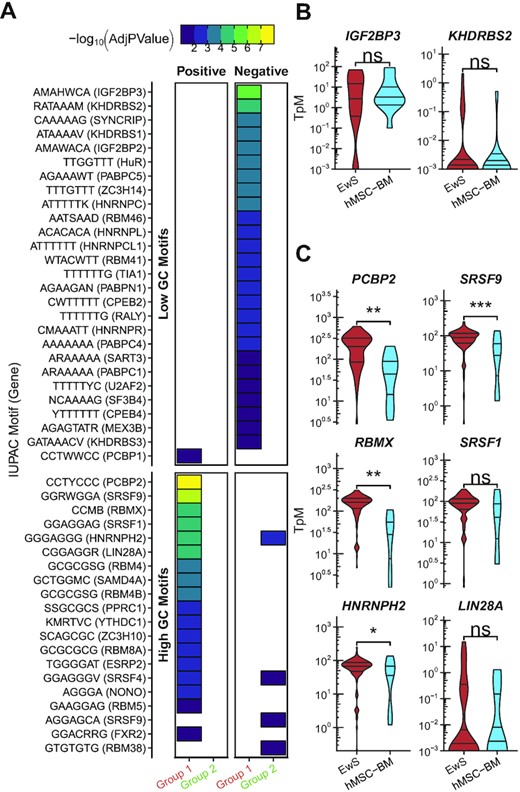
Motif enrichment analysis of sites of altered mRNA splicing in EwS relative to hMSC-BM. (A) Motif enrichment analysis of the region −500 to +50 of exons that are classified as Group 1 in the comparison between EwS and hMSC-BM. Motifs are grouped by high or low GC content (more or less than 50%). Colored blocks indicates an adjusted P-value ≤0.05, with purple through yellow corresponding to increased significance. Group 1 exons were compared to Group 11 exons. (B) mRNA expression of genes associated with motifs that were depleted in Group 1 relative to Group 11. (C) mRNA expression of genes associated with motifs that were enriched in Group 1 relative to Group 11 (Student’s t-test; *P ≤ 0.05; **P ≤ 0.01; ***P ≤ 0.001; ****P ≤ 0.0001).
We also investigated the expression levels for these same genes in EwS and hMSC-BM. IGF2BP3 and KHDRBS2 were the most significantly negatively enriched motifs in Group 1, but neither had significantly altered mRNA expression in EwS compared to hMSC-BM (Figure 6B). The genes with the strongest positive motif enrichment also had the largest difference in mRNA expression in EwS compared to hMSC-BM among the splicing factor genes we investigated. We found that mRNA expression of PCBP2, SRSF9 and RBMX was significantly increased in EwS relative to hMSC-BM (Figure 6C). We confirmed this finding in EwS cell lines TC-32, STA-ET 7.2, RD-ES, and A4573 relative to hMSC-BM (Supplementary Figure S7A). We also confirmed splicing of two identified differential cassette exon splicing events in FLNB and MYO18A in the same EwS cell lines as well as the existence of a newly annotated retained intron event in SPAG5 (Supplementary Figure S7B). The fact that high-GC splicing factor motifs are enriched upstream of cassette exons indicates their potential involvement in regulation of cassette exon splicing in EwS. Using the DepMap collection of cell lines, we also examined both expression and essentiality of PCBP2, RBMX, and SRSF9 across cancer cell lines and found that EwS has among the highest expression levels of each of these genes (Supplementary Figure S8A) (42–44). However, because each of these genes are critical for RNA splicing, there is little difference in the gene essentiality as measured by CRISPR knockout screen across the same cell lines, with each of these genes categorized as generally essential (Supplementary Figure S8B).
DISCUSSION
EWS-FLI1, the key oncoprotein of EwS, modulates mRNA splicing through direct and indirect interactions with spliceosome components and potentially through direct interaction with mRNA (10,11,45). While there have been investigations of specific mRNA splicing targets affected by EWS-FLI1, this is the first comprehensive study of both the full scope of altered mRNA splicing in EwS as well as the sequence features associated with these splicing changes. Through this work we have found that cassette exon splicing in EwS more frequently utilizes weaker splice sites than splicing in hMSC-BM. This suggests that the GC content upstream of cassette exons is associated with splicing choice in EwS. Splicing factor motifs rich in GC are likewise enriched upstream of cassette exons that are significantly differentially included or excluded in EwS relative to hMSC-BM.
In this work, we first identified unannotated mRNA splicing events in EwS using long-read sequencing, then created and utilized reference annotation (GENCODEv37+long reads) to quantify mRNA splicing in EwS patient samples. Because EWS-FLI1 is known to regulate mRNA splicing and our goal was to comprehensively quantify mRNA splicing in EwS, we first wanted to uncover previously unannotated transcript features using long-read sequencing. Using this transcriptome we constructed from long-read sequencing and existing annotation, we estimated inclusion rates of individual cassette exon and retained intron splicing events in short-read RNAseq data from EwS, OS, RMS and NBL tumors as well as in hMSC-BM samples and GTEx tissue samples. We believe this quantification strategy allows us to best leverage the strengths of both sequencing platforms, as it allows transcriptome feature reconstruction from full-length mRNA as well as accurate per-event PSI quantification using the much greater depth of short-read RNAseq.
We classified each cassette exon and retained intron by the relative difference in PSI between EwS and hMSC-BM. Creating these groups allowed us to then perform comparisons between defined subsets of splicing events. We attempted to encompass each of the categories of differential splicing we might find, either variable intermediate splicing or near-complete inclusion or exclusion. These groups are explained in detail in Supplementary Table S5. Using these groups we evaluated the splice site strength with MAXENT and MM and found that cassette exons that are included at a higher rate in EwS than hMSC-BM also have significantly lower 3′ splice site strength (19). Splice site strength, broadly characterized, refers to the degree to which a given 3′ or 5′ splice site conforms to canonical Homo sapiens splice sites, with a higher measure indicating greater utilization of canonical 3′ or 5′ nucleotide sequence.
When we examined a wider range of sequence up to 60 bp upstream and downstream of 5′SS and 3′SS locations surrounding cassette exons or retained introns (Figure 5A−D), we found that GC content was significantly higher upstream of the 5′SS of cassette exons that were more frequently included in EwS relative to hMSC-BM (Group 1). We further examined this sequence region from −500 bp to +50 bp surrounding 5′SS for enrichment of known splicing factor motifs and likewise found that motifs with ≥50% GC content were strongly positively enriched in Group 1 cassette exons, whereas motifs with ≤50% GC content were negatively enriched. We further examined the expression of the splicing factors associated with these motifs and observed significant differential expression of PCBP2, SRSF9 and RBMX. Notably, SRSF9 has been implicated in the production of an anti-apoptotic isoform of Caspase-2 (46) and PCBP2 has been shown to be highly expressed in a number of cancer types, including pancreatic ductal carcinoma and gliomas (47,48). Based on a recent publication we also specifically looked for enrichment of RBFOX-family motifs, but did not find significant enrichment in Group 1 or Group 2 CEs or RIs (49).
We recognize that these comparisons are limited due to the fact that our additions to the GENCODE reference transcriptome were based on EwS cell lines, rather than tumor samples. We hope to continue to refine the subset of events that we focus on as tumor RNAseq becomes more routine. We believe that hMSC-BM is a fair approximation of an EwS progenitor cell but acknowledge that there are likely subtypes of hMSC-BM that have their own unique mRNA splicing patterns, and some of these subsets of hMSC-BM may be more apt to be transformed by EWS-FLI1 (12).
Our future work will also look further into heterogeneity within hMSC-BM cell types derived from separate donors with the expectation that a subset of these will be more readily transformed by EWS-FLI1. We also expect that single-cell sequencing targeting the events detailed in this work would would reveal a degree variability in splicing within EwS tumor cells. Through this work we have compared EwS with hMSC-BM, but we also determined the extent of overlap of splicing changes with other tumor types (Supplementary Figures S1 and S2, Tables S6 and S7). There were some splicing events that had similar regulatory patterns across EwS, RMS, OS and NBL, and some that varied or were only partially shared. The use of a panel of normal tissue from GTEx as a reference comparison for EwS, RMS, OS and NBL may not be a practical reference set, as we did not observe a large degree of overlap between the EwS - hMSC-BM and EwS - GTEx comparison. In the future we expect that the use of paired tumor and hMSC-BM samples will improve the effectiveness of this comparison in the case of EwS.
There are caveats to an analysis that seeks to infer functional protein changes from single event splicing, including: (a) each splicing event may be a part of a number of different transcripts with unique splicing that results in unique coding sequence independent of the splicing event being investigated and (b) we cannot assume that every transcript is equally likely to be produced from a given gene locus, addressing this question with the available resources becomes either (a) computationally intractable or (b) difficult to model accurately without further information to reduce the search space, such as long-read sequencing of tumor samples. We have, however, confirmed previously discoverd splicing events in the FLNB and MYO18A genes. Skipping of this specific cassette exon in FLNB has previously been identified as associated with a mesenchymal state in breast cancer (50). Likewise, splicing of MYO18A in mouse has been linked with epithelial-luminal state transition (51).
In total, we believe this work provides a valuable resource for those studying the details of splicing regulation in pediatric cancer. We have uncovered an interesting link between increased cassette exon inclusion in EwS relative to hMSC-BM and the GC content and splice site strength surrounding the upstream 5′ splice site. We have also found that binding motifs for splicing factors PCBP2, SRSF9 and RBMX are among those most significantly enriched upstream of cassette exons with increased inclusion in EwS. As has been observed in other cancer types, mRNA expression of these factors is increased in EwS. Future work will focus on refining the EwS transcriptome, understanding the contribution of these splicing factors to EwS biology, and establishing a strategy to determine the relevance of individual splicing events to the EwS oncogenic process.
DATA AVAILABILITY
PacBio SMRT long-read RNAseq of EwS cell lines A4573 and TC-32 are deposited under NCBI Sequence Read Archive (SRA) project accession PRJNA724726. Raw reads from dbGaP studies phs000463 (TARGET), phs000424 (GTEx), phs000720 and phs000768 were downloaded from the NCBI SRA. Subsets of samples from SRA BioProjects PRJNA431247, PRJNA493024, PRJEB22756, PRJNA30709 (ENCODE) and PRJNA507603 were included in this analysis.
SUPPLEMENTARY DATA
Supplementary data are available at NAR Cancer online.
ACKNOWLEDGEMENTS
The authors would like to thank Federico Comitani for edits regarding clarity of statistical methodologies. We also thank the Georgetown Genomics and Epigenomics Shared Resource and Tissue Culture Shared Resource made available through LCCC CCSG Grant P30 CA051008-16 (Lou Weiner, PI). We thank the Children’s National Hospital, Washington, DC, for the use of their PacBio RSII and Sage BluePippin.
FUNDING
Children’s Cancer Foundation, Inc. (Baltimore MD); Hyundai Hope on Wheels, Burroughs Wellcome Clinical Scientist Award in Translational Research (J.A.T.); NIH [R01CA233619-01A1 to J.A.T., R01CA133662 to J.A.T., R01CA138212 to J.A.T., RC4CA156509 to J.A.T.]; A.S. is partially supported by an Early Researcher Award from the Ontario Ministry of Research and Innovation, the Canada Research Chair in Childhood Cancer Genomics, and the Robert J. Arceci Innovation Award from the St. Baldrick’s Foundation; N.J.C. is supported by the Intramural Research Program of the National Cancer Institute (NCI), Center for Cancer Research (CCR) [ZIA BC 011704].
Conflict of interest statement. None declared.

Comments