


Abstract
The elevated expression of the splicing regulator SRSF10 in metastatic colorectal cancer (CRC) stimulates the production of the pro-tumorigenic BCLAF1-L splice variant. We discovered a group of small molecules with an aminothiazole carboxamide core (GPS167, GPS192 and others) that decrease production of BCLAF1-L. While additional alternative splicing events regulated by SRSF10 are affected by GPS167/192 in HCT116 cells (e.g. in MDM4, WTAP, SLK1 and CLK1), other events are shifted in a SRSF10-independent manner (e.g. in MDM2, NAB2 and TRA2A). GPS167/192 increased the interaction of SRSF10 with the CLK1 and CLK4 kinases, leading us to show that GPS167/192 can inhibit CLK kinases preferentially impacting the activity of SRSF10. Notably, GPS167 impairs the growth of CRC cell lines and organoids, inhibits anchorage-independent colony formation, cell migration, and promotes cytoxicity in a manner that requires SRSF10 and p53. In contrast, GPS167 only minimally affects normal colonocytes and normal colorectal organoids. Thus, GPS167 reprograms the tumorigenic activity of SRSF10 in CRC cells to elicit p53-dependent apoptosis.
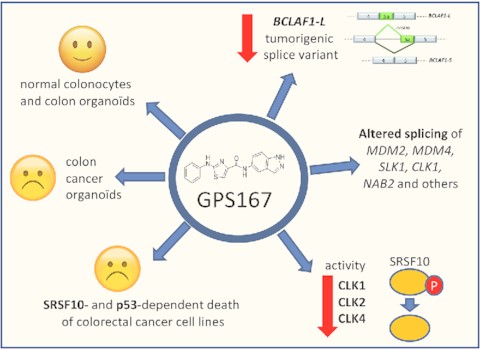
Aminothiazole carboxamide core molecule GPS167 decreases production of pro-tumorigenic BCLAF1-L variant, alters alternative splicing of other cancer-relevant transcripts and inhibits CLK kinases to impact the activity of SRSF10. GPS167 is selectively cytotoxic for colorectal cancer organoids and cell lines in a SRSF10- and p53-dependent manner.
INTRODUCTION
Removing introns from pre-messenger RNAs is achieved by the spliceosome which contains hundreds of proteins that associate with snRNAs. Alternative splicing diversifies the transcriptome by combining different sets of exons, of portions thereof. This process is supervised by splicing regulators that include proteins such as hnRNP and SR proteins. The SR proteins form a family of 12 RNA binding proteins (SRSF1 to SRSF12) whose localization and activity are in turn controlled by protein kinases such as SRPKs and CLKs (1,2). Misregulation of splicing is often associated with cancer, and several cancer-associated splice variants make key contributions to cancer initiation and progression (3,4). Cancer-associated splicing changes are caused by mutations in splice sites or in regulatory elements or by mutations that affect the expression or activity of generic and regulatory splicing factors. Mutations in splice sites or splicing regulatory elements often occur in tumor suppressor genes including TP53 (which encodes p53), ARID1A (which encodes a chromatin-remodeling factor) and PTEN (which encodes a phosphatase that regulates PI3K signaling) (5,6). Somatic mutations in splicing factors and regulators (e.g. U2AF1, SF3B1 and SRSF2) occur frequently in hematological pre-malignancies such as myelodysplasia, and these mutations lead to aberrant alternative splicing (3,7). Changes in the expression of splicing regulators are also prevalent in solid tumors (8). For example, SRSF1 is overexpressed in many tumors where it alters the alternative splicing of transcripts encoding tumor suppressors (9). SRSF1 promotes the production of the oncogenic cyclin D1b splice variant in prostate cancer, shifts splicing from pro- to anti-apoptotic BIM and CASP9 variants, and encourages the production of a RON variant involved in invasion and motility (3). The phosphorylation of SRSF1 is critical for this activity as loss of a Ser-Pro SRSF1 phosphorylation event changes the alternative splicing of >100 transcripts (10). Another example concerns the splicing regulator SRSF10 that is overexpressed in high grade colorectal tumors where it controls the production of BCLAF1-L, the pro-oncogenic splice variant of BCLAF1 (11). BCLAF1 modulates transcription and RNA processing, and it has been implicated in several biological processes including apoptosis and DNA repair (12,13). BCLAF1-L increases tumorigenesis in mice and is overproduced in high grade colorectal tumors (11). While SRSF10 is even more critical than BCLAF1 for tumor formation, it is not an essential splicing factor since mice knocked out for SRSF10, despite dying at birth because of a cardiac and liver defects, are otherwise normal (14). Stress and DNA damage trigger changes in the phosphorylation of SRSF10 that alter its interaction with other proteins to favor the production of the pro-apoptotic Bcl-xS splice variant in 293 cells (15,16). Thus, while SRSF10 helps promote oncogenic pathways in cancer cells, excessive DNA damage may redirect its activity towards cell death.
Because changes in alternative splicing can provide selective advantages to tumor cells, targeting an event, a group of events, or a regulatory protein that control multiple cancer-relevant events may offer therapeutic opportunities to fight cancer (17,18). In line with this objective, we previously reported the identification of a small molecule (1C8) that elicited the dephosphorylation of SRSF10 to produce a slight shift in BCLAF1 alternative splicing (19). Here, we report the identification of a group of aminothiazole carboxamide core molecules that more strongly abrogate the production of pro-oncogenic BCLAF1-L. The lead compound in this set, GPS167, impairs the activity of CLK kinases preferentially on SRSF10. The ability of GPS167 to affect selectively the growth and promote the death of human colorectal cancer cell lines and organoids establishes this class of molecules as potential anti-cancer agents.
MATERIALS AND METHODS
Cell lines, CRISPR knockouts and organoids culture
HCT116, COLO205, SW620, Caco-2, CRL-1831 and CRL-1790 were obtained from ATCC (Manassas, VA, USA). EcR-293 cells were from Invitrogen (USA). Each cell line was grown in the recommended medium. CRISPR/Cas9 versions of HCT116 were produced by transfecting a plasmid carrying the gRNA sequence along with Cas9 (kindly provided by Pr. Steve Jean) and selecting for puromycin resistant cells, which were pooled.
Human CRC organoid lines CCOL-01 and CCOL-11 and its normal-matched colon organoid line CNOL-11 were obtained from the Biobanque des maladies digestives du Centre de recherche du CHUS (Biobanque du CRCHUS), CIUSSS de l’Estrie – CHUS. Human normal colorectal organoid line CRC-MOL was created with rectosigmoid normal tissue also provided by the Biobanque du CRCHUS. All patients gave informed consent for the banking and use of their biological material and living derivatives (organoid lines) created using them. Both the ethics review board at the CIUSSS de l’Estrie – CHUS and scientific committee of the Biobanque du CRCHUS approved the creation and use of these living biological derivatives for this study (“Alternative splicing modulation and growth inhibition of colorectal cancer organoids by small anticancer molecules – CRC-MOL" study: #2018-2731). Briefly, all tissue samples were collected by a pathologist from surgical pathology specimens from patients who had undergone colorectal surgery. To create the organoid lines CCOL-01 and CCOL-11, the adenocarcinoma tissue samples were collected from 2 different patients. To create the normal-matched colon organoid line CNOL-11, a normal colon (sigmoid) mucosa tissue sample was collected at more than 5 cm of the adenocarcinoma from which the CRC organoid line CCOL-11 was derived. To create the normal colorectal organoid line CRC-MOL, a normal colorectal (rectosigmoid) mucosa tissue sample was collected at >5 cm of a tubulovillous adenoma from the surgical pathology specimen of a third patient who had undergone surgery. After collection, all tissue samples were washed with water and transported on ice in media containing antibiotics and processed within 2 h. CRC organoids were cultured in Culturex BME2 matrix (Amsbio, Cambridge, USA) at a concentration of 80–100% and maintained in organoid culture media [Advanced DMEM-F12, 2 mM GlutaMAX (Life Technologies, Carlsbad, USA), 10 mM HEPES (Wisent, St-Bruno, Canada), 10% Noggin conditioned media, 20% R-spondin conditioned media, 1× B-27 supplement (Life Technologies, Grand Island, USA), 10 mM nicotinamide, 1 mM N-acetyl-cysteine, 50 ng/ml human EGF (Biobasic, Markham, Canada), 3 uM SB202190 (Sigma-Aldrich, St Louis, USA), 500 nM A83-01 (Sigma-Aldrich, St Louis, USA), 10 nM prostaglandin E2 (Tocris, Oakville, Canada), 10 nM gastrin (Sigma-Aldrich, St Louis, USA), 2.5 μg/ml amphothericin B (Wisent, St-Bruno, Canada), 100 μg/ml primocin (InvivoGen, San Diego, USA) penicillin–streptomycin (Wisent, St-Bruno, Canada). Normal colon organoids were cultured in a similar way except that the culture media was supplemented with 50% Wnt3a conditioned media. Organoids were split in the presence of 10 μm of Y-27632 every 10–20 days and media changed every 2–3 days. AOM/DSS-derived mouse organoids were obtained and grown as described (20).
Antibodies, proteins and compounds
Antibodies used were against Flag (Sigma; F3165), SRSF10 (Abcam; ab77209), caspase-3 (Cell Signaling; 9664), PARP (Cell Signaling; 9542), actin (Sigma; A5316), tubulin (ab4074; Abcam), as well as rabbit (Cell Signaling; 7074) and mouse (Bio-Can; 115-035-003) immunoglobulins.
GST-tagged proteins CLK1, CLK2, CLK4, SRPK1 and DYRK1 were purchased from SignalChem, Canada. For production of GST-SRSF1, pellets of bacteria from 500 ml culture were resuspended in lysis buffer A (20 mM Tris–HCl pH 7.5, 300 mM NaCl, 10% glycerol, 1 mM DTT) containing 1% Triton X-100, 0.5 mM PMSF and protease inhibitors. Cells were sonicated and the protein was purified from cleared supernatant on FPLC system using a GSTrap HP column. The protein was eluted with the lysis buffer A supplemented with 20 mM reduced glutathione and dialyzed against 20 mM HEPES pH 7.9, 100 mM KCl, 20% glycerol, 1 mM DTT, 0.2 mM EDTA and 0.5 mM PMSF. To produce His-SRSF10, pellets were resuspended in lysis buffer B (50 mM NaH2PO4 pH 8.0, 500 mM NaCl, 20 mM imidazole and 20% glycerol) supplemented with 1 mM PMSF, protease inhibitors and 1% NP-40. Cells were sonicated and insoluble fraction was used for purification which was resuspended in denaturation buffer (8 M urea, 100 mM NaH2PO4, 10 mM Tris–HCl pH 8.0 and 20 mM imidazole). Clarified supernatant was loaded on a HisTRAP column and the retained proteins were renatured with a gradient of 20 column-volume, from denaturation buffer to lysis buffer. The proteins were eluted with lysis buffer supplemented with 250 mM imidazole and dialyzed as described above. TG003 and KH-CB19 were purchased from Cedarlane, Canada. Pull-down assays with Glutathione Sepharose 4B beads (GE Healthcare Bio-Sciences) were performed using 100 μM ATP, 300 ng of His-SRSF10, 300 ng of GST-CLK1 in kinase buffer (5 mM MOPS pH 7.2, 2.5 mM β-glycerophosphate, 5 mM MgCl2, 1 mM EGTA, 0.4 mM EDTA and 0.05 mM DTT). After incubation for 15 min at 30°C, equal aliquots of beads were added to each reaction and incubated at room temperature for 10 min. Beads were extensively washed with PBS. Proteins eluted from the beads were resolved by SDS-PAGE and standard western analysis was performed using anti-GST (B-14: sc-138, Santa Cruz Biotechnology) and anti-SRSF10 (ab77209, Abcam) antibodies.
Compounds that were screened represent a subset produced according to the protocol described in Cheung et al. (21). Compounds were screened for BCLAF1 splicing in HCT116 cells by incubating cells with 10 μM of each compound for 48 h. The protocol for screening the NCI panel of 60 cell lines consisted in incubating cells with 10 μM of GPS167 and monitoring growth after 48 h of treatment. The number reported is growth relative to the no-drug control, and relative to the time zero number of cells. More details on growth conditions can be found at https://dtp.cancer.gov/discovery_development/nci-60/methodology.htm.
Transcriptome analysis, qPCR and RT-PCR
Total RNA was extracted using RNAeasy kit from Qiagen. RNA-seq was performed by The Centre for Applied Genomics at The Hospital for Sick Children, Toronto. Briefly, poly-A RNA libraries were prepared according manufacturer's instructions and run on an Illumina HiSeq 2500 machine for sequencing. We obtained 95 million reads on average for each sample and the read length was 126 bp. The raw sequencing data was preprocessed using Trimmomatic (22) to remove adapter read-through and trailing low-quality bases. The reads were aligned to the transcriptome reference sequence database (GRCh38 GENCODE V24) using Bowtie 2 (23). The abundance of transcripts was quantified in transcript-per-million (TPM) using RSEM (24). Alternative splicing was quantified by calculating the percent spliced in (PSI) from transcript expression data based on alternative splicing event annotation database extracted from GENCODE V24. Isoform expression above the 10 TPM cut-off was considered as a true event. For alternative splicing RT-PCR, RNA integrity was tested Agilent 2100 Bioanalyzer (Agilent Technologies) and reverse-transcribed using random hexamers. Used 10 ng cDNA for each 10 μl end-point PCR reaction containing 0.2 mM each dNTP, 0.6 μM each primer, and 0.2 units of TransStart FastPfu Fly DNA Polymerase (Trans). The amplified PCR products were analyzed by automated chip-based microcapillary electrophoresis on Labchip GX Touch HT instruments (PerkinElmer). PSI were calculated for each ASE as the percentage of long splice variant over the sum of both large and small variants. Quantitative PCR (qPCR) were performed in 10 μl final volume on a CFX-384 thermocycler (BioRad) with 5 μl of 2×PerfeCTa SYBR Green Supermix (Quantabio), 10 ng cDNA and 200 nM primer pair solutions. Relative expression levels were quantified with qBASE framework (25) and the housekeeping genes YWHAZ, MRPL19 and PUM1. RT-PCR and qPCR and RNA-Seq analyses were performed by the Université de Sherbrooke RNomics Platform (https://rnomics.med.usherbrooke.ca). Primers for the detection of splice variants are listed in Supplementary Table S2. For other RT-PCR analyses to study alternative splicing of endogenous or minigene-derived transcripts, total RNA was extracted using TRIzol (Invitrogen) and procedures were performed as described previously (26).
Mass spectrometry analysis
HCT116 cells were transfected with the plasmid expressing Flag-SRSF10 and treated or not with GPS167 or GPS192. Collected cells were washed twice with ice-cold PBS and lysed on ice for 30 min in NET-2 buffer (50 mM Tris–HCl, pH 7.4, 150 mM NaCl, 0.05% (vol/vol) Nonidet P-40 supplemented with EDTA-free protease and phosphatase inhibitors cocktail (Roche Diagnostics GmbH)]. The lysates were clarified by centrifugation at 13 000 × g for 15 min. RNase A (0.1 mg/ml cellular lysate) was added. SureBeads™ protein G magnetic beads (BioRad) coupled with monoclonal anti-FLAG M2 antibody (F3165, Sigma Aldrich) were added to pre-cleared Flag-SRSF10-containing cell lysates. After overnight incubation at 4°C, beads were magnetized and washed 3× with NET2 buffer and 3× with 20 mM NH4HCO3. Beads were resuspended in 50 μl of 20 mM NH4HCO3 containing 1 μg of Trypsin Gold (Promega) and incubated overnight at 37°C. The reaction was stopped by adding formic acid to 1% final concentration. The supernatant was transferred to a new tube, while beads were resuspended in 50 μl of a solution containing 60% acetonitrile, 0.1% formic acid and incubated for 5 min at room temperature. Both supernatants were pooled and lyophilized. Peptides were resuspended in 30 μl of 0.1% of trifluoroacetic acid and desalted using ZipTip C18 (Millipore). Eluted peptides were lyophilized and resuspended in 25 μl of 1% formic acid. Trypsin digested peptides loaded onto an Acclaim PepMap100 C18 column (0.3 mm id × 5 mm, Dionex Corporation) were separated using a Dionex Ultimate 3000 nanoHPLC system. The HPLC system was coupled to an OrbiTrap QExactive mass spectrometer (Thermo Fisher Scientific Inc.) via an EasySpray source. Data acquired using the Xcalibur software were processed, searched and quantified using the MaxQuant software package version 1.4.1.2 (27).
In vitro kinase assays
All in vitro kinase assays were performed according to the kinases supplier's instructions. Thirty-five nanogram each of kinase and substrate were incubated in 5 mM MOPS pH 7.2, 2.5 mM β-glycerophosphate, 5 mM MgCl2, 1 mM EGTA, 0.4 mM EDTA and 50 μM at 30°C for 15 min in the presence of 50 μM ATP and 1 μCi γ-[32P]-ATP. Reactions were stopped by adding SDS loading buffer and heated at 85°C for 5 min. Reaction products were resolved on SDS-PAGE gels followed by phosphorimaging analysis.
Immunoblot and phenotypic assays
Apoptosis markers PARP cleavage and cleaved Caspase-3 levels were monitored to detect apoptosis. PARP cleavage was detected by western blot analysis. Cleaved Caspase-3 positive cells were quantified by immunostaining using anti-cleaved caspase 3 antibody and propidium iodide staining followed by FACS analysis. Colony assays were performed as previously reported (28). Briefly, 1 × 10⁴ HCT116 cells were seeded and cultured in normal media for 2 weeks. Colonies were fixed and stained with a 0.5% crystal violet solution containing 20% methanol. Images were captured followed by analysis to determine colony size and numbers. For the scratch assay, monolayers of cells were wounded with a longitudinal scratch. The cells were washed once with growth medium before incubation for 96 h at 37°C. Cell viability assays were performed using luminescent CellTiter-Glo kit (Promega) that quantifies cellular ATP levels according to the manufacturer's protocol. Cells were treated with the selected compounds and viability was monitored at 8-h intervals over 48 h on a luminescence plate reader. The CellTox Green Cytotoxicity Assay kit (Promega) was used according to instructions provided by the manufacturer. This assay is based on fluorescence signal enhancement upon binding of Green dye to DNA from compromised cells with impaired membrane integrity. Cells were monitored for cytotoxicity over 72 h after treatment with the compound on a fluorescence plate reader. Viability of CRC organoids was monitored by Alamar Blue assays. The organoids were plated at 20–30% density and grown for 3–5 days followed by treatment with the compound for up to 120 h. To monitor viability at each time point, we added a 1/10th volume of Alamar Blue reagent to the wells and incubated for 3 h. Results were recorded using a fluorescence plate reader.
Caspase 3/7 activity was assessed using the Caspase-Glo 3/7 Assay kit (Promega) following the manufacturer's protocol. A proluminescent caspase 3/7 substrate cleaved by caspases 3/7 liberates a free aminoluciferin that is used by luciferase to generate a luminescent signal.
Global p53 antibody was from Santa Cruz Biotechnology Inc. Anti-phospho-histone H2AX (Ser139) was the JBW301 monoclonal antibody from Millipore.
CRISPR-based chemogenomic screens
The Extended Knockout (EKO) pooled lentiviral library of 278 754 sgRNAs targeting 19 084 RefSeq genes, most with 10 guides per gene, 3872 hypothetical ORFs and 20 852 alternatively spliced isoforms was introduced within a clone of the NALM-6 pre-B lymphocytic cell line with a doxycycline-inducible Cas9 was described previously (29). NALM-6 cells at 200 000 cells per ml were exposed for a period of 3 days to a range of concentrations for each drug (GPS167, TG003, KH-CB19), followed by assessment of cell proliferation by CellTiter-Glo assay (Promega) using a Biotek Synergy Neo multi-mode microplate reader. From these dose–response curves, we estimated that concentrations of 813 nM for GPS167, 50 μM for KH-CB19 and 20 μM for TG003 would inhibit growth sufficiently to observe growth rescue phenotypes in CRISPR screens while still allowing enough growth to also observe drug sensitivity phenotypes. The EKO library (kept at a minimum of 250 cells per sgRNA) was thawed and cultured in 10% FBS RPMI supplemented with 2 mg/ml doxycycline for a period of 8 days to induce knockouts with dilutions to 400 000 cells per mL every 2 days. After 8 days, 70 × 106 cells were spun at 1200 rpm for 5 min, washed with 1× PBS, pelleted and frozen (i.e. day 0 control for the screens). The library was left to expand 8 more days without doxycycline either in the presence of one of the three compounds (a total of 100 cells per sgRNA on average) or media only (250 cells per sgRNA). Cell concentration was assessed every 2 days and cells diluted back to 400 000 cells per ml whenever cell concentration was higher than 800 000 cells/ml. During this period, there were eight population doublings for the untreated control while the cells treated with GPS167, KH-CB19 or TG003 had 4.67, 3.9 and 5.35 doublings, respectively. All samples were then PBS-washed and cell pellets frozen. Genomic DNA was extracted using the QIAamp DNA blood maxi kit (Qiagen). sgRNA sequences were recovered and fitted with Illumina adaptors by PCR and NGS performed on an Illumina NextSeq 500 device (by the IRIC Genomics platform, see https://genomique.iric.ca) as previously described (29,30). Synthetic rescue/positive selection scores were determined using the RANKS algorithm (29) using sgRNA read numbers of the treated sample compared to the day 0 control whereas synthetic lethal/negative selection scores were calculated by comparing the treated sample to the day 8 control. This conservative scoring approach ensures that fitness defects caused by gene loss independent of treatment do not confound the identification of bona fide chemical–genetic interactions. Genes showing no sgRNA depletion relative to the day 0 control and no enrichment relative to the day 8 control were assigned a score of zero.
Statistical analysis
P values, paired t-tests (two-sided) and multiple t-tests (when indicated) were calculated using GraphPad Prism version 8.3.0 for Windows or R version 3.4.4.
RESULTS
GPS167 and GPS192 shift BCLAF1 splicing
The fused tetracyclic indole compound IDC16 (Figure 1A) was previously identified as a putative inhibitor of SRSF1 that prevents HIV replication (31). A small molecule library synthetic approach aimed at mimicking portions of IDC16 led to the diheteroarylamide-based compound 1C8 (Figure 1A), which also inhibits HIV replication but through its effect on SRSF10 (19,21). BCLAF1 is a cellular transcript regulated by SRSF10 (11). At 10 μM, 1C8 had a moderate impact on the alternative splicing of BCLAF1, producing a shift of approximately 10 percentage points (19). Here, we tested a subgroup of 400 IDC16 mimics incorporating a variety of linker configurations that replace the central B- and C-rings of IDC16 for their ability to reduce the production of the BCLAF1-L splice variant with greater potency than 1C8. Overall, of all the compounds tested at 10 μM, 29 produced BCLAF1 splicing shifts of 40 percentage points or greater (Supplementary Table S1). Twenty-three of the 29 compounds contained an aminothiazole carboxamide core (Supplementary Figure S1). Testing GPS167 and GPS192 (Figure 1B) indicated that 50% of the splicing response was reached with approximately 2 μM for each compound (Figure 1C).
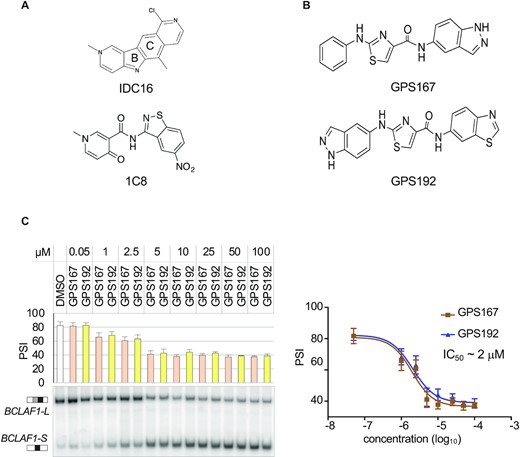
GPS167 and GPS192 modulate BCLAF1 splicing. (A) Chemical structures of IDC16 and 1C8. (B) Chemical structures of GPS167 and GPS192. (C) Endpoint RT-PCR assay to monitor change in exon 5a inclusion in the BCLAF1 transcript when human colorectal HCT116 cells are treated with different concentrations of GPS167 and GPS192 relative to DMSO. Percent Splice In (PSI) values represent the percentage of the large BCLAF1-L variant (exon 5a inclusion) over the sum of the large and short BCLAF1-S variant (exon 5a skipping). Assays were performed in triplicates for each concentration and standard deviations are shown. Differences relative to DMSO were statistically significant with P< 0.01 between 5–100 μM.
Impact of GPS167 and GPS192 on alternative splicing
To identify alternative splicing events that in addition to BCLAF1 are affected by GPS167 and GPS192, we carried out an RNA-Seq analysis of HCT116 cells treated or not with GPS167 and GPS192. One sample for each treatment was sequenced after verifying by RT-PCR that BCLAF1 exon 5a in the BCLAF1-a splicing unit shifted by more than 30 percentage points (Supplementary Figure S2a). For cells treated with GPS167 or GPS192, we respectively identified 298 and 144 alternative splicing events (ASEs) with a change in PSI (Percent Splicing In) larger than 15 percentage points, with an overlap of 66 ASEs (Supplementary Figure S2b). Fifty ASEs affected by both compounds according to RNA-Seq were tested by RT-PCR (Supplementary Figure S2c, Supplementary Tables S2 and S3). The assay validated 23 ASEs that shifted with both compounds (ΔPSI >10 percentage points with P values < 0.05): BCLAF1-a, TRA2A-a, METTL26, NUMA1, AFMID, TMEM106C, MDM2, TBL1X, AARPP19-a, BCL2L12-b, YY1AP1, CHTF8, TBRG4, VEGFA-b, GADD45A, RAD17, USF2, FBXO44, BCLAF1-b (exon 11), HAX1, FLNB-b, SLK, MDM4. There was a moderately good correlation in the amplitude of the shifts observed with the two compounds (Figure 2A).
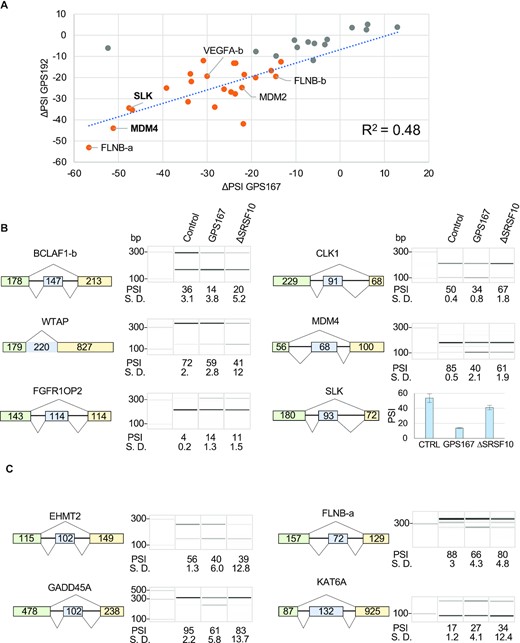
Impact of GPS167 and GPS192 on alternative splicing in HCT116 cells. (A) The differences in Percent Splicing In (ΔPSI, relative to DMSO) of 37 alternative splicing events (ASEs) identified from RNA-Seq and tested by endpoint RT-PCR are plotted to compare the amplitude of the splicing shifts (ΔPSI) imposed by GPS167 (x-axis) and GPS192 (y-axis). Overall, 23 ASEs are confirmed as common hits (ΔPSI larger than 10 percentage points with P values > 0.05, orange dots) while 14 showed ΔPSI between 0 and 10% (gray dots) with at least one compound. Selected ASEs are indicated. The complete analysis on histograms is shown in Supplementary Figure S2c. (B) Examples of ASEs shifted by GPS167 that are also significantly shifted by the depletion of SRSF10 in HCT116 cells (ΔPSI > 10 percentage points with P value < 0.05). The structure of selected ASEs is shown with the size (in nucleotides) of the alternative portions and adjacent exons. The RT-PCR analysis presents electropherograms (and histograms for SLK) with molecular weight markers. The PSI values with standard deviations (S.D.) are based on triplicates. (C) Examples of GPS167 shifts that were not affected in a statistically significant manner by the depletion of SRSF10 in HCT116 cells. The remaining ASEs for the SRSF10-independent set are shown in Supplementary Figure S5a.
To assess which responsive ASEs were regulated by SRSF10, we used CRISPR-Cas9 technology to knockout SRSF10 in HCT116 cells. As expected, the depletion of SRSF10 nearly completely shifted BCLAF1 exon 5a splicing to the smaller variant in both ΔSRSF10 lines (Supplementary Figure S3a). Five other GPS167-responsive ASEs reacted to the loss of SRSF10 (ΔPSI >10 percentage points with P values < 0.05; Figure 2B, Supplementary Figure S4 and 5a; MDM4, WTAP, CLK1, BCLAF1-b and SLK1). Three additional GPS167-responsive ASEs displayed a statistically significant but smaller SRSF10-dependent shift (FGFR1OP2, VEGFA-c and ESRP1). Only two ΔSRSF10-responsive ASEs in the set (ΔPSI > |10| with P values < 0.05) were not shifted by GPS167 (MRPL51 and TMPO). Nearly all GPS167-responsive ASEs not affected by the depletion of SRSF10 remained sensitive to GPS167 in the absence of SRSF10 (Figure 2C, Supplementary Figures S4, 5a and Supplementary Table S4). These results suggest that while SRSF10 is required for the splicing impact of GPS167 on some of the transcripts, GPS167 also likely affects the activity of other splicing regulators.
GPS167 affects the phosphorylation of SRSF10 and its interaction with proteins
Small changes in the phosphorylation of splicing factors can have a large impact on splicing regulatory networks. We previously documented how oxaliplatin and the compound 1C8, by promoting the dephosphorylation of SRSF10, change how SRSF10 interacts with other splicing regulators ultimately to alter the splicing of transcripts relevant to DNA repair, cell cycle and apoptosis (16,19). It was therefore of interest to test whether GPS167/192 had a similar impact. Treatment of HCT116 cells with GPS167/192 promoted the appearance of a faster migrating endogenous SRSF10 indicative of partial dephosphorylation (Figure 3A). Likewise, GPS167/192 treatment produced a greater proportion of the dephosphorylated form of Flag-SRSF10 in HCT116 cells, with GPS167 also reducing the overall level of Flag-SRSF10 (Figure 3B). To identify dephosphorylated residues, we immunoprecipitated Flag-SRSF10 expressed in HCT116 cells treated or not with GPS167 and carried out LC/MS–MS analysis. Among the peptides that uniquely matched SRSF10, the peptide SRSRSFDYNYR carried phosphorylated serines at position 129, 131 and 133 (Figure 3C). Relative to peptide DAEDALHNLDR (part of RRM1 of SRSF10), the recovery of phosphorylated SRSRSFDYNYR was decreased 3-fold in cells treated with GPS167 (Figure 3D). Another peptide, NVADDTRSEDLR, located in the RRM of SRSF10 also showed decreased phosphorylation at serine 23 upon treatment with GPS167 (Figure 3D). In a previous study, we have shown that phosphorylated residues 131 and 133 are important for the splicing modulating activity of SRSF10-1 and for its interaction with other splicing factors (16). Although this peptide also exists in SRSF10-2, it is unclear if SRSF10-2 gets dephosphorylated by GPS167 since the gel migration of SRSF10-2 is not affected. Other dephosphorylation events likely occur elsewhere on SRSF10 because our mass spectrometry data only covered 46% of the SRSF10-1 protein (Figure 3C) with little coverage of the RS domain, which is notoriously difficult to monitor by standard mass spectrometry (32).
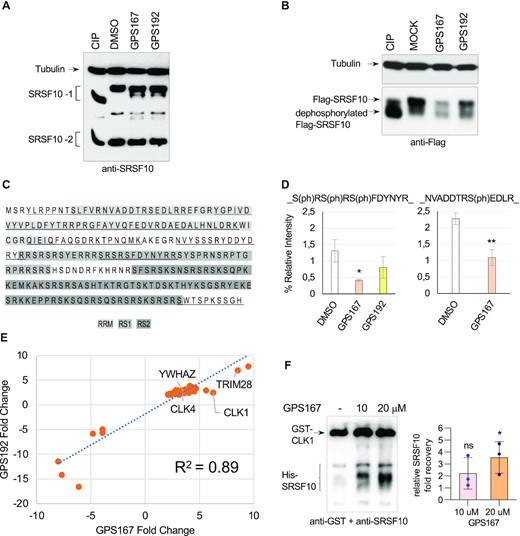
GPS167 promotes the dephoshorylation of SRSF10 and changes its interaction with partner proteins. (A) Total cellular extracts were collected 24 h after treatment or not with GPS167 or GPS192. Aliquots of the untreated cellular extract were incubated with or without calf intestinal phosphatase (CIP) for 15 min at 37°C. Proteins were fractionated on gel and transferred to nitrocellulose to reveal SRSF10. The major SRSF10 transcript contains two mutually exclusive exons, E7a and E7b, that are alternatively spliced to produce SRSF10-1 and SRSF10-2, respectively. SRSF10-1 is the full-length active SRSF10 isoform while SRSF10-2 is a much less potent regulator of SRSF10 exon 3 inclusion than SRSF10-1 (67). Tubulin was used as a loading control. (B) Flag-tagged SRSF10-1 was expressed in HCT116 cells. After 24 h of treatment with GPS167, cellular extracts were treated or not with CIP, and the tagged SRSF10 revealed in an immunoblot with anti-Flag antibodies. (C) Amino acid sequence of the SRSF10-1 protein showing the different domains (RRM, RS1 and RS2) in differently shaded boxes. The region of SRSF10 to which peptides identified by LC–MS/MS analysis mapped is underlined. (D) Proteins recovered from anti-Flag immunoprecipitations in triplicates using cells expressing Flag-SRSF10 and treated or not with GPS167 or GPS192 were analyzed by LC–MS/MS after trypsin digestion. Histograms depict the relative abundance of the SRSF10 peptide SRSRSFDYNYR derived from RS1 and containing three phosphorylated serines normalized for the recovery of the non-phosphorylated peptide DAEDALHNLDR derived from the RRM. The impact of GPS167 on another phosphorylated peptide (NVADDTRSEDLRT) is shown below. The asterisks indicate a statistically significant difference relative to the control, **P< 0.01, *P< 0.05. (E) Plot comparing proteins recovered by anti-Flag immunoprecipitation of Flag-SRSF10 and that were affected by a factor of 2 or more by both GPS167 and GPS192, each in a statistically significant manner. The list of proteins and the stimulation noted in their recovery are provided in Supplementary Table S5. (F) Results of a pull-down assay on Glutathione Sepharose 4B beads of GST-CLK1 incubated with His-tagged SRSF10 in the presence or the absence of GPS167. The fold stimulation in the recovery of SRSF10 relative to the control without GPS167 is plotted with standard deviations, *P< 0.05. Also shown is a sample immunoblot for one of the triplicate asays revealed with anti-GST and anti-SRSF10 antibodies.
The immunoprecipitation of Flag-SRSF10 from cells treated or not with compounds was used to assess if GPS167 and GPS192 promoted changes in the recovery of proteins that interact with SRSF10. Proteins recovered in the anti-Flag immunoprecipitates of RNAse-treated HCT116 extracts were analyzed by mass spectrometry. The recovery of peptides was normalized for the abundance of SRSF10 core peptides in each sample done in triplicates. This analysis identified 40 and 6 proteins that respectively increased and decreased their interaction with SRSF10 by >2-fold when cells were treated with compounds (Figure 3E and Supplementary Table S5). Among those, the recovery of the 14-3-3ζ protein (YWHAZ), which is known to interact with SRSF10 (15) increased 3-fold with GPS167/192. Notably, the recovery of the SR kinase CLK1 increased by 6.3- and 2.5-fold with GPS167 or GPS192, respectively, and that of CLK4 by 3.4- and 2.4-fold, respectively. The GPS167-mediated stimulation of the CLK1/SRSF10 interaction was confirmed by a GST-CLK1 pull-down of His-SRSF10 (Figure 3F).
GPS167 inhibits CLK kinases activity
Given that treating cells with GPS167 or GPS192 leads to a partial dephosphorylation of SRSF10 and increases the recovery of CLK1 and CLK4 in association with Flag-SRSF10, it was of interest to test whether GPS167 inhibits SR kinases, and in particular the CLK kinases. The fact that GPS167/192 shifted CLK1 splicing (Figure 2) is indicative of a functional link with CLK kinases. We therefore carried out an in vitro phosphorylation assay using recombinant His-SRSF10 and His-SRSRF1 as substrates and commercially obtained GST-CLK1, GST-CLK2 and GST-CLK4. γ32P-ATP phosphorylation assays using SRSF10 indicated that GPS167 inhibited all three CLK kinases (Figure 4). CLK1 and CLK2 inhibition by GPS167 affected the phosphorylation of SRSF10 considerably more than SRSF1 (Figure 4). CLK4 activity on both SRSF10 and SRSF1 was the most strongly inhibited by GPS167, with an IC50 of approximately 14 and 24 μM, respectively. Also of note is the apparent greater sensitivity of CLK4 autophosphorylation to GPS167 (relative to CLK1, compare gel panels A and C). Since the autophosphorylation of CLK1 has been linked to its activity (33), a stronger GPS167-mediated decrease in CLK4 autophosphorylation may possibly explain the more potent effect of GPS167 on CLK4. At the concentrations tested, GPS167 did not significantly affect GST-SRPK1 nor GST-DYRK1 activity (Figure 4). CLK4 therefore experiences the strongest inhibition with either SRSF10 or SRSF1 as substrate, whereas GPS167 inhibits CLK1 and CLK2 more effectively when SRSF10 is used as substrate. While our results demonstrate that GPS167 can inhibit CLK1, CLK2 and CLK4, but not appreciably SR protein kinases SRPK1 and DYRK1A, carrying out a full kinome screen will be required to assess the global specificity of GPS167.
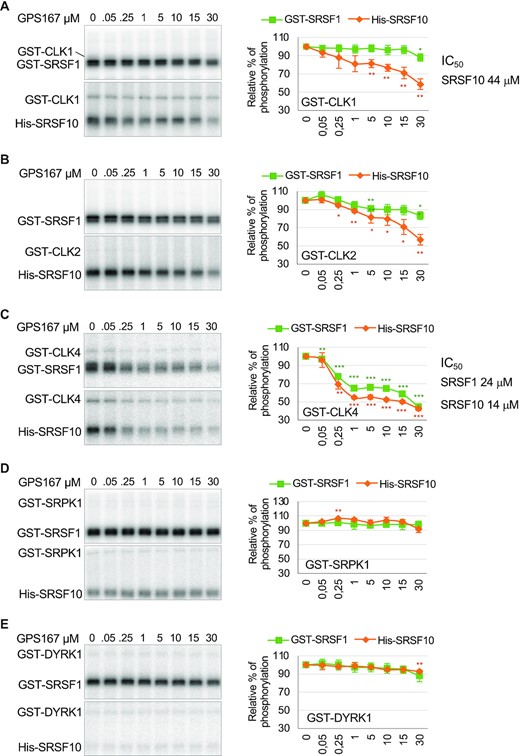
GPS167 inhibits CLK kinases. A 32P-kinase assay using commercially available recombinant CLK1 (panel A), CLK2 (panel B), CLK4 (panel C), SRPK1 (panel D) and DYRK1A (panel E) on His-SRSF10 and GST-SRSF1 in the presence of various concentrations of GPS167. Based on triplicate assays, values obtained by PhosphorImager were plotted in graphs. The asterisks indicate a statistically significant difference relative to the control, ***P< 0.001, **P< 0.01, *P< 0.05. IC50 values are given when total activity was brought down to <50% of the values without compounds.
To assess the impact of GPS167 and GPS192 on SRSF10 activity we relied on a Bcl-x splicing reporter assay in EcR-293 cells used previously for 1C8 (19). Because the compounds alone do not affect splicing of the reporter (see control in Figure 5A), the assay allows to determine if the compounds affect the activity of transiently expressed SRSF10 (or any other transiently expressed regulator) that modulates splicing of the reporter transcript. When applied to cells for 48 h, GPS167 and GPS192 antagonized the modulating activity of transiently expressed Flag-SRSF10 in EcR-293 cells (Figure 5A and B). Testing the compounds on the activity of other transiently expressed SR proteins indicated a modest but statistically significant effect on the activity of Myc-SRSF2, Myc-SRSF4 and GFP-SRSF7, but no significant impact on His-SRSF1 and Myc-hTRA2β. His-SRSF9 and Myc-Tra2α were minimally affected by GPS167 but not by GPS192, while the reverse was observed for Myc-SRSF3.
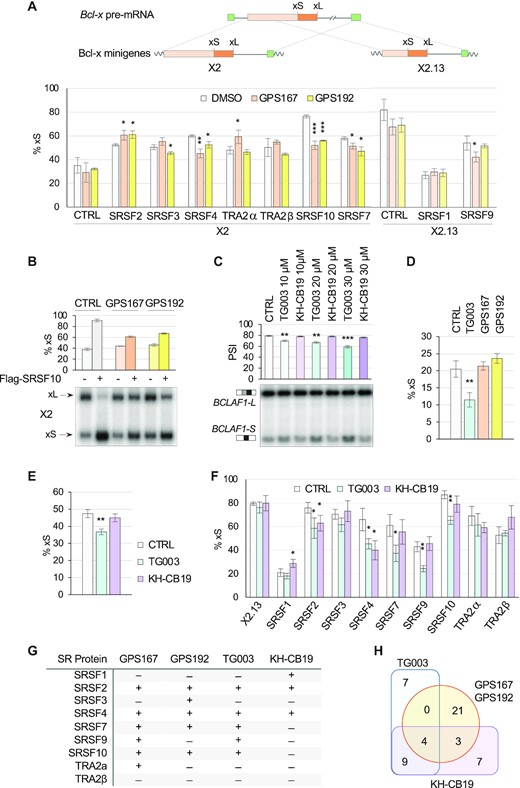
GPS167/192 and SR protein function. (A) EcR-293 cells were treated for 24 h with 10 μM of GPS167 or GPS192 after transfection of SR protein expression plasmids and the Bcl-x minigene X2 or X2.13. RT-PCR assays performed in triplicate were used to detect Bcl-xL and Bcl-xS splice variants, and results were compiled to produce the graphs. The structure of Bcl-x minigenes X2 and X2.13 is shown. (B) Using the same assay as in panel A, radiolabeled RT-PCR products were fractionated on acrylamide gels. Only one sample per triplicate is shown. The average percentages of the Bcl-xS variant are provided as well as standard deviations. (C) HCT116 cells treated with KH-CB19 and TG003 to test endogenous BCLAF1 alternative splicing of exon 5a by RT-PCR. (D) RT-PCR assay that measures the impact of compounds on the production of endogenous Bcl-xS in EcR-293 cells. (E) RT-PCR assay that measures the impact of compounds on Bcl-x reporter X2 splicing after transfection in EcR-293 cells. (F) RT-PCR assay to test the impact of compounds on the activity of SR proteins using the Bcl-x splicing reporter X2.13 in EcR-293 cells. (G) Summary table of the effect of compounds on the splicing activity of the various SR proteins. (H) Venn diagrams showing the distribution of common and unique ASEs whose splicing were altered by CLK kinase inhibitory molecules GPS167/192, TG003 and KH-CB19. A total of 47 ASEs were tested. A shift was considered when the ΔPSI was greater than 5 percentage points and detected in two or more samples. Common ASEs reactive to all CLK inhibitors (and shifting in same direction) were NAB2, FBXO44, DDR1 and GADD45A. Asterisks indicate statistical significance (***P< 0.001, **P< 0.01, *P< 0.05) with n = 3 technical replicates.
The impact of GPS167 and GPS192 on splicing and SR protein activity led us to compare this effect with that of the other CLK inhibitors TG003 (34) and KH-CB19 (35). TG003 had a modest effect on endogenous BCLAF1 splicing, while KH-CB19 had no impact (Figure 5C). In contrast to GPS167/192, TG003 affected the splicing of endogenous Bcl-x transcripts (Figure 5D) and the splicing of transcripts derived from our X2 Bcl-x reporter (Figure 5E, and compare to Figure 5A for GPS167/192). Because of this activity by TG003, we cannot easily assess its impact on SR protein activity using X2. To circumvent this problem, we used the Bcl-x reporter X2.13 whose splicing is not affected by TG003 and KH-CB19 (Figure 5F). TG003, like GPS167/192, did not affect SRSF1 activity, while KH-CB19 had a minor impact (Figure 5F). TG003, but not KH-CB19, affected SRSF9 activity in a statistically significant manner (Figure 5F). In contrast to GPS167/192, which stimulated the activity of SRSF2 (Figure 5A), TG003 and KH-CB19 elicited a reduction in its activity. While GPS167/192 slightly inhibited SRSF7 (Figure 5A), TG003 stimulated SRSF7, and KH-CB19 had no impact (Figure 5F). TG003 like GPS167/192 but not KH-CB19 inhibited SRSF10 (Figure 5F). A summary of the activity of GPS167 and GPS192 on X2, and TG003 and KH-CB19 on X2.13 is shown in Figure 5G. We also compared the impact of TG003 and KH-CB19 on alternative splicing. We tested 47 ASEs, of which 28 were altered by GPS167/192 (ΔPSI > 5 percentage points). Only 4 of the 28 GPS167/192-modulated ASEs were similarly shifted by TG003 and KH-CB19 (NAB2, FBXO44, DDR1 and GADD45A; Figure 5H and Supplementary Tables S2, S3 and S6). Thus, although some overlap is seen, the impact signatures of different CLK inhibitors on SR protein activity and alternative splicing are considerably different.
GPS167 impairs the growth of cancer cell lines
Zhou et al. (11) showed that depleting SRSF10 with shRNAs compromised the growth in culture of RKO and HCT116 cells, and decreased tumor formation of RKO cells in mouse xenograft models. Thus, altering SRSF10 activity may have anti-cancer potential. We tested the impact of GPS167 and GPS192 on several CRC lines and normal colonocytes. GPS167/192 promoted a shift towards the BCLAF1-S variant not only in HCT116 cells but also in the colorectal cancer cell lines SW680, Colo205 and Caco-2 (Figure 6A). Notably, this shift was not detected in the normal colonocyte cell line CRL-1831, which expresses considerably less SRSF10 (Figure 5D). We used the CellTiter-Glo assay (Promega) to monitor cell viability (ATP levels). GPS167/192 compromised viability of HCT116, Colo205, SW620 and Caco-2 cells (Figure 6B). The normal colonocyte line CRL-1831 was the least affected by this treatment whereas the normal colonocyte line CRL-1790 was moderately affected (Figure 6B). We next carried out a CellTox-Green assay (Promega) to measure cytotoxicity based on the release of DNA due to loss of membrane integrity. After 72 h of treatment with GPS167, Colo205, HCT116 and SW620 cells were the most affected by GPS167 (Figure 6C). The normal colonocyte lines CRL-1831 and CRL-1790 as well as the Caco-2 cell line were the least affected (Figure 6C). While Caco-2 cells are derived from a colon adenocarcinoma, they differentiate into normal looking differentiated enterocytes (36). An immunoblot analysis indicated that SRSF10 was expressed in all cancer lines but was considerably less abundant in the normal colonocyte lines CRL-1831 and CRL-1790 (Figure 6D). Our results indicate that GPS167 impairs the viability of all CRC cell lines including KRAS-mutated HCT116 and SW620, and BRAF-mutated Colo205, but has a lower impact on normal human colonocytes.
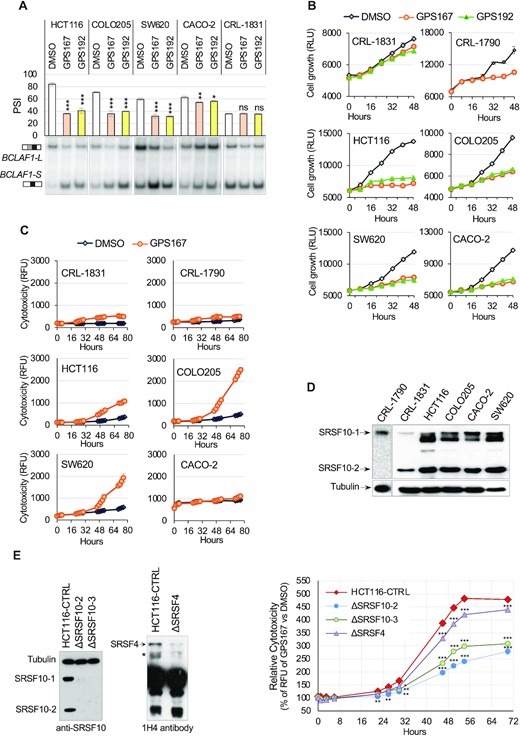
Growth and cytoxicity impact of GPS167 and GPS192 on colorectal cancer cell lines. (A) Impact of GPS167 and GPS192 on the alternative splicing of exon 5a in BCLAF1 as measured by endpoint RT-PCR. Average of triplicates and standard deviations are shown in the graph showing PSI values. One sample of each group was fractionated on a native gel to visualize the BCLAF1-L and BCLAF1-S splice variants. Asterisks indicate statistical significance (***P< 0.001, **P< 0.01, *P< 0.05) with n = 3 technical replicates. (B) The CellTiter-Glo assay (Promega) was used to monitor growth (ATP levels). (C) The fluorescent CellTox-Green assay (Promega) was used to measure cytotoxicity in 6 different cell lines (n = 6 technical replicates). (D) Immunoblot analysis with anti-SRSF10 antibody in different cell lines. The anti-tubulin antibody was used to assess loading. (E) SRSF10 and SRSF4 depletion in HCT116 cells was ascertained by immunoblotting using the anti-SRSF10, and the 1H4 antibody that recognizes a phosphorylated epitope in SR proteins. The position of SRSF4 based on size is indicated and the asterisk indicates proteins that may correspond to SRSF4 isoforms or fragments. A cytotoxicity assay (CellTox-Green assay) was performed with 20 μM of GPS167. The values are expressed as percentages expressing the impact of the drug relative to the DMSO control (100%) associated with each data point. Asterisks indicate statistical significance (***P< 0.001, **P< 0.01, *P< 0.05) by performing a multiple t test analysis.
The NCI-60 tumor cell lines screening service at NIH/NCI was used to test the impact of GPS167 on the growth of a panel of cell lines from different types of cancer (37). The results indicated that GPS167 exhibited a broad range of anti-proliferative effect (Supplementary Figure S6a). The results confirmed the impact of GPS167 on HCT116, Colo205 and SW620. The KRAS-mutated HCT15 and BRAF-mutated HT29 were the most sensitive in the panel of CRC cell lines, whereas the highly differentiated HCC-2998 colon cancer cell line was the least responsive CRC line. Cancer cell lines representing other types of cancer were also sensitive. Among the most responsive lines were the breast cancer cell line MCF7, the triple negative (ER-, PR-, HER2-) breast cancer MDA-MB-468 cell line (also inhibited by T-025 a potent CLK2 inhibitor (38)), the melanoma MDA-MB-465 cell line, the renal cancer RXF393 cell line, the ovarian cancer cell line OVCAR-3, the non-small cell lung cancer NCI-H460 and NCI-H522 cell lines, as well as most leukemia cell lines. The magnitude of the GPS167 effect on growth displayed a good match to the overall level of CLK expression since lower CLK expressors were significantly less sensitive to GPS167 than high CLK expressors (Supplementary Figure S6b). A similar analysis performed on the expression of 10 individual SR proteins including SRSF10 did not reveal notable correlations, while compiling their cumulative expression indicated that the effect of GPS167 on growth was stronger in cell lines that expressed more transcripts encoding SR proteins (Supplementary Figure S6b, c).
To assess the contribution of SRSF10 to the GPS167-mediated growth inhibition and cytotoxicity, we used our HCT116 cells knocked out for SRSF10. The growth of two cell populations of ΔSRSF10-HCT116 cells displaying a near complete shift in BCLAF1 splicing (Supplementary Figure S3a) was not affected when compared to parent cells or a ΔSRSF4-HCT116 cell population (Supplementary Figure S7a). A limited contribution of SRSF10 to cell growth is consistent with the observation that mouse embryos lacking SRSF10 can develop nearly normally until birth (14). Compared to control HCT116 cells and ΔSRSF4-HCT116 cells, the growth of ΔSRSF10-HCT116 cells remained similar in the presence of GPS167 (Supplementary Figure S7b). However, the cytotoxic effect of GPS167 on ΔSRSF10-HCT116 cells was reduced considerably more than on ΔSRSF4-HCT116 relative to control HCT116 cells (Figure 6e).
Treating HCT116 cells with GPS167 or GPS192 stimulated apoptosis based on PARP cleavage and the percentages of cleaved CASP3 positive cells (Figure 7A, B). GPS167 and GPS192 promoted PARP cleavage also in Colo205 and SW620 cells but not in Caco-2 cells (Figure 7A), consistent with the non-toxic effect of GPS167 on this cell line (see Figure 6C). GPS167/192-mediated PARP cleavage was not detected in the normal colonocyte line CRL-1831 (Figure 7A). Caspase-3 cleavage in the presence of GPS167 was also lowest for Caco-2 and the two normal colonocyte lines (Supplementary Figure S7c). GPS167 also decreased anchorage-independent colony formation of HCT116 cells both in size and number (Figure 7C), and compromised cell migration as monitored through a scratch-wound assay (39) (Figure 7D).
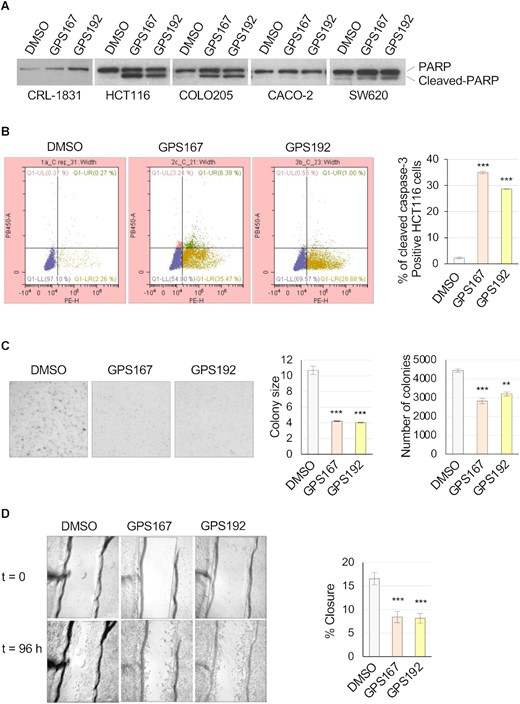
Phenotypic impact of GPS167 and GPS192. (A) PARP1 cleavage assay following treatment of various colorectal cancer cell lines with GPS167 or GPS192. Treatment was for 48 h before total proteins were fractionated and an immunoblot performed to reveal PARP1 and its cleavage product. (B) HCT116 cells treated as in panel A analyzed by FACS to quantify cleaved caspase-3 positive cells. Q1-LL is showing only PI-stained cells and Q1-LR is showing cleaved caspase-3 positive cells. (C) Colony formation and colony size assay. (D) Scratch assay with graphical representation based on n = 3 technical replicates. Asterisks indicate statistical significance (***P< 0.001, **P< 0.01).
GPS167 is cytotoxic for human colorectal cancer organoids but not normal organoids
CRC cell lines differ from primary cancer cells from which they are derived by having acquired mutations or epigenetic alterations that may change their responses to drugs. CRC organoids have emerged as a powerful three-dimensional system to test the therapeutic potential of drugs (40–42). CRC organoids retain histological and molecular features that are similar to in vivo tumors from which they are derived, allowing a better understanding of mechanisms underlying anti-tumorigenic effects of therapeutic treatments.
We tested the impact of GPS167 using four human colorectal organoid lines (two cancer and two normal lines). Notably, the long BCLAF1-L variant is the predominant variant in the CRC organoid lines CCOL-01 and CCOL-11 and in the normal-matched colon organoid line CNOL-11 (Figure 8A). GPS167 shifted BCLAF1 splicing to the shorter variant in the CRC organoids but not in the normal organoid line (Figure 7A). SRSF10 protein expression was higher in the CRC organoid line CCOL-11 than in the normal organoid line CRC-MOL (Figure 8B). Reminiscent of the impact of GPS167 on Flag-SRSF10 in HCT116 cells (Figure 3B), GPS167 promoted the production of faster migrating species that may represent dephosphorylated forms of SRSF10 in CCOL-11 that were not detected in the normal organoid line CRC-MOL (Figure 8B).
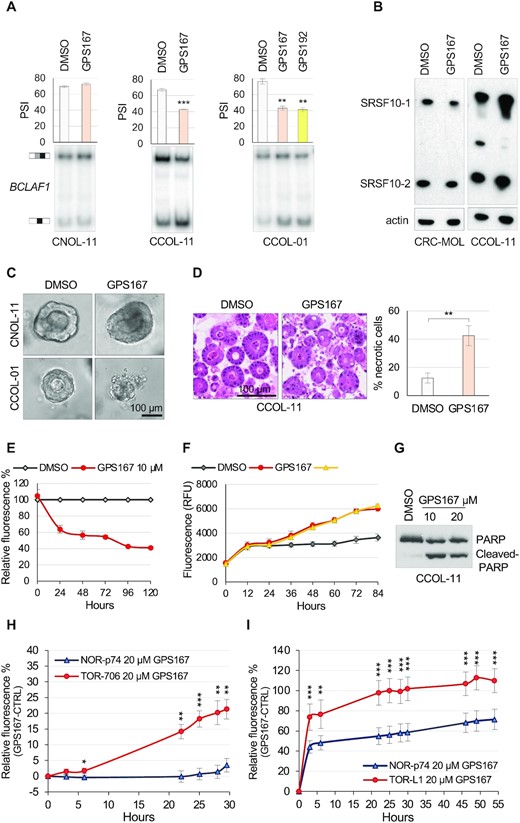
Impact of GPS167 on colorectal organoids. (A) RT-PCR assay to monitor BCLAF1 alternative splicing of exon 5a in the normal (CNOL-11) or cancer (CCOL-01 and CCOL-11) colorectal organoid lines in the presence or the absence of 10 μM of GPS167 or GPS192. (B) Impact of GPS167 on the expression of SRSF10. Immunoblotting was used to detect SRSF10 proteins in normal (CRC-MOL) and cancer (CCOL-11) colorectal organoids treated or not with 10 μM of GPS167 for 72 h. The two forms of SRSF10 are indicated. (C) Representative images of a typical single normal (CNOL-11) or cancer (CCOL-11) organoid before and after treatment with GPS167 (or DMSO as control). (D) Haematoxylin and eosin staining of the cancer organoid line CCOL-11 that was treated or not with GPS167. The number of necrotic cells was estimated visually. Necrosis designates the presence of dead cells regardless of pre-lethal processes. (E) The Alamar Blue assay was used to monitor growth of GPS167-treated and untreated CCOL-11 cells. The values were normalized for untreated cells. (F) The CellTox-Green assay was used to monitor cytotoxicity of treated and untreated CRC organoids (CCOL-11). (G) A PARP cleavage assay was used to monitor apoptosis on the same samples as used in panel F. (H) Cytotoxicity assay monitoring the differential cytotoxic response of GPS167 relative to DMSO in normal organoids from a wild-type mouse (NOR-p74) or a cancerous organoid from a carcinoma developed in a Apcmin/+ mouse (TOR-706). (I) Cytotoxicity assay monitoring the differential cytotoxic response of GPS167 relative to DMSO in normal organoids from a wild-type mouse (NOR-p74) or a cancerous organoid from a mouse colorectal tumor induced by azoxymethane/dextran sodium sulfate (TOR-L1). Asterisks indicate statistical significance (***P< 0.001, **P< 0.01, *P< 0.05). Multiple t-tests and n = 5 technical replicates were performed for panels H and I; n = 3 for the others.
Visual inspection of the structural features of treated human colorectal organoids indicated that GPS167 disrupted organoid-like structures in the CRC organoid line CCOL-01 but not in the normal organoid line CNOL-11 (Figure 8C), and produced more necrotic cells in the CRC organoid line CCOL-11 (Figure 8D). A cell viability assay on CCOL-11 treated with GPS167 using Alamar Blue to monitor survival indicated growth inhibition (Figure 8E), whereas the CellTox-Green assay and a PARP cleavage assay respectively indicated cytotoxicity and apoptotic cell death in CCOL-11 treated with GPS167 (Figure 8F, G). We did not observe an effect of GPS167 on the normal-matched CNOL-11 organoid line (Figure 8C). As human normal colorectal organoids are notoriously difficult to grow, we could not get enough of them to carry out a reliable cytotoxic assay. As an alternative, we tested the impact of GPS167 on mouse CRC organoids derived from carcinomas of Apcmin/+ mice and normal colon epithelium from wild-type mice. Compared to DMSO, GPS167 promoted cytotoxicity on the tumor-derived TOR-206 organoid line but not on the normal NOR-p74 organoid line (Figure 8H). We also tested organoids derived from a mouse model of inflammatory colorectal cancer induced by azoxymethane (AOM)/dextran sodium sulfate (DSS), that produces tumors with histopathological features closely resembling human ones (43). Here again, the mouse CRC organoid line TOR-L1 was more sensitive to GPS167 than the normal organoid line (Figure 8i).
The human CRC organoid line CCOL-11 was interrogated for alternative splicing changes elicited by GPS167 (Supplementary Figures S5c, S8 and Supplementary Table S3). Eight of the 28 GPS167/192-responsive ASEs in HCT116 cells were reactive to GPS167 in CCOL-11 cells (e.g. HRAS, NAB2, NUF2, TRA2A-b, TBRG4, DDR1, CLK1 and BCLAF1-a) of which BCLAF1-a and CLK1 were reactive to the depletion of SRSF10 in HCT116 cells (see Figure 2, Supplementary Figure S4 and Supplementary Figure S5a).
GPS167 elicits p53-dependent cytotoxicity
To gain insight into the molecular genetic pathways affected by GPS167, we carried out whole-genome CRISPR/Cas9 knockout screens using the Extended Knockout (EKO) library of over 275 000 single-guide RNAs (∼10 guides per gene) and the B cell precursor leukemia cell line NALM-6, as described previously (29) (Figure 9A). We note that leukemia cell lines (e.g. HL-60 and K-562) were among the most sensitive to GPS167 in the NCI-60 screen (Supplementary Figure S6). In these chemogenomic screens, we compared the effects of GPS167 versus the known CLK kinase inhibitors TG003 and KH-CB19 (Figure 9B–D, Supplementary Figure S9A–C, Supplementary Table S7). Notably, for TG003 and KH-CB19, the screens identified a synthetic lethal interaction with CLK3, which is only weakly inhibited by TG003 and KH-CB19 (35), and thus likely facilitates cell growth in the presence of these inhibitors. For GPS167, the chemogenomic screen identified genes such as ATAT1, KIF18B and TP53 whose knockout improved growth in the presence of GPS167 (Figure 9B and Supplementary Table S7). As NALM-6 is wild-type for p53, the rescue of drug-induced lethality by loss of p53 suggests that p53 is a mediator of this lethality. Furthermore, CCNB1, whose silencing has been associated with p53 activation (44,45), was synthetic lethal for GPS167, along with other genes with established links to p53 such as TCF4, TCF3 and UBE4B (46–48). Based on these results, we interrogated our RNA-Seq data on gene expression in HCT116 cells, concentrating on the 130 genes with a ≥2-fold expression difference under both GPS167 and GPS192 treatments (out of approximately 7000 genes) (Supplementary Table S8). A functional analysis with the GSEA software identified 10 genes in the p53 functional cluster as the most statistically significant pathway being affected (Supplementary Figure S9d). Collectively, these results suggest that p53 helps mediate the negative effect of GPS167 on cell growth and viability.
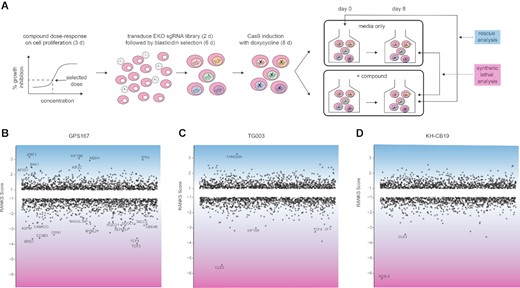
CRISPR-based chemogenomic screens with GPS167, TG003 and KH-CB19. (A) Schematic overview of whole genome pooled CRISPR screens carried out in the NALM-6 cell line. (B–D) CRISPR screen RANKS scores for (B) GPS167, (C) TG003 and (D) KH-CB19. Positive scores and blue shading indicate a drug-resistant (rescue) phenotype while negative scores and pink shading indicate a drug-sensitive (synthetic lethal) phenotype. Genes with scores >1 or <–1 are shown. Labelled genes indicate significant hits (FDR < 0.05) in each screen.
Other synthetic lethal hits suggested an increased sensitivity to spindle assembly or checkpoint dysfunction, including MYBL2, CCNB1, SGOL1, MAD2L1BP, ASPM, CAMK2G, DSN1 and TACC3; several top rescue hits including ATAT1, KIF18B and KIF2C are similarly linked to mitotic spindle functions. Indeed, among the top 50 synthetic lethal genes, all of the 10 most significantly enriched Gene Ontology terms were related to the mitotic cell cycle checkpoint or chromosome segregation (Supplementary Figure S9e). Six of these genes also show ≥2-fold differential mRNA expression in GPS167-treated HCT116 cells, representing a significant overlap (P = 0.011, Fisher's exact test, Supplementary Figure S9f). These genes included MDM2, as well as BUB1 and NDC80, components of the mitotic checkpoint and kinetochore complex, respectively (Supplementary Figure S9e). Notably, alternative splicing events affected by GPS167 (Supplementary Figure S4) occur in transcripts encoding a microtubule binding protein (NUMA1) and a kinase regulating microtubule organization (SLK) (49,50).
To confirm the role of p53, we tested the impact of GPS167 on HCT116 p53 −/− cells. Compared to HCT116 p53 +/+ cells, the absence of p53 reduced the impact of GPS167 on growth inhibition (Figure 10a). Moreover, the GPS167-mediated impact on cytotoxicity and caspases 3/7 activity were significantly lower in HCT116 p53 −/− cells than in p53 +/+ cells (Figure 10B, C). Thus, p53 is required for maximal growth inhibition and toxicity of GPS167 on HCT116 cells. Notably, TG003 was not cytotoxic to HCT116 cells at the concentration tested (Figure 10d). To extend the p53 relationship to other colorectal cancer cell lines, we tested the impact of an inhibitor of p53, pifithrin-α, on the GPS167-mediated cytotoxic response in LoVo, RKO and SW48 cells. In all cases, pifithrin-α elicited a statistically significant drop in the cytotoxic response (Supplementary Figure S10).
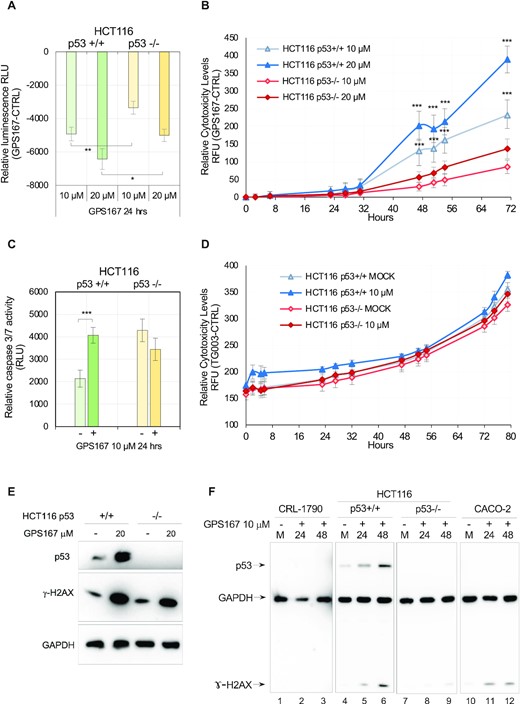
p53-dependent impact of GPS167 on growth and cytotoxicity. (A) The CellTiter-Glo assay was used to monitor the impact of GPS167 on growth after 24 h. Asterisks indicate statistical significance between p53 +/+ and p53 −/− HCT116 cells at similar concentrations of GPS167. n = 6 technical replicates. (B) The CellTox-Green assay was used to monitor cytotoxicity of treated and untreated p53 −/− and p53 +/+ HCT116 cells at different times and two concentrations of GPS167. Multiple t tests and n = 6 technical replicates were used to calculate significance. (C) Caspase 3/7 cleavage assay performed 24 h after cells were treated with 10 μM of GPS167. n = 6 technical replicates. (D) Cytotoxic impact of TG003 on wild-type and p53 −/− HCT116 cells. (E) γ-H2AX is activated and p53 expression increases following treatment with GPS167. Twenty-four hours post-treatment with GPS167, immunoblots were performed to detect p53 and γ-H2AX. A loading control was done with the GAPDH antibody. (F) p53 and γ-H2AX expression in CRL-1790, HCT116 and Caco-2 cells following treatment with GPS167. As loading control, we used the GAPDH antibody. Immunoblots were done successively with different antibodies and then exposure was adjusted for equivalent GAPDH signals in different cell lines. Asterisks indicate statistical significance (***P< 0.001, **P< 0.01, *P< 0.05).
The impact of GPS167 on the alternative splicing of transcripts encoding components involved in p53 expression and stability (e.g. MDM2 and MDM4) led us to predict that GPS167 might increase the steady-state level of p53. This prediction was confirmed by immunoblot detection of p53 in HCT116 cells (Figure 9E, F). In two cell lines where GPS167 has little cytotoxic impact (Caco-2 and CRL-1790, see Figure 6C), p53 expression was not detected nor induced by GPS167 (Figure 9F). Notably, SRSF10 appears important for both the oxaliplatin-mediated and the GPS167-mediated increase in p53 expression since the stimulation in p53 expression was reduced in treated ΔSRSF10-HCT116 cells (Supplementary Figure S11a). In addition, HCT116 cells treated with GPS167 produced considerably more γ-H2AX, an indication of DNA damage (Figure 10E), and suggesting that p53 activation occurs in CRC cells. Consistent with this view, the level of phosphorylated p53 increased in a SRSF10-dependent manner (Supplementary Figure S11b).
DISCUSSION
GPS167: a new type of CLK inhibitor
We document the discovery and characterization of GPS167, a novel inhibitor of CLK kinases that impairs the growth of human CRC cell lines and organoids in vitro. GPS167 inhibits the phosphorylation of the splicing modulator SRSF10 by CLK1, CLK2 and CLK4 but not by the SR kinases DRPK1 and SRPK1 at similar concentrations. While most kinase inhibitors rely on ATP-mimetic hydrogen bonding to the kinase hinge region, few kinases have been successfully targeted by other binding mechanisms. For CLK1, KH-CB19 represents a non-ATP mimetic binding inhibitor that displays a better selectivity profile than typical ATP mimetic ligands such as TG003 (35). Interestingly, the central structure of GPS167 resembles the structure of inhibitors of BCR/ABL, SRC family tyrosine kinases (e.g. dasatinib) and the CHK1 kinase (Supplementary Figure S12). Thus, while the central structure of GPS167 may dictate kinase interaction at the ATP binding site, kinase specificity may be imposed by adjacent moieties.
The impact of GPS167 on the activity of CLK kinases appears to vary depending on the substrate: CLK1 kinase inhibition by GPS167 was stronger when SRSF10, rather than SRSF1, was used as a substrate. Moreover, our in vivo splicing reporter assay indicated that GPS167 impacted the activity of SRSF10, and, to a lesser extent, that of SRSF2, SRSF4, SRSF7, SRSF9 and hTRA2α, and no discernable impact on SRSF1, SRSF3 and hTRa2β. Other known CLK inhibitors had different activity profiles. The reason for SRSF10 being preferentially affected by GPS167 is unclear and will require further investigation. GPS167 stimulated the interaction of CLK1 and CLK4 with SRSF10, possibly indicating an accumulation of a blocked kinetic intermediate complex of the CLK kinases and SRSF10. Approximately half of the ASEs whose splicing was affected by GPS167 in HCT116 cells and CRC organoids were regulated by SRSF10, and only a subset was affected by TG003 and KH-CB19. Because some ASEs affected by GPS167 were insensitive to the depletion of SRSF10, GPS167 is likely altering the activity of other splicing regulators. The lack of immunoprecipitating SRSF10 antibodies currently prevents performing a CLIP-Seq analysis to identify SRSF10 binding sites in ASEs affected by GPS167. Developing tools to carry out such an analysis, as well as testing other SR proteins and splicing regulators, will be important to clarify the broader impact of GPS167.
GPS167 and colorectal cancer cell growth
GPS167 affects the growth and is cytotoxic for human CRC lines as well as human and mouse CRC organoids. In contrast, GPS167 does not affect the growth of the normal colonocyte line CRL-1831 and has low toxicity with no evidence of PARP cleavage. The growth of the normal colonocyte line CRL-1790 is affected by GPS167 but without obvious toxicity. The normal human colon organoid line was not affected by GPS167, and a mouse normal organoid line was also less affected than its CRC counterparts. The growth of Caco-2 cells was sensitive to GPS167, although no cytotoxic response nor PARP cleavage products were detected. HCC-2998 was the CRC cell line least affected by GPS167. Given that Caco-2 and HCC-2998 display high differentiating potential (36,51), our results globally indicate that GPS167 minimally affects normal colonocytes and normal colon organoids, while being more detrimental to CRC organoids and more malignant CRC lines.
SRSF10 makes an important contribution to mediating GPS167 toxicity because its genetic depletion in HCT116 cells decreased the cytotoxic response. p53 also plays an important role in triggering this cytotoxicity because HCT116 p53 −/− cells treated with GPS167 displayed reduced cytotoxicity and apoptosis. Several proteins whose interaction with SRSF10 was increased in GPS167-treated cells have a physical or functional interaction with p53 (Supplementary Table S9). These include HSPB1, CCT3 and TRIM28 (also known as KAP1). TRIM28 normally interacts with MDM2 to downregulate p53 activity (52). Whether this putative GPS167-mediated sequestration of TRIM28 occurs and contributes to the cytotoxic effects of GPS167 remains to be confirmed. On the other hand, GPS167 affected the alternative splicing of several transcripts encoding proteins known to interact physically or functionally with p53 (e.g. KAT6A, PCBP2 and EHMT2 (53–55)). Notably, GPS167 impacted the alternative splicing of MDM4 and MDM2 in a SRSF10-dependent and SRSF10-independent manner, respectively (Supplementary Table S4 and Figure 11). The GPS167-induced production of MDM2 and MDM4 variants may help increase the level of p53 because the MDM2 and MDM4 splicing shifts occurred towards inactive variants that increase the levels of p53 in motor neurons to promote cell death (56). BCLAF1 was reported as an apoptotic inducer capable of activating the promoter of p53 (57,58), although this result was not consistent with the impact of simply reducing BCLAF1-L levels by RNA interference (11). Whether the GPS167-mediated increase in BCLAF1-S might promote this activity remains to be addressed. All the above events converge on p53 and, consistently, we observed a drastic increase in the steady-state level of p53 in GPS167-treated HCT116 cells. By promoting DNA damage (Figure 10e), GPS167 may also activate p53, thereby providing the signal that will trigger apoptosis (Figure 11).
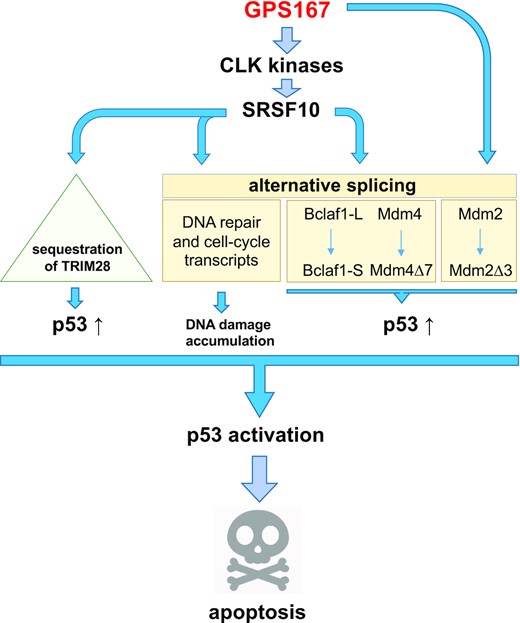
Proposed model of action for GPS167. The diagram illustrates the possible pathways through which GPS167 promotes stabilization, production and activation of p53. The model is based on GPS167-mediated alternative splicing shifts and the noted increased and potentially sequestering interaction of SRSF10 on TRIM28, which is known to interact with MDM2 to downregulate p53. GPS167 also increases the level of DNA damage, possibly by affecting the impact of SRSF10 on the alternative splicing of transcripts encoding components of the DNA repair and cell-cycle machinery (16). This pathway may activate p53 to promote apoptosis.
One possible reason for the apoptotic response occurring specifically in cancer and not in normal cells may be because of the differential expression of SRSF10. Using 293 cells, we have shown previously that SRSF10 is co-opted following DNA damage to shift the alternative splicing of transcripts coding for components of the DNA repair and cell-cycle machineries (e.g. BRCA1, RBBP8, CHK2 and MLH3) (16,59). While an assessment of the impact of a depletion of SRSF10 on these gene categories remains to be ascertained in HCT116 cells, SRSF10 may help bypass the cell-cycle checkpoint imposed by CHEK2, leading to the accumulation of DNA damage that eventually activates p53 and elicits apoptosis (Figure 11). Consistent with this view, GPS167-mediated cytotoxicity was reduced in HCT116 lacking p53 and in Caco-2 cells, which express undetectable level of p53. Moreover, normal CRL-1790 cells, which express low level of SRSF10 and undetectable p53 in our immunoblots, displayed reduced GPS167-mediated cytotoxicity and no DNA damage accumulation. Thus, the low level of SRSF10 in normal cells may not be sufficient to promote the splicing switches that normally lead to the accumulation of DNA damage and the stabilization of p53.
While an impact on growth and cytotoxicity are important parameters for anti-cancer drug efficacy, GPS167 also affects anchorage-independent growth and cell migration, which are indicators of metastatic potential. A subset of these effects may be modulated through alternative splicing. For example, GPS167 shifts splicing towards a variant of SLK that encodes a kinase lacking a portion that controls motility of breast cancer cells (60). GPS167 also promotes the production of the FLNB variant lacking exon 30 that promotes a mesenchymal cell state in breast cancer (61). GPS167 also shifts BCLAF1 splicing from the oncogenic BCLAF1-L to the non-oncogenic BCLAF1-S variant. While in our hands a complete shift to BCLAF1-S by depleting SRSF10 had no effect on cell growth in vitro (Supplementary Figures S3 and S7a), it may alter advanced stages of tumor progression (11). DDR1 splicing was also affected by GPS167 both in HCT116 cells and in CRC organoids. DDR1 is a tyrosine kinase receptor for collagens with an alternative exon that encodes a region (aa505-542) that regulates its activation state (62). Inhibiting DDR1 has been proposed as a RAS-independent therapeutic approach to treat advanced CRC (63). METTL26, NUF2 and NAB2 splicing were also affected in organoids treated with GPS167. METTL26 is overexpressed in 10% of colorectal cancer (64). NUF2 is upregulated in many cancers and its overexpression is associated with poor prognosis in patients with colorectal cancer (65). NAB2 encodes a member of the family of NGFI-A binding (NAB) proteins which repress transcription induced by members of the EGR family of transactivators.
Thus, GPS167, by targeting multiple splicing events in transcripts that are relevant to colorectal cancer, may provide a combination of alterations that impair tumor growth and metastasis. Modulating MDM4 splicing has already been brought forward as a promising strategy to reactivate p53 in cancer cells (66). The convergence of altering the splicing of MDM2 and BCLAF1 on p53 activity may further predispose p53-expressing cells to the cytotoxic effect of GPS167. Given that our results also suggest that GPS167 may interfere with microtubule dynamics, combining a CLK inhibitor that exploits p53-dependent vulnerabilities with an anti-cancer agent that targets microtubule function may synergize their individual efficacies and offer new therapeutic opportunities.
DATA AVAILABILITY
The accession codes for the RNA-Seq data of treated HCT116 cells deposited at Gene Expression Omnibus (GEO) are GSM4645101, GSM4645102, GSM4645103. The mass spectrometry proteomics data have been deposited to the ProteomeXchange Consortium via the PRIDE partner repository with the dataset identifier PXD022333. Sequencing data of the CRISPR/Cas9 chemogenomic screen are available at GEO (GSE161168).
SUPPLEMENTARY DATA
Supplementary Data are available at NAR Cancer Online.
ACKNOWLEDGEMENTS
We thank Steve Jean for CRISPR–Cas9 materials, Bruno Lemieux for purification of SRSF1 and SRSF10, Elvy Lapointe, Mathieu Durand and Philippe Thibault at the RNomics platform of Université de Sherbrooke for RT-PCR analyses and bioinformatics. The authors thank the National Cancer Institute (NCI), Bethesda, MD, USA, for testing GPS167 on the NCI-60 panel of cell lines. For human colorectal organoid lines, the authors acknowledge the support provided by the Biobanque des maladies digestives du Centre de recherche du CHUS (Biobanque du CRCHUS), CIUSSS de l’Estrie – CHUS, certified by the Canadian Tissue Repository Network and affiliated to the Réseau de recherche sur le cancer, and Karine Tremblay for management and support.
FUNDING
Canadian Association of Gastroenterology/Canadian Institutes of Health Research and Fonds de Recherche du Québec-Santé (to M.S.); Institute for Data Valorisation (IVADO) (to J.C.-H.); B.C. was Pierre C. Fournier Chair in Functional Genomics (2015–2020); M.T. holds a Canada Research Chair in Systems and Synthetic Biology; Canadian Institutes of Health Research [MOP-136948, PJT-165966 to B.C., FDN-167277 to M.T.]; Genomics Technology Platform Award from Genome Canada and Genome Quebec (to M.T. and P.T.). Funding for open access charge: Canadian Institutes of Health Research [FDN-167277, MOP-136948, PJT-165966].
Conflict of interest statement. B. Chabot declares that based on results included in this manuscript, a research contract between Université de Sherbrooke and PTC Therapeutics (Piscataway, NJ, USA) was initiated in July 2020.

Comments