


Abstract
In the search for drugs to effectively treat cancer, the last 10 years have seen a resurgence of interest in targeting ribosome biogenesis. CX-5461 is a potential inhibitor of ribosomal RNA synthesis that is now showing promise in phase I trials as a chemotherapeutic agent for a range of malignancies. Here, we show that CX-5461 irreversibly inhibits ribosomal RNA transcription by arresting RNA polymerase I (RPI/Pol1/PolR1) in a transcription initiation complex. CX-5461 does not achieve this by preventing formation of the pre-initiation complex nor does it affect the promoter recruitment of the SL1 TBP complex or the HMGB-box upstream binding factor (UBF/UBTF). CX-5461 also does not prevent the subsequent recruitment of the initiation-competent RPI–Rrn3 complex. Rather, CX-5461 blocks promoter release of RPI–Rrn3, which remains irreversibly locked in the pre-initiation complex even after extensive drug removal. Unexpectedly, this results in an unproductive mode of RPI recruitment that correlates with the onset of nucleolar stress, inhibition of DNA replication, genome-wide DNA damage and cellular senescence. Our data demonstrate that the cytotoxicity of CX-5461 is at least in part the result of an irreversible inhibition of RPI transcription initiation and hence are of direct relevance to the design of improved strategies of chemotherapy.
INTRODUCTION
The ability to precisely determine the molecular targets of small molecule drugs is key to both their further development and the logical design of better treatment strategies. Nowhere is this more evident than in the identification and use of chemotherapeutic drugs against emerging target classes. Ribosome biogenesis is one such class that has seen significant interest in the last 10 years and several new drugs are being developed as potential chemotherapeutic agents for cancer. In the search for new and novel anticancer drugs, the biosynthesis of cellular ribosomes was for a long time largely overlooked as a potential target. Generally, it was assumed that as an essential cellular function ribosome biosynthesis could not be profitably targeted in a tumour-selective manner. However, ribosome synthesis is significantly enhanced in tumour cells, making them selectively sensitive to small molecule inhibitors (1). Moreover, many genetic diseases that directly affect ribosome biogenesis display highly tissue-specific effects (2), while inactivation of essential ribosome components is not necessarily lethal in all cell types (3). Thus, ribosome biogenesis can be realistically envisioned as a potential drug target in the fight against cancer. In fact, many clinically relevant cytotoxic drugs are now known to strongly inhibit ribosome biogenesis (4–7). To what extent this inhibition is an essential part of their therapeutic efficacy has unfortunately been largely ignored.
In recent years, several small molecule cytotoxic drugs have been identified as specific inhibitors of ribosome biogenesis (8–10). CX-5461 is one such drug that has also demonstrated anticancer potential for a wide range of malignancies (9,11–23), and is presently under phase I trials for the treatment of both haematological cancers and solid tumours (24,25). CX-5461 was initially characterized as an inhibitor of the transcription of the ribosomal RNA genes (rDNA) by RNA polymerase I (RPI/PolR1/PolI) (9). As such, CX-5461 represented the first drug discovered to specifically target rDNA transcription. Since the sole function of RPI is the transcription of the rDNA, its specific drug targeting potentially provides an important tool with which to investigate the regulation of ribosome biogenesis and its role in tumour growth. However, more recently it was suggested that CX-5461 may act by stabilizing DNA G-quadruplexes (16) or by ‘poisoning’ topoisomerase II (Topo II) (26). Thus, the primary target of this drug and its mode of action are still in considerable doubt.
Eukaryotes use RPI and a dedicated transcription system to synthesize the three major RNAs of the ribosome as part of a single multi-cistronic precursor. In mice and humans, the 47S precursor RNA (47S rRNA) is transcribed from the several hundred rDNA gene units that are present as large tandem arrays at the nucleolar organizer regions (27,28). The RPI transcription system consists of the core transcription factor SL1, a complex consisting of the TATA-box binding factor (TBP) and four RPI-specific TBP-associated factors TAF1A–D, the multi-HMGB-box upstream binding factor (UBF/UBTF) and the RPI-associated factor Rrn3 (also known as TIF1A). UBF binds broadly across the rDNA to form a specialized chromatin and is believed to transiently mark the rDNA loci as potentially active. SL1 specifically recognizes two promoter sequences on each rDNA unit: one is responsible for the generation of the 47S rRNA, while the other is associated with an upstream enhancer element and is generally referred to as a ‘Spacer’ promoter (29,30). The initiation-competent RPI–Rrn3 complex is recruited to the SL1 pre-initiation complexes via Rrn3, which is then released during early elongation. In growing cells, each active rDNA unit can support >10 initiation events per minute and a loading of a hundred or more elongation complexes at a time, making these genes highly susceptible to DNA damage and recombination, and a major source of genome instability (31–33).
We now show that the primary target of CX-5461 is the initiation of transcription by RPI. CX-5461 inhibits release of the RPI–Rrn3 complex from the rDNA promoter but has no effect on either pre-initiation complex formation or ongoing transcription elongation. Surprisingly, inhibition of rDNA transcription by CX-5461 is not reversible and the RPI–Rrn3 complex remains arrested in the pre-initiation complex even in the absence of drug. Subsequently, RPI engages in a previously unrecognized non-functional mode of rDNA transcription that correlates with nucleolar disruption, genome-wide DNA damage, cellular senescence and death. Our data show that the cytotoxicity of CX-5461 is the downstream result of a highly specific inhibition of rDNA transcription. The observation that this inhibition is irreversible will be important for the design of chemotherapy strategies and the avoidance of drug resistance.
MATERIALS AND METHODS
Primary antibodies for immunofluorescence, chromatin immunoprecipitation and western blotting
Rabbit polyclonal antibodies against mouse and human UBF, RPI large subunit (RPA194/Polr1A) and RRN3, and against mouse TAF1B were generated in the laboratory and have been previously described (29). Human anti-UBF (anti-Nor90) was obtained from G. Reimer (34). All other antibodies were obtained commercially: anti-human TAF1B (#D01, Abnova), anti-Tubulin (#T5168, Sigma), mouse anti-Fibrillarin (#905001, BioLegend), goat anti-Fibrillarin (#LS-C155047, LSBio), anti-FLAG M2 (F3165, Sigma), anti-γH2A.X (clone JBW301, #05-636, Millipore–Sigma), anti-53BP1 (#100-304, Novus Biologicals), mouse anti-RPA135 (#SC-293272, Santa Cruz), mouse anti-RPA194 (#SC-48385, Santa Cruz), anti-P21 (#SC-6246, Santa Cruz), anti-p53 (#2524, Cell Signaling) and anti-p53 phospho-serine 15 (#9284S, Cell Signaling).
Cell culture and drug treatment
NIH3T3 mouse embryonic fibroblasts (MEFs) and HEK293T, a transformed human embryonic kidney cell line of neuronal origin (35,36), were cultured in Dulbecco’s modified Eagle medium and 10% foetal bovine serum as described by American Type Culture Collection. Mouse E14Tg2a ES cells (E14) were cultured in 2i/LIF N2B27 medium as previously described (37). 10 mM stock of CX-5461 (Calbiochem/EMD Biosciences) was prepared in 50 mM NaH2PO4 (vehicle). The CX-5461 or vehicle was then diluted in culture medium to obtain the required final concentration. Actinomycin D (Act-D, Calbiochem/EMD Biosciences) was prepared in dimethyl sulfoxide (DMSO) at 5 mg/ml and this or an equivalent volume of DMSO diluted in culture medium to obtain a final concentration of 50 ng/ml (40 nM). To remove CX-5461 during experimental manipulations (CX-pulse treatments), the drug containing culture medium was removed by aspiration and replaced with medium lacking the drug. This process was repeated twice in rapid succession. The replacement medium was incubated along with cell cultures prior to its use. The efficiency of this drug removal protocol was found to eliminate >99% of CX-5461 as monitored using both colony-forming assays and γH2A.X DNA damage response (see Supplementary Figure S8B and C).
Metabolic RNA labelling
NIH3T3 and E14 cells were grown in 35 mm Petri dishes. The medium was changed 1 h prior to the experiment. At time zero (t0), the medium was supplemented with different concentrations of CX-5461 or vehicle (mock, 50 mM NaH2PO4) or 40 nM Act-D and RNA labelled by the addition of 10 μCi [3H]-uridine (Perkin-Elmer) per Petri for the times indicated. In cases where CX-5461 treatment was terminated before labelling (CX-pulse), cells were treated with 10 μM CX-5461 or mock treated for 5 min followed by three complete changes of medium (drug wash-out) and incubated for different times in fresh media before the addition of 10 μCi [3H]-uridine during the final 30 min of culture. RNA was immediately recovered with 1 ml Trizol (Invitrogen) according to the manufacturer’s protocol and resuspended in formamide (Invitrogen). One microgram of RNA was loaded onto a 1% formaldehyde/TT buffer gel (38) or using 1% formaldehyde/MOPS buffer gel described in (39,40). The EtBr-stained gels were photographed using the G:BOX acquisition system (Syngene), irradiated in a UV cross-linker (Hoefer) for 5 min at maximum energy, and transferred to a Biodyne B membrane (Pall). The membrane was UV cross-linked at 70 J/cm2, washed in water, air dried and exposed to a Phosphor BAS-IP TR 2025 E Tritium Screen (GE Healthcare). The screen was then analysed using a Typhoon imager (GE Healthcare) and quantified using the ImageQuant TL image analysis software (GE Healthcare).
Metabolic RNA and DNA labelling with EU and EdU
Cells were cultured on poly-lysine-treated coverslips and subjected to the experimental manipulations as indicated. For RNA labelling, 1 mM 5-ethynyl uridine (EU) or, for DNA labelling, 10 μM 5-ethynyl deoxyuridine (EdU) was added to the culture medium 30 min prior to fixation in 4% paraformaldehyde (PFA) and permeabilization as for immunofluorescence (IF). Incorporation of the ethynyl group into RNA or DNA was revealed using Alexa647-azide and reagent kit C10340 (Thermo Fisher) following the manufacturer’s protocol. Subsequently, samples were rinsed in phosphate-buffered saline (PBS) before IF staining. See the next section for subsequent processing and image quantitation.
Indirect IF microscopy
Cells were cultured on poly-lysine-treated coverslips and after experimental manipulations were fixed in 4% PFA for 10 min and permeabilized with 0.25% PBS/Triton for 15 min. After a blocking step in PBS-N [PBS, 0.1% IGEPAL (Sigma)] and 5% donkey serum, cover slips were incubated with primary antibodies in PBS-N and 5% donkey serum for ∼16 h at 4°C. RPI was generally detected using a combination of anti-A194 and A135 antibodies. Cells were incubated for ∼2 h at room temperature with the appropriate AlexaFluor or Dylight 405/488/568/647 conjugated secondary antibodies (Thermo Fisher/Jackson ImmunoResearch) and counterstained with DAPI or Hoechst 33342. After mounting in Prolong Diamond (Thermo Fisher), epifluorescent 3D image stacks were acquired using a Leica DMI6000B microscope equipped with an Orca C4742-80-12AG camera (Hamamatsu) and Volocity (Quorum Technologies) or using a Leica SP5 II scanning confocal microscope as indicated. 3D image analysis and quantitation were performed with the Volocity software using DAPI or Hoechst staining to define the nuclear volume and fibrillarin staining to define the active nucleolar rDNA volume. The fluorescence background for each image channel was estimated from the average 3D signal of the image stack outside of all nuclei. The Otsu intensity threshold (41) was used to determine fluorescence signal significance.
Chromatin immunoprecipitation
Cells were fixed with 1% formaldehyde for 8 min at room temperature. Formaldehyde was quenched by addition of 125 mM glycine and cells harvested and washed in PBS. Nuclei were isolated using an ultrasound-based nuclei extraction method (NEXSON: Nuclei Extraction by SONication) (42) with some modifications. Briefly, for all cell types, 33 million cells were resuspended in 1.5 ml of Farnham lab buffer (5 mM PIPES, pH 8.0, 85 mM KCl, 0.5% IGEPAL, protease inhibitors). Cell suspensions were sonicated in 15 ml polystyrene tubes (BD #352095) using three to four cycles of 15 s on:30 s off at low intensity in a Bioruptor (Diagenode). After recovery of the NEXSON-isolated nuclei by centrifugation (1000 × g, 5 min), they were resuspended in 1.5 ml of shearing buffer [10 mM Tris–HCl, pH 8.0, 1 mM NaEDTA, 0.1% sodium dodecyl sulfate (SDS), protease inhibitors] and sonicated for 25 min, 30 s on:30 s off, at high intensity. Each immunoprecipitation was carried out using the equivalent of 16 × 106 cells as previously described (29). To map PAF53, a cDNA encompassing the complete coding region (NM_022811.3) was isolated from NIH3T3, verified by Sanger sequencing and subcloned into pCDNA3-3xFLAG-C1. The resulting pC3xFLAG-PAF53 (laboratory stock #2266) was used to transfect NIH3T3 and cells were selected with G418. A pool of positive clones expressing PAF53 at endogenous level was then subjected to parallel chromatin immunoprecipitation (ChIP) for PAF53 (anti-FLAG), RPI and Rrn3.
ChIP-qPCR analysis
All ChIP experiments included a minimum of two biological replicates and were analysed as previously described (29). For qPCR analysis, reactions (20 μl) were performed in triplicate using 2.5 μl of sample DNA, 20 pmol of each primer and 10 μl of Quantitect SYBR Green PCR Master Mix (QIAGEN) or PowerUp™ SYBR™ Green Master Mix (Thermo Fisher). Forty reaction cycles of 10 s at 95°C and 30 s at 58°C were carried out on a Multiplex 3005 Plus (Stratagene/Agilent). The amplicon coordinates relative to the 47S rRNA initiation site (BK000964v3) were as follows: IGS2S, 25552–25783; IGS3, 42653–42909; SpPr, 43076–43279; Tsp, 43253–43447; 47SPr, 45133–45140; 47S 5′, 159–320; ETS, 3078–3221; 28S, 10215–10411; T1–3, 13417–13607. Data were analysed using the MxPro software (Agilent). The relative occupancy of each factor was determined by comparison with a standard curve of amplification efficiency for each amplicon using a range of input DNA amounts generated in parallel with each qPCR run.
ChIP-seq and data analysis
ChIP DNA samples were quality controlled by qPCR before being sent for library preparation and 50-base single-end sequencing on an Illumina HiSeq 2500 or 4000 (McGill University and Genome Quebec Innovation Centre). Sequence alignment and deconvolution of factor binding profiles to remove sequencing biases (deconvolution ChIP-seq, DChIP-seq) were carried out as previously described (29,30). The manual for the deconvolution protocol and a corresponding Python script can be found at https://github.com/mariFelix/deconvoNorm. Gaussian curve fitting to transcription factor binding profiles was performed using MagicPlot Pro (MagicPlot Systems LLC) on data from the DChIP-seq BedGraph files. The raw sequence files and the processed deconvolution BedGraphs have been submitted to ArrayExpress under accession E-MTAB-9242.
Cell-free transcription assays
Cell-free run-off transcription reactions were carried as previously described (43,44). For the CX-5461 dose response assay, plasmid pT7i23T3 (laboratory stock #1044) containing the 3.5 kb mouse rDNA SalI fragment [bp −168 to +3109 relative to 47S initiation site (45)] was linearized by PvII cleavage at +293 and used as a template. Transcription reactions were carried out at 30°C for 1 h in a volume of 25 μl containing 30 ng of template, 7 μl DEAE 280 fraction [from L1210 S100 extracts (43,46)], 1 μl RNaseOUT™ (Thermo Fisher), 0.5 mM ATP, CTP and GTP, 0.05 mM UTP and 10 μCi UTP [α-32P]-800 Ci/mmol (Perkin-Elmer), in 4 mM HEPES–KOH (pH 7.9), 8 mM glycerol, 700 μM DTT, 0.05 mM EDTA, 4 mM MgCl2, 48 mM KCl and 300 μg/ml α-amanitin (Sigma–Aldrich). 0.5 μl of CX-5461 (Calbiochem) at varying concentrations in 50 mM NaH2PO4 was added to the indicated final drug concentration. Reactions were stopped with 180 μl Stop-Solution [50 mM Tris–HCl, pH 8, 150 mM NaCl, 300 mM Na acetate, 0.5% SDS, 5 mM EDTA and 60 μg/ml yeast tRNA (Thermo Fisher)]. RNA was recovered, resolved on 15% TBE–urea PAGE gels and labelled RNA revealed by phosphor imaging on a Typhoon imager (GE Healthcare).
The templates GL34 (laboratory stock #1159) and GL64 (laboratory stock #1161) used in the G-less cassettes assays were previously described in detail (44). Briefly, both templates contained the mouse rDNA fragment −168 to +293 and were linearized by HindIII cleavage at +320 within the adjacent pUC9 vector sequence. Reactions were performed essentially as above with the exception that initial reactions were performed for 20 min at 30°C in the absence of GTP, which was added subsequently to 0.5 mM during the ‘chase’ reaction as indicated and the reaction continued for another 40 min. Heparin was added to a final concentration of 80 μg/ml to prevent transcription initiation or re-initiation as indicated.
Psoralen cross-linking accessibility and Southern blotting
The psoralen cross-linking accessibility assay and Southern blotting were performed on cells grown in 60 mm Petri dishes and DNA was analysed as previously described (47,48), using the 6.7 kb 47S rRNA gene EcoRI fragment (pMr100) (47). The ratio of ‘active’ to ‘inactive’ genes was estimated by analysing the intensity profile of low- and high-mobility bands revealed by phosphor imaging on an Amersham Typhoon imager (GE Healthcare, now Cytiva) using a Gaussian peak fit generated with MagicPlot Pro (MagicPlot Systems LLC).
Linear PCR amplification
Oligonucleotide primers Prom.for (5′-GTT GTC AGG TCG ACC AGT TGT-3′) and 47S.rev (5′-CCG AAA TAA GGT GGC CCT CA-3′) were 5′ [32P] labelled using T4 polynucleotide kinase (New England Biolabs). Total genomic DNA was restricted as indicated, subjected to 30 cycles of amplification (30 s at 95°C, 30 s at 54°C and 30 s at 68°C) using Taq DNA Polymerase (New England Biolabs) with a single labelled primer. The products were analysed by 15% PAGE in TBE–urea and revealed by phosphor imaging on an Amersham Typhoon imager (GE Healthcare, now Cytiva).
Colony-forming and β-galactosidase senescence assays
Cells were plated at 104 per well in six-well plates and cultured for 24 h before treatment. Duplicate wells were either treated with varying concentrations of CX-5461 for 5 min followed by drug removal by three changes of medium as described above (CX-pulse) or treated without drug removal. Cells were then cultured for another 5 days with a change of medium after days 2 and 4. Cells were fixed with 1% glutaraldehyde in PBS for 10 min at room temperature, washed in PBS, stained for 30 min with 0.1% crystal violet in PBS and air dried after an H2O wash. After imaging, the stain was recovered in 10% acetic acid and absorbance at 590 nm quantified using a Synergy H1 microplate reader (Biotek).
For senescence assays, cells were plated on poly-lysine-treated coverslips at varying densities 24 h before treatment for 5 min with varying concentrations of CX-5461 as described above (CX-pulse). Cells were then cultured for 2 days before fixing in 0.5% glutaraldehyde for 5 min at room temperature, rinsed with PBS, 1 mM MgCl2, pH 5.5, and incubated with X-gal staining solution (PBS, 1 mM MgCl2, 0.5 mM K3Fe(CN)6, 0.5 mM K4Fe(CN)6, pH 6.0) at 37°C for ∼8 h. Cells were then washed with H2O, mounted in 50% glycerol/50% 0.2 M Na glycine and 0.3 M NaCl, and imaged at 250× magnification on a Leica DMIL with MC120HD colour camera. Cells with evident blue perinuclear colouration were scored manually using three independent image fields for each drug concentration.
RESULTS
CX-5461 rapidly suppresses rRNA synthesis in vivo
Inhibition of rRNA synthesis by CX-5461 has been demonstrated in several studies, but to date the effects on rRNA synthesis have been determined only after longer drug treatments. This leaves open the question of whether CX-5461 directly or indirectly inhibits RPI transcription. To respond to this question, we first used short-term metabolic labelling to determine the effects of CX-5461 on de novo 47S rRNA synthesis in NIH3T3 MEFs. Increasing concentrations of CX-5461 were found to progressively suppress rRNA synthesis such that by 10 μM it was <5% of control levels (Figure 1A and B). To determine whether inhibition was affected by cell type, NIH3T3 and mouse embryonic stem cells (mESCs) were treated in parallel with 10 μM CX-5461 or 40 nM Act-D, a transcription elongation inhibitor (49,50) (Figure 1C). To limit the time for drug action before the start of metabolic labelling, the radioactive tracer was applied together with the drug. Despite this, 47S synthesis was inhibited to ≤10% of control levels by both treatments and in both cell types. Strong inhibition was already observed during the 15-min pulse labelling, suggesting that both drugs acted within minutes of their application and therefore most probably directly targeted rDNA transcription.
![CX-5461 inhibits de novo rRNA synthesis and disrupts subnucleolar organization. (A) 30-min metabolic RNA labelling in NIH3T3 MEFs after 15-min incubation of cells with the indicated concentrations of CX-5461 as analysed by electrophoresis. (B) Quantitation of uridine incorporation into 47S rRNA derived from two biological replicates. RNA gel fractionations as in (A) and normalized to bulk 28S levels. The standard error of the mean (SEM) is indicated. (C) Comparative analysis of 47S synthesis in NIH 3T3 and E14 mESCs treated with 10 μM CX-5461, 40 nM Act-D or mock treated and analysed as in (B) except that [3H]-labelled uridine was present from the start of the drug treatments and RNA was recovered 15 or 30 min later. Data derived from two biological replicates per cell type and the SEM is indicated. (D) Examples of nuclear distributions of fibrillarin, a 47S processing factor (grey) and UBF, indicating the transcriptionally active rDNA (red), before and after treatment with 10 μM CX-5461 as compared with their distributions in MEFs depleted for the essential RPI-associated factor Rrn3 (29). Single confocal planes from indirect IF microscopy are shown and areas enclosed by a rectangle are shown at higher resolution at the top right of each pane. Nuclear DNA (DAPI) is shown superimposed (blue). See Supplementary Figure S1 for a time course of CX-5461-induced changes in nuclear/nucleolar fibrillarin and UBF distributions.](https://oup.silverchair-cdn.com/oup/backfile/Content_public/Journal/narcancer/2/4/10.1093_narcan_zcaa032/3/m_zcaa032fig1.jpeg?Expires=1747910709&Signature=zJF-Yb2RlnNAPOxybDBXgaExExHGkiZlzIsNSwNNMPRYxJQp4S8hie~AJxN1-dAZuEXDJEqodjJsiK1GNyXopwf1buNTv4tI-aTEthmBc~T~AnGcdJCihqxz77Mg6IoA4bNLw~70yJmXH0NDDOr8tVDCEDi90uLGN~HTpyVe1u4vAq-HodM2iNPsI7PiOI6urPdDxRkaMJpAKcTdIQhrfM5GXbgsVUwF9AHO-hvA5-5rbBH5EmI09rYVHvkZxyJkKbUcqPWJJ8hlMrbBumUSbm58OA~ZdCag5qZVERnAx7m9fhMCm9BBz7ocKWZWJ3Bs0Vz-MvSbUGLtYadYpb639A__&Key-Pair-Id=APKAIE5G5CRDK6RD3PGA)
CX-5461 inhibits de novo rRNA synthesis and disrupts subnucleolar organization. (A) 30-min metabolic RNA labelling in NIH3T3 MEFs after 15-min incubation of cells with the indicated concentrations of CX-5461 as analysed by electrophoresis. (B) Quantitation of uridine incorporation into 47S rRNA derived from two biological replicates. RNA gel fractionations as in (A) and normalized to bulk 28S levels. The standard error of the mean (SEM) is indicated. (C) Comparative analysis of 47S synthesis in NIH 3T3 and E14 mESCs treated with 10 μM CX-5461, 40 nM Act-D or mock treated and analysed as in (B) except that [3H]-labelled uridine was present from the start of the drug treatments and RNA was recovered 15 or 30 min later. Data derived from two biological replicates per cell type and the SEM is indicated. (D) Examples of nuclear distributions of fibrillarin, a 47S processing factor (grey) and UBF, indicating the transcriptionally active rDNA (red), before and after treatment with 10 μM CX-5461 as compared with their distributions in MEFs depleted for the essential RPI-associated factor Rrn3 (29). Single confocal planes from indirect IF microscopy are shown and areas enclosed by a rectangle are shown at higher resolution at the top right of each pane. Nuclear DNA (DAPI) is shown superimposed (blue). See Supplementary Figure S1 for a time course of CX-5461-induced changes in nuclear/nucleolar fibrillarin and UBF distributions.
Changes in nucleolar morphology also suggest a direct effect of CX-5461 on rRNA synthesis
A shutdown of rRNA synthesis should lead to disruption of nucleoli resembling loss of the essential RPI transcription factors UBF or Rrn3 (29,51). Before drug treatment, NIH3T3 cell nuclei contained multiple nucleoli each displaying the typical punctate UBF staining that reveals individual active rDNA units and overlapping fibrillarin staining of early 47S processing intermediates (Figure 1D and Supplementary Figure S1). After 60-min CX-5461 treatment, the rDNA and processing domains had clearly separated, closely resembling the effects of RPI inactivation by Rrn3 deletion (29) (see Figure 1D and Supplementary Figure S1). At later time points, fibrillarin dissociated from these remnant nucleolar structures and formed many smaller foci throughout the nuclear volume each lacking UBF. The timing of this nucleolar disruption was consistent with the kinetics of pre-rRNA processing [t1/2 ∼ 60 min (39,44)], and hence with the expected downstream effects of the inhibition of 47S rRNA synthesis.
CX-5461 inhibits transcription initiation but not promoter recruitment of the RPI–Rrn3 complex
ChIP analysis of RPI interaction across the rDNA in NIH3T3 revealed a dose-dependent effect of CX-5461 that was already evident after 15 min of treatment (Figure 2A and B). RPI engagement over the 47S coding region (47S 5′, ETS and 28S amplicons) was strongly suppressed at 2 μM CX-5461 and almost eliminated at 10 μM. Strikingly, neither treatment affected RPI engagement at the 47S (47SPr) or Spacer (SpPr) promoters. Parallel mapping of the RPI-associated factor Rrn3 showed that although it was eliminated from the 47S 5′ early elongation region, its association with both 47S and Spacer promoters was also not affected and was even enhanced (Figure 2C). Rrn3 is an essential factor for RPI promoter recruitment and transcription initiation, but is released during early elongation (29,52–56). Thus, its enhanced presence along with RPI at the rDNA promoters indicated that CX-5461 inhibited either transcript initiation or an early step in elongation.
![CX-5461 inhibits initiation but not recruitment of RPI–Rrn3. (A) Graphical representation of qPCR amplicons within the mouse rDNA repeat unit. (B, C) ChIP-qPCR analysis, respectively, of RPI and Rrn3 interactions across the rDNA unit of NIH3T3 cells after 15 min exposure to either 2 or 10 μM CX-5461 or mock treated by the addition of vehicle (NaH2PO4). Standard errors were <0.1 and <0.03 for RPI and Rrn3, respectively, and so have been omitted. (D) DChIP-seq profiles of RPI and Rrn3 interactions across the NIH3T3 rDNA unit after treatment with 10 μM CX-5461, 40 nM ActD or mock treatment for 15 min. The lower panel shows an enlargement of the region boxed in the upper panel. The key elements of the rDNA repeat are indicated graphically below both panels. The scale of ChIP enrichment in (D) is indicated at the upper right of each lane. In (A) to (D), SpPr refers to the Spacer promoter [yellow in (D)]; Tsp, Spacer promoter adjacent terminator [red in (D)]; T0, 47S promoter proximal terminator; 47SPr, 47S pre-rRNA promoter; 47S 5′, amplicon covering 5′ base pairs 159–320 of the 47S pre-rRNA coding region; ETS, external transcribed sequence; 18S, 5.8S and 28S indicate structural rRNA coding regions; T1–10, 47S termination elements; and T1–3, the qPCR amplicon for this region.](https://oup.silverchair-cdn.com/oup/backfile/Content_public/Journal/narcancer/2/4/10.1093_narcan_zcaa032/3/m_zcaa032fig2.jpeg?Expires=1747910709&Signature=DgM~BWQySiUrmaHxMP4RgGwfXmbthxspgiXBYrVhol0DdOGtDaewAIubc7pIESmSB85B1FbZp3a8dAzJwjrKnQk2y5ewCREqWeXw9e8txhW5taneSImsTc2sRAM0ZwCzoG-gkv-4IhqVI03rY~sIyzUUczrFHs3K9amY33152xl-iXCoA67uvpACEcEO-~YSpQHk5GPL~lZGENbP5YU6ABylMiFHJN5d7WCxJ2XP7vw~AX2M8zIi5AjldT~CQyK4eAmsU10Mdd-H0KrT65FvmEqCvy~WUoj6IUVCTOC1IWO7WgjqFkG5xewX0GNrmdEfEHBzuzjTY1BpTbYEofE0fg__&Key-Pair-Id=APKAIE5G5CRDK6RD3PGA)
CX-5461 inhibits initiation but not recruitment of RPI–Rrn3. (A) Graphical representation of qPCR amplicons within the mouse rDNA repeat unit. (B, C) ChIP-qPCR analysis, respectively, of RPI and Rrn3 interactions across the rDNA unit of NIH3T3 cells after 15 min exposure to either 2 or 10 μM CX-5461 or mock treated by the addition of vehicle (NaH2PO4). Standard errors were <0.1 and <0.03 for RPI and Rrn3, respectively, and so have been omitted. (D) DChIP-seq profiles of RPI and Rrn3 interactions across the NIH3T3 rDNA unit after treatment with 10 μM CX-5461, 40 nM ActD or mock treatment for 15 min. The lower panel shows an enlargement of the region boxed in the upper panel. The key elements of the rDNA repeat are indicated graphically below both panels. The scale of ChIP enrichment in (D) is indicated at the upper right of each lane. In (A) to (D), SpPr refers to the Spacer promoter [yellow in (D)]; Tsp, Spacer promoter adjacent terminator [red in (D)]; T0, 47S promoter proximal terminator; 47SPr, 47S pre-rRNA promoter; 47S 5′, amplicon covering 5′ base pairs 159–320 of the 47S pre-rRNA coding region; ETS, external transcribed sequence; 18S, 5.8S and 28S indicate structural rRNA coding regions; T1–10, 47S termination elements; and T1–3, the qPCR amplicon for this region.
The higher resolution of DChIP-seq (30) confirmed the conclusions derived from ChIP-qPCR and added significant detail (Figure 2D). In mock-treated NIH3T3, RPI mapped throughout the 47S rRNA coding region and to the Spacer promoter, while Rrn3 was stochastically released over the first 1 kb or so of the 47S region, as had previously been observed in MEFs (29). A 15-min treatment with 10 μM CX-5461 strongly suppressed RPI and Rrn3 engagement across the 47S coding region, but strikingly did not prevent, and indeed again somewhat enhanced, their colocalization at the 47S and Spacer promoters. In contrast, the transcription elongation inhibitor Act-D did not significantly affect RPI and Rrn3 engagement across the rDNA, except to induce a 5′ to 3′ gradient of RPI (Figure 2D) as previously observed (44). Transcription complexes initiating at the Spacer promoter arrest <50 nucleotides downstream at the adjacent terminator site (Tsp) (29,51), making it difficult to discern changes in the positions of RPI and Rrn3 around this site. However, Rrn3 engagement at the Spacer promoter was clearly enhanced by CX-5461, suggesting that RPI initiation and Rrn3 release were also inhibited there.
Polymerase-associated factor PAF53 is an RPI subunit that may be released under certain conditions (57,58). The yeast orthologue of PAF53 forms part of an A49–A34.5 dimer whose binding to RPI was found to be reversible (59). The winged helix of A49 also contacts core factor components Rrn11 and Rrn6, orthologues of SL1 subunits TAF1A and TAF1C, and its rearrangement during initiation may be involved in Rrn3 release. In this sense, we argued PAF53 might provide a sensitive probe of RPI subunit composition during the transcription cycle. However, we found that rDNA engagement by PAF53 was indistinguishable from that of RPI (A194 subunit) and was not differentially affected by CX-5461 treatment (Supplementary Figure S2A), thus excluding a partial disruption of RPI by CX-5461. RPI and Rrn3 engagement across the human rDNA of HEK293T was also found to respond to CX-5461 in a closely similar manner to that observed in NIH3T3 (compare boxed regions in Supplementary Figure S2B and C) and in p53-null MEFs (https://www.ebi.ac.uk/arrayexpress/experiments/E-MTAB-9242). Thus, the action of CX-5461 most probably did not affect the subunit structure of RPI and appeared to be neither species nor cell type specific.
CX-5461 does not inhibit RPI transcription elongation
Metabolic labelling and ChIP analysis suggested that CX-5461 inhibited rDNA transcription within minutes of its application (Figures 1 and 2). DChIP-seq analysis of the time course of inhibition in fact revealed that already 2 min after drug application both RPI and Rrn3 were depleted from the first kilobase of the 47S coding region and by 5 min RPI depletion extended half-way across the coding region (Figure 3A and Supplementary Figure S3A). Depletion of RPI from the entire 47S region was completed by 15 min with the exception of a residual accumulation near the 47S termination site that was also eliminated at the 30 min time point (Supplementary Figure S3A). RPI and Rrn3 remained engaged at the 47S and the Spacer promoters throughout the CX-5461 treatment and Rrn3 was again observed to accumulate at the Spacer promoter, consistent with inhibition of initiation or of a very early step in elongation. A corresponding accumulation of total cellular Rrn3 was also observed, suggesting that the stability of this factor may be inversely related to the rate of initiation (Supplementary Figure S3B).
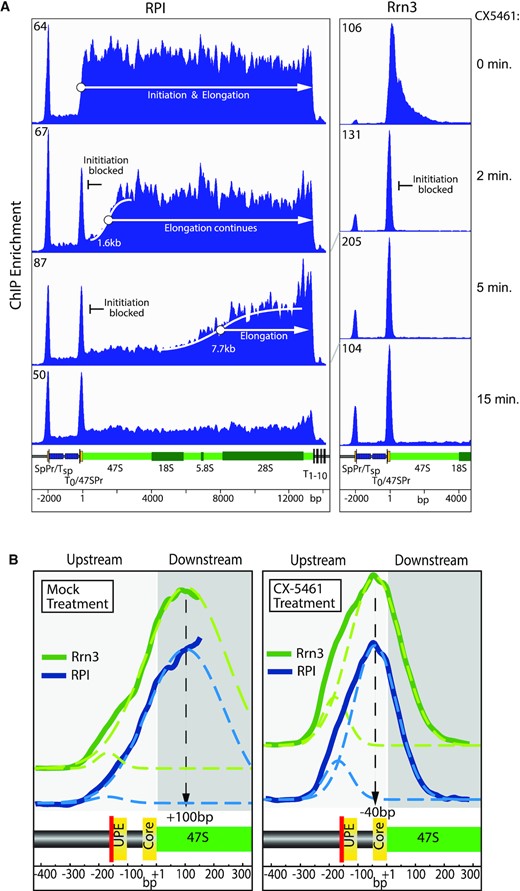
De novo RPI–Rrn3 initiation is arrested by CX-5461 but ongoing transcription elongation is not affected. (A) Time course of DChIP-seq rDNA interaction profiles for RPI and Rrn3 during the first 15 min of inhibition by 10 μM CX-5461 in NIH3T3 cells. The scale of ChIP enrichment is indicated at the upper left of each lane. The key elements of the rDNA repeat are indicated and labelled as in Figure 2D. Supplementary Figure S3A shows the same data but across the full rDNA unit and includes a 30 min time point. The elongation rate in the presence of CX-5461 was determined from the positions of the RPI boundaries formed after 2 and 5 min of drug treatment. Detailed treatments are given in Supplementary Figure S3D and E, but briefly the boundary positions were defined by sigmoidal curve fits to the RPI ChIP-seq datasets giving initial elongation rates in the presence of CX-5461 of 13.6 and 25.6 nucleotides/s, respectively, at 2 and 5 min. These initial rates did not account of the delay in drug uptake, but by assuming the elongation rate should remain constant during the first 5 min of drug treatment, this could be estimated as 71 s, giving a true elongation rate of 33.5 nucleotides/s. Similar estimates were made using linear curve fits to RPI levels in independent ChIP-qPCR experiments. This approach gave an independent estimate for elongation as 39 nucleotides/s and a drug uptake delay of 56 s. Taking the two independent estimates gave a mean elongation rate of 37 ± 3 nucleotides/s and a drug uptake delay of 64 ± 8 s. (B) High-resolution profiles of RPI and Rrn3 across the 47S promoter after mock treatment or 15-min treatment with 10 μM CX-5461. Gaussian curve fits (dotted lines) were used to estimate the indicated central positions of the factors relative to the 47S initiation site. It should be noted that for the ‘mock treatment’ the distribution of RPI and Rrn3 at the 47S promoter continues into the adjacent 47S coding region; hence, the curve fit was only to the 5′ rise in RPI and Rrn3 loading profile (solid line). The positions of the two functional 47S promoter sequence elements, the upstream element (UPE) and core (yellow), and the adjacent T0 termination site (red) are indicated below each panel. Supplementary Figure S3C shows these data side by side with mapping of UBF and TAF1B.
The CX-5461 time-course data clearly showed that transcription complexes initiated prior to drug application were able to continue elongation until the normal 47S termination site (Figure 3A and Supplementary Figure S3A). Using the positions of the well-defined RPI boundaries formed after 2 and 5 min of drug treatment as well as independent ChIP-qPCR datasets, it was possible to estimate the elongation rate in the presence of CX-5461 as 37 ± 3 nucleotides/s (see Figure 3A and Supplementary Figure S3A, D and E and corresponding legends for detailed calculations). This rate is closely similar to other estimates of RPI elongation rates and is typical for NIH3T3 grown under standard conditions (44,60), thus excluding the possibility of an overt effect of CX-5461 on RPI elongation. The data also allowed us to estimate the time from addition of the drug to arrest of initiation as 64 ± 8 s (again see Figure 3A and Supplementary Figure S3A, D and E and corresponding legends for detailed calculations). The extremely rapid action of CX-5461 in blocking RPI transcription initiation strongly supports the conclusion that the drug primarily and most probably directly targets this activity.
CX-5461 arrests RPI–Rrn3 at the rDNA promoter
Closer inspection of the DChIP-seq time-course data revealed that in untreated cells the interactions of RPI and Rrn3 at the 47S promoter and adjacent coding region peaked some 100 bp downstream of the initiation site (Figure 3B). In contrast, after CX-5461 treatment both RPI and Rrn3 co-mapped in a narrow peak centred at −40 bp within the 47S core promoter element. This position is fully consistent with an RPI–Rrn3 complex arrested over the initiation site and strongly suggested that CX-5461 prevented transcription release of the polymerase from the pre-initiation complex. We further found that CX-5461 did not affect promoter occupancy by SL1 (TAF1B) or by UBF in NIH3T3 (Supplementary Figures S2B and S3C) or HEK293T cells (Supplementary Figure S2C). This excludes the possibility that the drug acts by preventing promoter recruitment of SL1 as was previously suggested (9,61).
CX-5461 also inhibits RPI initiation but not elongation in a cell-free system
Our data to this point strongly suggested that CX-5461 acted by preventing RPI transcription initiation. We therefore directly determined whether this was indeed the case by studying the effects of CX-5461 on RPI transcription in a cell-free system (44,62). Synthesis of run-off transcripts in this system was inhibited in a dose-dependent manner by CX-5461 such that transcription was strongly suppressed at 3 μM CX-5461 and was undetectable at 10 μM (Supplementary Figure S4A), in close correlation with the inhibition observed in vivo (Figure 1A and B). CX-5461 also did not induce an accumulation of incomplete transcripts suggesting it did not affect elongation in vitro. To specifically test this, we used G-less cassette assays in which elongation was arrested after 34 or 64 bases (Figure 4, lane 3, and Supplementary Figure S4B and C, lane 1). Subsequent addition of GTP chased arrested complexes to full length and allowed further rounds of full-length run-off transcription, which could be prevented by addition of heparin (compare lanes 5 and 6 in Figure 4), as could all de novo initiation (lanes 1 and 2). Addition of 10 μM CX-5461 during the GTP chase had no effect on the ability of the arrested complexes to resume elongation and to complete full-length synthesis but did prevent accumulation of new rounds of synthesis (compare lanes 6–8 in Figure 4 and lanes 2–4 in Supplementary Figure S4B and C). Addition of CX-5461 during the initial GTP-minus reaction abolished formation of the arrested 34 or 64 base elongation complexes and the formation of full-length transcripts during the subsequent GTP chase (Figure 4, lanes 9 and 10, and Supplementary Figure S4B and C, lanes 5 and 6). Thus, CX-5461 inhibited RPI transcription in vitro well before synthesis of the 34th base but had no effect on established elongation complexes. In combination with the finding of RPI–Rrn3 arrest over the 47S initiation site in vivo (Figure 3B and Supplementary Figure S3C), these data demonstrate a specific effect of CX-5461 on RPI initiation.
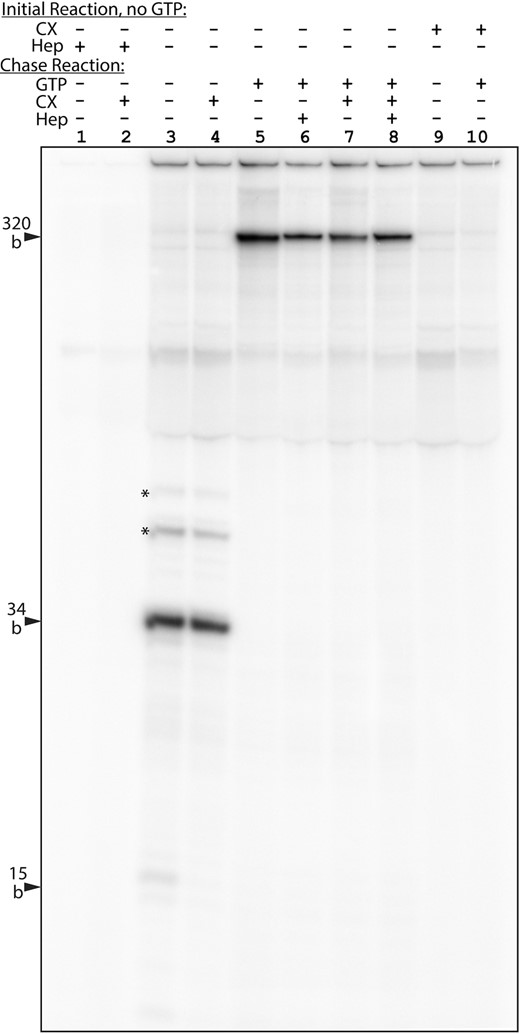
CX-5461 inhibits RPI transcription initiation but not elongation in vitro. Cell-free transcription assays were carried out using a template containing the mouse rDNA 47S promoter fragment from −168 to 292 bp relative to the 47S initiation site in which bases +1 to +34 bp lacked G residues on the non-coding (top) strand. The template was linearized within the adjacent pUC9 vector sequence to give an RNA run-off product of 320 bases. An initial reaction was performed in the absence of GTP during which transcription was arrested at the first G-residue, giving a 34-base product. Subsequent addition of GTP to the reaction (chase reaction) allowed transcripts to elongate to the end of the template, and in the absence of CX-5461 (CX) also allowed multiple rounds of initiation/elongation that could be prevented by addition of heparin (compare lane 5 with lanes 6–8). Addition of 10 μM CX-5461 during the initial reaction eliminated synthesis of both 34-base and full-length transcripts but its addition during the GTP chase reaction had no effect on the efficiency of elongation of 34-base transcripts to full length. The asterisk in lanes 3 and 4 indicates a degree of readthrough at the end of the G-less cassette, bands corresponding to the positions of subsequent G-residues.
CX-5461 irreversibly blocks 47S synthesis and induces aberrant RPI transcription
To better understand the underlying mechanism of CX-5461 inhibition, we sought to study the resumption of rDNA transcription after drug removal. NIH3T3 cells were exposed to CX-5461 for just 5 min (‘CX-pulse’), sufficient to arrest 47S synthesis, or were mock treated and the recovery of RPI transcription after drug removal followed by metabolic labelling and ChIP (Figure 5A). Unexpectedly, 47S synthesis showed little recovery after drug removal, remaining ≤20% of mock levels even 5 h later (Figure 5B). ChIP analysis after the CX-pulse showed that RPI was initially eliminated from the 47S coding region but then underwent a stepwise reloading, such that reloading was complete after 1 h and was maintained for at least another 4 h (Figure 5C and D, and Supplementary Figure S5A). However, Rrn3 loading over the promoter adjacent 47S 5′ rDNA region remained ≤25% of mock levels throughout RPI reloading (Figure 5C and D, and Supplementary Figure S5A) and paralleled the strong suppression of 47S synthesis (Figure 5B). However, TAF1B promoter occupancy was unaffected or somewhat enhanced following the CX-pulse treatment, again strongly suggesting that CX-5461 did not inhibit SL1-dependent pre-initiation complex formation (Supplementary Figure S5A). It should be noted that drug removal at the end of the CX-pulse treatment was estimated to be >99% (see Supplementary Figure S8B and C and ‘Materials and Methods’ section). Thus, the combined ChIP and metabolic labelling data strongly argued that CX-5461 irreversibly blocked normal 47S initiation but did not prevent an unproductive mode of RPI reloading throughout the 47S coding region.
![CX-5461 irreversibly disrupts rDNA transcription and nucleolar organization. (A) Timeline of ‘CX-pulse’ experiments. (B) NIH3T3 cells were subjected to a CX-pulse (5 min, 10 μM CX-5461) or mock treated and then incubated for varying times in the absence of drug and finally subjected to RNA metabolic labelling with [3H]-uridine for 30 min. The left panel shows electrophoretic analysis of labelled RNAs and the right panel shows the quantitation of [3H]-uridine incorporation into 47S rRNA normalized to bulk 28S levels (EtBr 28S). The error bars represent the SEM for two biological duplicates. (C) ChIP-qPCR analysis of RPI and Rrn3 interactions across the rDNA unit of NIH3T3 cells at various times after a CX-pulse or mock as in (A). The amplicons sampled are those shown graphically in Figure 2A and labelled as in the previous figures. To aid interpretation and avoid clutter, only data from a subset of time points are shown and error bars have been omitted. The data are the mean of three biological replicates and are shown in full in Supplementary Figure S5A along with the SEM for each data point. (D) A comparative histogram of RPI and Rrn3 interactions over the 47S 5′ amplicon [shaded in (C)] at different times after the CX-pulse treatment. The data are taken from the interaction curves in (C) and Supplementary Figure S5A and the SEM is indicated by vertical bars. (E) Left panel: epifluorescence imaging of de novo RNA synthesis (EU 30-min labelling) and of RPI in NIH3T3 at 90 min after a 5-min CX-pulse or mock treatment. Arrows indicate residual EU incorporation into RNA corresponding with RPI foci after the CX-pulse. Right panel: quantitation of EU incorporation within the nucleoplasmic and the nucleolar volumes. An average of 50 nuclei per time point from 3D image stacks were subjected to volumetric analysis using Volocity software (Quorum Technologies) and the SEM for each dataset indicated (see the ‘Materials and Methods’ section). A complete time course of imaging is shown in Supplementary Figure S5.](https://oup.silverchair-cdn.com/oup/backfile/Content_public/Journal/narcancer/2/4/10.1093_narcan_zcaa032/3/m_zcaa032fig5.jpeg?Expires=1747910709&Signature=bEdZe69wuvxv4dcApJFvKKNG0s~dQUU8O8uvYSf2PDKfNkXH8cQWSyp3fX1a6wEXz00LYiCWXsn3W4wFozeuG7DAXDnUoGI6h0Py0myxNAdmIoEeSDhV7f4VLLBJJBs9PH~4w8-h7i34T8y1rmF36aJuk6~wHMuZRxI2YEF9tedOBGStb3q4zMBS2vksLholclcx8VtfFKOlMqLRZI7RUEbdcLZF6Fy0HnHNX77DioTPtkA0sKoGsI-mgQiDN62afVn0EAgv639PmkCGpNgEqOintjdTAGwQCUFRZnXK7xuM6BL8hnrh899UqBLMxVtPtzwktKPKaxnaVT184b5UoQ__&Key-Pair-Id=APKAIE5G5CRDK6RD3PGA)
CX-5461 irreversibly disrupts rDNA transcription and nucleolar organization. (A) Timeline of ‘CX-pulse’ experiments. (B) NIH3T3 cells were subjected to a CX-pulse (5 min, 10 μM CX-5461) or mock treated and then incubated for varying times in the absence of drug and finally subjected to RNA metabolic labelling with [3H]-uridine for 30 min. The left panel shows electrophoretic analysis of labelled RNAs and the right panel shows the quantitation of [3H]-uridine incorporation into 47S rRNA normalized to bulk 28S levels (EtBr 28S). The error bars represent the SEM for two biological duplicates. (C) ChIP-qPCR analysis of RPI and Rrn3 interactions across the rDNA unit of NIH3T3 cells at various times after a CX-pulse or mock as in (A). The amplicons sampled are those shown graphically in Figure 2A and labelled as in the previous figures. To aid interpretation and avoid clutter, only data from a subset of time points are shown and error bars have been omitted. The data are the mean of three biological replicates and are shown in full in Supplementary Figure S5A along with the SEM for each data point. (D) A comparative histogram of RPI and Rrn3 interactions over the 47S 5′ amplicon [shaded in (C)] at different times after the CX-pulse treatment. The data are taken from the interaction curves in (C) and Supplementary Figure S5A and the SEM is indicated by vertical bars. (E) Left panel: epifluorescence imaging of de novo RNA synthesis (EU 30-min labelling) and of RPI in NIH3T3 at 90 min after a 5-min CX-pulse or mock treatment. Arrows indicate residual EU incorporation into RNA corresponding with RPI foci after the CX-pulse. Right panel: quantitation of EU incorporation within the nucleoplasmic and the nucleolar volumes. An average of 50 nuclei per time point from 3D image stacks were subjected to volumetric analysis using Volocity software (Quorum Technologies) and the SEM for each dataset indicated (see the ‘Materials and Methods’ section). A complete time course of imaging is shown in Supplementary Figure S5.
RPI reloading in the absence of 47S synthesis was intriguing and was further confirmed by psoralen accessibility cross-linking (PAC), a technique that distinguishes active and inactive rDNA chromatin fractions (27,47). After the CX-pulse, PAC revealed an initial strong reduction of ‘active’ rDNA chromatin followed by its rapid re-establishment, closely paralleling the reloading of RPI (compare Supplementary Figure S5B with Figure 5C and D and Supplementary Figure S5A). We therefore used EU pulse labelling to determine whether RPI reloading was accompanied by RNA synthesis (Figure 5E and Supplementary Figure S5C). EU incorporation into nucleoli was suppressed but not eliminated by the CX-pulse and corresponded spatially with nucleolar foci of RPI. Thus, the reloaded RPI was at least partially active in transcription but unable to generate full-length 47S transcripts. The lack of reloading of Rrn3 over the 47S 5′ region (Figure 5C) also strongly argued that this residual transcription did not result from canonical initiation at the 47S promoter.
Irreversible arrest of 47S rRNA synthesis leads to extensive DNA damage
We had observed that both continuous and pulse treatment with CX-5461 inactivated functional 47S transcription and led to significant disorganization of nucleoli (Figures 1 and 5, and Supplementary Figures S1 and S5). Such nucleolar stress has been previously tightly linked to DNA damage, cell cycle arrest and senescence, and the rDNA repeats have been shown to play an important role in the maintenance of genome stability (31,63–66). We found that NIH3T3 cells challenged by a 5-min 10 μM CX-pulse displayed strong nuclear γH2A.X staining already 60 min after drug removal (Figure 6A and B). Subsequently, intensely stained 53BP1 foci characteristic of persistent double-strand breaks (DSBs) were detected at 120 and 360 min after the CX-pulse. Since this DNA damage occurred in the near absence of CX-5461 (see Supplementary Figure S8B and C) and correlated with arrest of 47S synthesis, nucleolar disruption and the aberrant reloading of RPI, it was most probably the direct result of the initial transcriptional arrest. This conclusion was further supported by appearance of a subset of DSB foci associated with nucleolar markers (colocalization of 53BP1 foci with fibrillarin and UBF in Figure 6A and Supplementary Figure S6A–C), suggesting that a subset of these breaks occurred within the rDNA itself. It is well established that persistent DSBs correlate with nucleolar disruption (32,67–69).
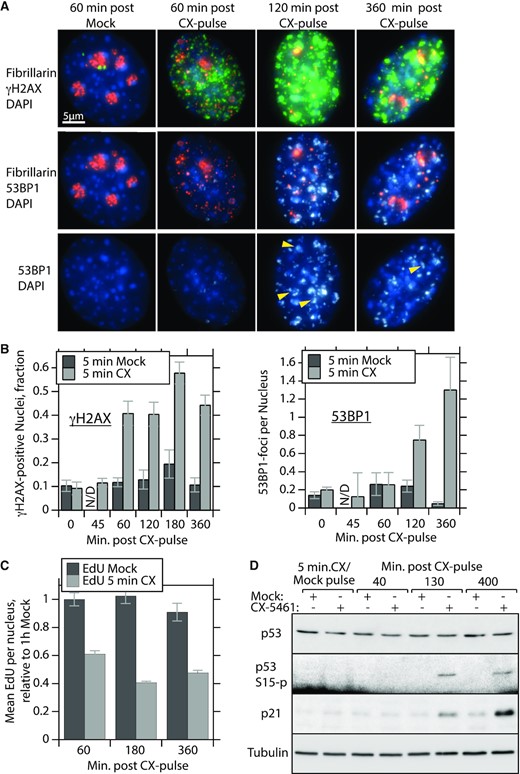
Arrest of 47S pre-RNA synthesis by CX-5461 leads to DNA damage and arrest of replication. (A) Epifluorescence imaging of NIH3T3 cells treated with a 5-min 10 μM CX-pulse and probed for γH2A.X and 53BP1 DNA damage foci and for fibrillarin at time points after CX-5461 removal. Arrows indicate colocalization of 53BP1 foci and fibrillarin (see Supplementary Figure S6 for a more complete image set). (B) The left panel shows the fraction of γH2A.X positive nuclei and the right panel shows mean number of dominant 53BP1 foci per nucleus at different time points after the CX-pulse. Wide-field 3D image stacks from three biological replicas were subjected to volumetric analysis using Volocity software (Quorum Technologies) (see the ‘Materials and Methods’ section). Staining intensity >250% above the Otsu intensity threshold (41) was considered positive. Dominant 53BP1 foci were also defined as having volumes between 1 and 10 μm3. More than 150 nuclei were analysed per experimental time point and the SEM for each is indicated. (C) Relative nuclear EdU incorporation at time points after the CX-pulse determined from staining intensities in wide-field images, examples of which are shown in Supplementary Figure S7. Quantitation of EdU incorporation was again obtained using the Volocity software (Quorum Technologies) to analyse ≥5 image fields, and an average of 40 nuclei per time point and treatment; the SEM is shown. (D) Western blot analysis of NIH3T3 total cellular protein for the expression of p53, S15-phospho p53 and p21 at indicated time points after the CX-pulse. Tubulin was used as an internal loading standard.
Replication arrest, cellular senescence and inviability also occur downstream of RPI transcription arrest
Accumulation of DNA damage downstream of the CX-pulse was also accompanied by a suppression of DNA replication. Replication, monitored by incorporation of EdU, was already strongly suppressed 60 min after the CX-pulse and was not re-activated during the following 6 h of culture (Figure 6C and Supplementary Figure S7). Consistent with this, p21 levels were enhanced at 2 h and more so at 6 h after the CX-pulse (Figure 6D), indicating cell cycle arrest. While p53 levels were not enhanced, probably due to the lack of p19-ARF in NIH3T3 (70,71), a degree of p53 S15-phosphorylation was detected. β-Galactosidase also accumulated in 95% of cells subjected to a CX-pulse at concentrations above 1 μM and corresponded to a 70% or greater loss of cell viability in colony-forming assays (Supplementary Figure S8A and B). Thus, just 5-min exposure to CX-5461 resulted not only in an immediate and irreversible inhibition of functional 47S synthesis but also in extensive DNA damage correlating with the onset of an aberrant mode of RPI transcription. Subsequently, cells displayed DNA replication arrest, cellular senescence and loss of cell viability.
DISCUSSION
Our data unequivocally identify the primary target of CX-5461 as the initiation of rDNA transcription by RPI both in vivo and in vitro, and in both mouse and human cells. CX-5461 inhibits RPI transcription within minutes of its application to cells, leading to the cessation of 47S rRNA synthesis and hence of ribosome biogenesis. CX-5461 does this by arresting RPI at the 47S and Spacer promoters of the rDNA as part of pre-initiation complexes containing the essential factors SL1 and UBF, and the RPI-associated initiation factor Rrn3. Stabilization of the initiation complex by the drug necessarily occludes subsequent 47S initiation events; however, transcription complexes initiated prior to the addition of the drug are unaffected and complete elongation. This leads to the transient elimination of RPI complexes from the complete 47S coding region within the first 15 min of drug exposure, leaving the rDNA unprotected and highly vulnerable to DNA damage.
Surprisingly, just 5-min exposure to CX-5461 was found to be sufficient to induce an irreversible block to 47S rRNA synthesis. The block persisted for at least 5 h after drug removal and was accompanied by the arrest of DNA replication and extensive γH2A.X and 53BP1 positive DNA damage. Subsequently, cells showed highly penetrant senescence and inviability. The persistence of the CX-5461 block to RPI initiation after drug removal also allowed us to probe the downstream processes involved in cytotoxicity. Though a 5-min exposure to CX-5461 was sufficient to eliminate RPI transcription complexes from the rDNA, RPI was slowly reloaded and reached pre-treatment levels within an hour of drug removal. However, this RPI reloading was not accompanied by the concomitant reloading of Rrn3 and did not support promoter-driven 47S rRNA synthesis. The RPI reloading did, however, correlate with a low level of nucleolar RNA synthesis (Figure 5E and Supplementary Figure S5C) and with increasing levels of DNA damage in part mapping over the rDNA itself (Supplementary Figure S6A–C). The data, therefore, suggested that the aberrant mode of transcription occurring after CX-5461 treatment could itself be the cause of the DNA damage. Replication of the rDNA repeats normally occurs unidirectionally with 47S transcription and the disruption of this co-migration of replication and transcription complexes leads to transcription–replication collisions, replication fork arrest and DNA breakage (33,72,73). Thus, the aberrant mode of transcription induced by CX-5461 could very likely be the cause of the DNA damage we observe. Alternatively, the aberrant mode of RPI transcription could itself be driven by RPI initiation at sites of DNA breakage occurring during the initial phase of inhibition when the rDNA is transiently naked of transcription complexes.
Previous studies had suggested that the ability of CX-5461 to inhibit rDNA transcription was the result of inhibition of SL1 binding to the 47S promoter (9,61). However, our data clearly showed that neither SL1 nor UBF binding at the 47S or Spacer promoters was inhibited by CX-5461, excluding this as the mechanism of drug action. It has further been suggested that CX-5461 does not specifically target rDNA transcription, rather that it stabilizes DNA G-quadruplexes and in this way induces DNA damage and cytotoxicity (16). We investigated a potential role for DNA damage in the arrest of the RPI–Rrn3 pre-initiation complex using linear PCR to map proximal DNA breaks. No CX-5461-specific breaks were detected across the 47S promoter and flanking regions after 30-min CX-5461 treatment and Southern blotting also failed to reveal significant DNA breakage within the 47S gene body (Supplementary Figure S6D and E). Evidently, our present study argues conclusively that the drug does indeed inhibit rDNA transcription both in vivo and in vitro, and on this point, it is in agreement with the previous findings (9,22,74). Though our study does not speak directly to the role of G-quadruplexes, such structures would create topological constraints to transcription elongation or possibly to pre-initiation complex formation, both of which are excluded by our data as explanations of RPI transcription arrest by CX-5461. This said, G-quadruplex stabilization might still exacerbate the effects of CX-5461 downstream of its primary action on rDNA transcription. Most recently, Topo II ‘poisoning’ was also claimed as the target of CX-5461 (26). Though this conclusion was drawn from indirect data, Topo II was in fact previously shown to be recruited to the RPI initiation complex and to enhance both RPI initiation and elongation (75). As mentioned above, we did not observe an effect of CX-5461 on initiation complex formation or transcription elongation either in vivo or in vitro, making Topo II poisoning an unlikely mechanism. Another possibility is that CX-5461 might stabilize the DNA duplex strongly enough to prevent DNA melting over the initiation site but not propagation of the transcription elongation bubble. This said, it will be necessary to determine the atomic structure of the arrested initiation complex to finally resolve the exact mechanism of drug action. In this context, CX-5461 provides a novel tool to study the mechanism of RPI transcription initiation and the role played by Rrn3 in promoter release.
In summary, our data strongly support the scenario that the cytotoxicity of CX-5461 is the result of a block to promoter-driven RPI transcription initiation. This block leads to an aberrant mode of rDNA transcription and the concomitant generation of extensive DNA damage, including strand breaks potentially in the rDNA itself that are known to lead to genome destabilization (65,76). Indeed, it has long been hypothesized that the naturally unstable nature of the rDNA direct repeats acts as a general sensor of DNA damage (77). We believe the observation that CX-5461 enhances DNA damage by creating an irreversible block to rDNA transcription will be important in designing drug treatment strategies and the avoidance of drug resistance.
SUPPLEMENTARY DATA
Supplementary Data are available at NAR Cancer Online.
ACKNOWLEDGEMENTS
We would like to thank the staff of the ‘Centre d’Expertise et de Services Génome Québec’ for next-generation sequencing, Mark Robinson and Helen Lindsay (IMLS/SIB, University of Zürich) for making their computing facilities and advice available to us, and Amélie Fradet-Turcotte and Nicolas Bisson (CRCHU de Québec - Université Laval) for their helpful comments on an early draft of this manuscript. The Research Centre of the Québec University Hospital Centre (CRCHU de Québec—Université Laval) is supported by the Fonds de Recherche du Québec—Santé (FRQS).
FUNDING
Canadian Institutes of Health Research (CIHR) [MOP12205/PJT153266]; Natural Sciences and Engineering Research Council of Canada (NSERC) [RGPIN-2017-06128].
Conflict of interest statement. None declared.
Notes
Present address: Jean-Clément Mars, Institute of Research in Immunology and Cancer, Department of Pathology and Cell Biology, University of Montréal, Montréal, QC H3T 1J4, Canada.
REFERENCES
Author notes
The authors wish it to be known that, in their opinion, the first two authors should be regarded as Joint First Authors.

Comments