


Abstract
Conventional DNA bisulfite sequencing has been extended to single cell level, but the coverage consistency is insufficient for parallel comparison. Here we report a novel method for genome-wide CpG island (CGI) methylation sequencing for single cells (scCGI-seq), combining methylation-sensitive restriction enzyme digestion and multiple displacement amplification for selective detection of methylated CGIs. We applied this method to analyzing single cells from two types of hematopoietic cells, K562 and GM12878 and small populations of fibroblasts and induced pluripotent stem cells. The method detected 21 798 CGIs (76% of all CGIs) per cell, and the number of CGIs consistently detected from all 16 profiled single cells was 20 864 (72.7%), with 12 961 promoters covered. This coverage represents a substantial improvement over results obtained using single cell reduced representation bisulfite sequencing, with a 66-fold increase in the fraction of consistently profiled CGIs across individual cells. Single cells of the same type were more similar to each other than to other types, but also displayed epigenetic heterogeneity. The method was further validated by comparing the CpG methylation pattern, methylation profile of CGIs/promoters and repeat regions and 41 classes of known regulatory markers to the ENCODE data. Although not every minor methylation differences between cells are detectable, scCGI-seq provides a solid tool for unsupervised stratification of a heterogeneous cell population.
INTRODUCTION
DNA methylation occurs at cytidine residues of mammalian genomic DNA, principally in CpG dinucleotides (1). In most mammalian DNA there is a relative deficiency of CpG sites, which tend to cluster in regions of 300 to 3000 bp known as CpG islands (CGIs). There are 28 691 CGIs in the human genome, representing 0.7% of the whole genome (2). Approximately 40% of promoters of mammalian genes, including those of most house-keeping genes, are in CGIs. Although the role of methylation of the CpG sites outside of CGIs and of cytidines outside of CpG dinucleotides are increasingly studied (3–5), the methylation status of these CGIs or promoters is still considered a more profound regulator of the corresponding genes. Specific changes in the methylation states characterize various cell types and subtypes associated with development, differentiation, carcinogenesis, immune response and other biological processes (1,6–10). The effects of DNA methylation on cellular processes lead to complexity and heterogeneity among individual cells, and require a highly precise and robust method for elucidation.
Conventional methods for DNA methylation profiling—including bisulfite sequencing (BS), differential DNA binding (such as MeDIP) and resistance to methylation-sensitive restriction endonuclease (MRE) digestion—all require large amounts of DNA to yield confident readouts (11–15). Recently, single cell reduced representation BS (scRRBS) and genome-wide BS (scBS or scWGBS) (16–19) were reported to enable the analysis of the CpG methylome scaled down to a single cell, thus detecting cell-to-cell variability of methylation states both within and between different cell populations (20). scBS demonstrated high cumulative coverage (∼81% CGIs) but limited consistency, to date, with only as much as ∼21% CGIs among 16 single cells at the cost of whole genome deep sequencing. An in-silico data combination of pre-grouped single cells, each with shallow sequencing, demonstrated an increase in overall coverage (18,19). However, the subgroup structure of a population of cells is usually hard to define in advance at the single cell resolution, preventing this strategy from application to many cases (20). scRRBS significantly reduces the number of reads needed and lowers the cost, but the consistency—defined as the intersection of all CGIs covered across single cells—remains compromised (1.13% CGIs among 16 samples). The observed poor consistency is attributed in part to the harsh chemical processing required for DNA bisulfite treatment, which is prone to producing DNA breakage and loss. In short, while these approaches enabled single cell genome-scale DNA methylation mapping, they still have major limitations. Thus, alternative methods are needed for single cell genome-wide CpG methylation analysis with a highly consistent readout, at least at CGIs, and with a reduced cost per cell.
MRE-based approaches (13,14,21–23) provide a direct characterization of target CGI methylation requiring no harsh bisulfite conversion procedures, thus potentially reducing the random loss of profiled CGIs from single cells. Although MRE-approaches have been applied to single cell analysis (24–26), they were used to detect only a limited number of loci rather than CGIs at the genome scale. To significantly improve upon these methods, we here combined MRE digestion for distinguishing methylated versus unmethylated CGIs with multiple displacement amplification (MDA) that selectively amplifies methylated CGI-containing long DNA strands but not short unmethylated CGI fragments, followed by massive sequencing. We demonstrate not only genome-scale coverage, previously realized only through bisulfite sequencing, but also significantly improved consistency at the single cell level, representing a novel approach with major advantages over existing methods for single cell methylome analysis.
MATERIALS AND METHODS
Cells used in this study
Cell lines K562 and GM12878 were prepared as described in (27). Fibroblast and iPS cells were prepared as described in (28).
Overall experimental design and procedure of scCGI-seq
For the TEST sample, single cells were delivered to individual polymerase chain reaction (PCR) tubes and lysed to release genomic DNA, which was digested with a set of infrequent cut MREs (RE1, a specific MRE or a combination of multiple MREs). This digestion gave rise to cut highly enriched in CGIs and other sequences with high CpG content. The digested DNA was immediately subjected to MDA. The amplicon was then digested with the second set of restriction endonucleases (RE2, one enzyme, or a combination of REs, of which each was separately applied to digest different aliquot of the amplicon). The RE2 cuts frequently most CGIs in genome. The methylation control (MC) sample was processed with the same procedure but without the RE1 digestion step. With the fragments generated with RE2, next generation sequencing library was constructed and the insert fragments with ∼50–500 bp in length were enriched for sequencing (Figure 1). The same procedure was applied to low quantity cell (LQC, here 10–100 cells) samples; however, the bioinformatic analysis algorithm for LQC samples differs from that for single cells.
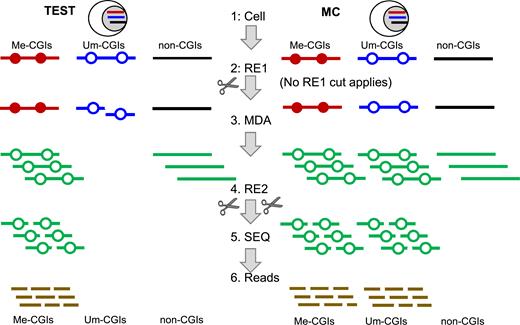
Schematic representation of CGI-seq. TEST: single cell being studied. Methylation control (MC): cells that are used to define the detectable CGIs or any other accessible methylated regions (AMRs), sharing the same genome as the TEST. For CGI-seq analysis, the genomic DNA is classified into three classes of sequences: Me-CGIs (representing methylated CGIs, and more generally, Me-AMRs) indicated as a red line, Um-CGIs (unmethylated CGIs, and generally Um-AMRs) indicated as a blue line and undetectable regions indicated as a black line. Green lines are amplified sequences. Solid dot: Me-CpG sites. Hollow dot: Um-CpG sites. The intact gDNA is released from cell (step 1) and digested with RE1 (TEST) or no digestion (MC) (step 2), followed by MDA amplification (step 3). The amplification product is then digested by RE2 (step 4), in which the short fragments are converted t‘o a library and subjected to massive sequencing (step 5). The reads are aligned to the genome (step 6) and the methylation status of the AMRs (particularly CGIs) is determined (‘Materials and Methods’ section). The AMRs detected in both the TEST and the MC are called Me-CGIs (or Me-AMRs). The AMRs uniquely detected in the MC but not in the TEST are called Um-CGIs (or Um-AMRs) of the TEST. RE1 (four MREs in combination: Cfr42I (SacII), PdiI (NaeI), Eco52I (EagI) and PteI(BssHII), FastDigest enzyme from Thermal Scientific Inc.) distinguishes Me-CGIs (Me-AMRs) from Um-CGIs (Um-AMRs). MDA selectively depletes Um-CGIs (Um-AMRs) of the TEST and amplifies Me-CGIs (Me-AMRs). RE2 (either BstUI alone, or a combination of 3 separate REs (ABH: AciI, BstUI and Hinp1I from NEB)) generates fragments specifically enriching CGI sequences (and other CG-rich regions) from non-CGI sequences.
Discrimination and selective amplification of methylated against unmethylated CpG island (CGI) sequences
Cells were suspended and washed twice with phosphor-buffered saline (PBS). Single cells were picked up with a 1–10 ul pipette and dispensed into individual PCR tubes with each cell transferred with ∼1 μl volume of sheath PBS. Three microliters (3) genomic lysis buffer (Zymo Research) was then added to each tube and the cell was lysed in 10 min at room temperature. DNA in the lysate was purified by ethanol precipitation using Dr GenTLE precipitation carrier (ClonTech). The purified DNA sample was treated in a 2-step reaction with a set of MREs in cocktail as RE1, including Cfr42I (SacII), PdiI (NaeI), Eco52I (EagI) and PteI (BssHII)(FastDigest enzyme from Thermal Scientific Inc.), called 4E collectively. Step 1 is the treatment with Cfr42I and PdiI in 1 × Tango Buffer at 37°C for 1 h. Step 2 is the treatment with Eco52I and Ptel after adjusting the buffer to 2 × Tango Buffer and incubating at 37° C for 1 h. Afterward, these MREs were heat-deactivated at 70°C for 10 min. The digested DNA sample obtained was immediately amplified using REPLI-g UltraFast Mini Kit (Qiagen) following the manufacturer-recommended protocol except that denature and neutralization steps were skipped. The amplicons were combined with negative controls (no cells but PBS only), which did not show any visible band on electrophoresis gel. The amplified DNA was purified using genomic DNA clean & concentrator kit (Zymo Research). Usually approximately 3–4 μg of DNA amplicon was obtained, sufficient for PCR evaluation and library construction. This above was for the TEST sample. The control DNA (MC) was conducted through the same process except that no RE1 digestion steps were applied.
PCR to evaluate the quality of amplicon
The quality of the amplicons after purification was evaluated using the procedure below. Two sets of PCR primers were designed. The first set of primers flanked known methylated cutting sites (termed as primers CGP), and the second set flanked known unmethylated cutting sites (termed as CGN). When these primers were used to examine the amplicons, the control sample (MC) amplicons showed defined size of bands for both sets of primers, whereas the TEST samples only showed the expected bands for the first set of primers. The sizes of PCR products and the sequences of primers used are the following: CGP1, 160 bp, TCACTGCAAGCTCTGCCTCT, CGGATCACGAGGTCAGAAGA; CGP2, 178 bp, CATGCCTATAACCCCAGCAC, ATTCTCCTGCCTCAGCCTCT; CGN1 (with gene C19), 185 bp, TAGACCGGGGTCGGGACAGGA, TGCCCGACAGGGCGTGTTTGA; CGN2 (with gene ACTB), 221bp, GTGGACATCTCTTGGGCACT, GACCCACCCAGCACATTTAG.
Library construction for reduced representation sequencing
To enrich the sequences for CGIs and other CpG-rich regions, 1.5 μg of amplified DNA from each sample was divided into three equal amounts and digested by one of the three RE2 reagents respectively: AciI, BstUI and Hinp1I (NEB), called ABH collectively. The condition of incubation is 3 h at 60°C for BstUI and at 37°C for AciI and Hinp1I. It was also tested for using BstUI alone as RE2 for comparison. After deactivation of the enzymes with the binding buffer of the purification kit DNA clean & concentrator kit (Zymo Research), the digested DNA samples were pooled for purification and then subjected to the reaction for End-repair and A-addition using NEBNext Ultra End Repair/dA-Tailing Module at 20°C for 1 h and then 65°C for 30 min, followed by Illumina sequencing adaptor ligation using NEBNext Ultra Ligation Module at 20°C for 30 min. The sample obtained was purified and size selected through an E-gel run (Invitrogen, EX 2% Agarose) into three pieces, which were separately purified, and each piece was eluted in 20 μl of elution buffer. All together, this covers the fragment size ranging from 50 to 500 bp. One-fourth of each piece of eluted DNA was applied to library PCR reaction (6–8 cycles) in 50 μl of reaction volume using Phusion high fidelity PCR master mix with GC buffer. The library products were size selected again on E-gels (size range from 175 to 625 bp), and the concentration and size profile were measured with a bioanalyzer (Agilent) before sequencing (Illumina HiSeq2500). A set of eight samples were pooled for multiplex sequencing at 75 × 2 PE seq with 30% of additional random-end library spiked-in for each lane.
The overall strategy for bioinformatic analysis
Firstly, the DNA regions (genomic blocks) in a known genome that are detectable with the procedure described above are termed as accessible methylation regions (AMRs), which theoretically include most CGIs, some promoters and other CpG-rich regions. These AMRs are determined using the MC data. The sequences not detectable using this approach are non-CGI and non-promoter regions, which however also contain small percentages of CGIs and promoters. Further, in each TEST sample, the AMRs are further identified as methylated (Me-) AMRs (Me-AMRs, particularly Me-CGIs) and unmethylated (Um) AMRs (Um-AMRs, particularly Um-CGIs). Secondly, an AMR is a sequence block that contains at least one informative fragment. An informative fragment is a short RE1 fragments (<3500 bp) generated when the given genome is in-silico digested with RE1, and contains at least one in-silico digested RE2 fragment with size from 50 to 500 bp within the RE1 fragment (these RE2 sites are called informative sites). These detectable CGIs or promoters are called informative CGIs or promoters; correspondingly the other non-detectable CGIs or promoters are called non-informative CGIs or promoters. As shown (Figure 1), the TEST samples are digested with both RE1 and RE2 with MDA conducted in between. The MC is digested with RE2 only after MDA. The MC data is used to determine all possible AMRs. When an AMR in a TEST sample shows statistically similar or more reads than MC samples, it is determined as Methyleted (Me-AMR, such as Me-CGI, Me-promoter); when an AMR in a TEST sample shows no or close to zero reads as compared to MC samples, it is called Un-methylated (Um-AMR, such as Um-CGI, Um-promoter).
In-silico cut
We searched RE1 and RE2 cutting sites in the hg19 version of the human reference genome by using the ‘restriction’ command line of EMBOSS software package (29). The RE1 fragments were removed if larger than 3.5 kb because large fragments have no different amplification efficiency between TEST and MC samples (described in the main text, also see Figure 2A and Supplementary Figure S1a), and therefore do not provide an informative signal. Next, RE2 sites within the retained RE1 cutting fragments were searched. The RE2 fragments within 50–500 bp were used directly for sequencing library construction, and the corresponding cutting sites were defined as the informative sites. The filtered RE1 fragments with informative RE2 sites were defined as the informative fragments. The sequencing data of these informative fragments allows for determination of methylation status inAMRs (CGIs, promoters or other genomic blocks).
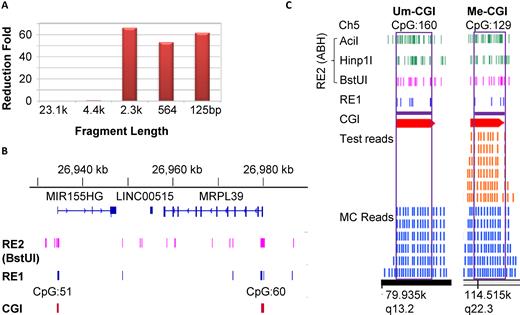
Demonstration of CGI-seq. (A) The qPCR shows the depletion of 2.3 kb and shorter fragments but selective amplification of 4.4 kb and longer fragments with MDA amplification. Lambda DNA was cut with HindIII and subjected to MDA, followed by qPCR with primers located in the center of each fragment. A 23.1 kb fragment is taken as the control to represent perfect amplification, and the fold reduction of amplification efficiency for a variety of fragments is shown. (B) A screenshot of IGV (Broad Institute, using hg19) for the RE1 and RE2 (BstUI) sites around 2 CGIs on chromosome 22. Both RE1 and RE2 are highly enriched in the two CGIs displayed, while RE1 cuts very rarely. (C) A typical distribution of sequencing reads for the TEST (brown) versus MC (blue) sample along with the distribution of RE1 and RE2 shown with a screenshot of IGB (bed file showing on Affymetrix, hg19). A Me-CGI (CpG 129) and an Um-CGI (CpG 160) are shown for the TEST (K562-100-cell sample t2 is shown with Bam file). Only the CGIs in-silico covered by both RE1 and RE2 (purple horizontal bar) are theoretically qualified as AMR in our design, which in practice have sequencing reads displayed in the MC control; therefore these two CGIs are of practical AMRs in this analysis. The reads of AMRs are regarded as informative reads. When a certain number of reads, see ‘Materials and Methods’ section) are present in the TEST, the CGI is called Me-CGI (CpG 129); when no significant read is seen in TEST, it is called Um-CGI (CpG 160). The read numbers for different sequences are variable; six reads/sequence are shown here as an example.
Methylation score of LQC (low quantity of cells) sample
Methylation score of single cell samples
Raw sequence reads were mapped against the hg19 version of the human reference genome usingBowtie2 with default parameters. Read counts for each informative fragment, instead of each informative site were calculated. Merging reads in each informative fragment generated with RE1 leads to loss of resolution, but provides greater read counts. Based on the experimental design, the read counts from each informative fragment as a whole can represent the associated AMR (such as a CGI). When multiple informative fragments are available for an AMR, the values of all informative fragments are combined.
Therefore, the DNA methylation states of informative fragments in a single cell can be classified into three groups: methylated (M or Me), un-methylated (U or Um) and half-methylated or methylation heterozygote (H or He, one allele is Me and the other allele is Um). For the methylated fragments, similar numbers of reads are detected from both TEST and MC samples, which means |$R_{{\rm test}}^i$| (read counts of fragment i in the TEST sample) is increased with and dependent on |$R_{{\rm mc}}^i$| (read counts of fragment i in the MC sample). Un-methylated fragments are supposed to have no sequence reads from the TEST sample, but some reads from the MC sample, such that |$R_{{\rm test}}^i$| is always near 0 and has no correlation with and is not dependent on |$R_{{\rm mc}}^i$|. Half-methylated fragments account for allele-specific methylation, in which |$R_{{\rm test}}^i$| increases with and is dependent on |$R_{{\rm mc}}^i$|, but the reads from the TEST sample are much lower than those from MC sample. Therefore, we applied a three-component mixture model to infer the probability of a fragment belonging to one of the methylation states using the EM algorithm.
Where G is the unobserved states, M, H and U are the three methylation states.
With these updated parameters, we perform another E-step to re-evaluate (|${\gamma _M}( i )$|, |${\gamma _H}( i )$|, |${\gamma _U}( i )$|) and iteratively run the algorithm until it converges.
If all of them are less than a given |${\epsilon _0}$|, with the default set to 0.005, then the EM runs will be stopped and we will report the parameter estimation.
Region-based DNA methylation, such as the methylation of an informative CGI or promoter, was calculated by averaging the methylation levels of all informative fragments (or the single informative fragment if only one such fragment is available) of the defined CGI (2) or promoter. A promoter region was defined as 3 kb regions upstream and downstream of the TSS (transcription start site) based on NCBI human RefSeq annotation. One representative TSS was chosen for each gene to avoid double counting.
Bulk methylation and ChIP-Seq data
The processed DNA methylation data, including Infinium human Methylation 450K array (M450K) and Reduced Representation Bisulfite Sequencing (RRBS), of K562 and GM12878 were obtained from the UCSC ENCODE website. ChIP-Seq peaks of multiple different classes of regulatory markers (such as variants of histone modifications)—related proteins of K562 and GM12878 were also downloaded from the UCSC ENCODE website. We calculated the average methylation score of all the peak regions for each of these classes of regulatory markers, and compared the average methylation score among single cell, LQC and bulk data. CGI annotation in the human genome was obtained from UCSC CGI track (2). CGI annotation in mouse was obtained from CAP-seq (CXXC affinity purification plus deep sequencing) experiments (32), the promoter regions and CGIs were defined and analyzed the same way as described in the section above.
All analyses were done in the R environment and with Bioconductor packages. Ward method in heatmap.2 was used to cluster samples, and Pearson's correlation was used to calculate the distance matrix.
RESULTS
Design of scCGI-seq
The design of the scCGI-seq method (called CGI-seq when the sample is not a single cell) is based on digestion of the single cell to be profiled (‘TEST’) with two sets of MREs as well as MDA (Figure 1). The amplicon was then processed with CGI-specific enzymes to generate short fragments consisting of methylated CGI sequences that are then sequenced. To infer the methylation state of individual regions, the results are then compared to those obtained using a ‘MC’ sample which is processed in parallel but without digestion by the first set of MREs. A region detected in both the MC and the TEST sample is called a methylated region in TEST; a region detected in the MC but not in the TEST sample is then called unmethylated in TEST. All methylated regions and unmethylated regions are collectively called AMRs, which is determined by MC, while a region not detectable in MC is not considered as a region covered by scCGI-seq.
Our method is based on MRE to replace bisulfite conversion for the initial discrimination of the methylation status of every AMR, which minimizes harsh DNA treatment, and eliminates other processes like end-repair and adapter-ligation required for RRBS, prior to DNA amplification (Figure 1). The amplification was performed with MDA, a robust and mild isothermal method (33–37). This approach works efficiently for long DNA fragments but very inefficiently for short DNA fragments, which has previously been considered a major limitation for MDA. In contrast, here we took advantage of this unique property of MDA to selectively amplify methylated CGIs because they remain intact and are mostly embedded in long DNA fragments whereas the unmethylated CGIs become short fragments upon MRE digestion. We quantitatively examined this property using a set of template DNA fragments of known sizes and found that the MDA amplification efficiency exhibited an abrupt drop as the template size decreased. DNA fragments larger than ∼4.4kb were efficiently amplified but fragments smaller than 2.3 kb showed >50-fold reduction of amplification efficiency (Figure 2A); the analysis of the whole spectrum of fragment sizes further confirmed this observation (Supplementary Figure S1a). Applying MDA to a pool of MRE-generated DNA fragments thereby selectively enriches intact methylated regions while depleting unmethylated regions.
CGI methylation often displays a bimodal pattern with the majority of CpG sites in a CGI either methylated or unmethylated (1,13,38–40). At the single cell level, this bimodality is even more pronounced (17–19). For a given CGI of a single cell, a call of a region that is both methylated and unmethylated indicates allelic heterozygosity of CGI methylation (41). In our approach, a set of MREs was carefully selected and characterized such that the optimized MRE combination recognizes the maximum possible number of sites in CGIs, with minimal sites available in non-CGI sequences, so as to retain the integrity of methylated CGIs with their flanking regions for efficient MDA amplification. After optimization, four MREs with 6-nucleotide recognition sites (BssHII, EagI, NaeI and SacII) were combined as the initial set of MRE (first set of restriction enzyme in this system, or RE1) to cut the genome (Supplementary Table S1, Figure 1, Supplementary Figures S1, 2 and ‘Materials and Methods’ section). In silico analysis demonstrated that the RE1 cutting sites were enriched in CGIs; the frequency of cutting sites in CGI sequences was approximately 4.5 sites per CGI, 185-fold greater than that in non-CGI sequences in terms of cutting sites per nucleotide (Supplementary Table S1 and Figure 2B). Among the 28 691 human CGIs (2), 23 235 (81%) of CGIs contained at least two cutting sites. This selective digestion permitted the whole genome to be efficiently amplified except for unmethylated regions. The amplicon was then digested by the second set of restriction enzymes (RE2) that have relatively frequent cutting sites at all AMRs (particularly CGIs) and thus convert the methylated regions into short fragments (50–500 bp) appropriate for library construction and sequencing. A qualified RE1 fragment (<3.5 kb) combined with one or multiple qualified RE2 fragments (each 50–500 bp) represents an informative fragment. We chose BstUI alone or a combination of AciI, BstUI and HpaII (named ABH) as the RE2 to digest the amplicon (Supplementary Table S2, Figure 2B, C and Supplementary Figure S2). When BstUI was used as RE2, we could theoretically detect 113,037 informative fragments and 187,696 RE2 cutting sites in the whole human genome. When ABH was used as RE2, the informative fragments were theoretically increased to 147 240 and the total RE2 cutting sites to 879 383. The total number of CGIs that can be detected (containing at least one informative fragment) in theory is 22 473 with ABH and 20 342 with BstUI, and the number of promoters detectable in theory (containing at least one informative fragment in 3 kb up and down stream of the transcription starting site) is 15 747 with ABH and 14 636 with BstUI, respectively. This RE2 treatment resulted in a reduced representation and yet consistent coverage of the AMRs. This procedure provided a highly selective and efficient means toward sequencing of the methylated regions.
We applied the procedure outlined above to each TEST sample in order to differentiate methylated from unmethylated regions. Based on the data from TEST and MC samples, we then obtained the methylation status of a region by aligning the actual sequencing reads to the in silico RE1 and RE2 cut sites and then comparing the aligned read numbers from TEST and MC samples to determine the methylation status of a region. The experimental and analytical approach was applied to low-quantity cell samples (LQC, 10–100 cells) before being applied, with necessary modifications of the bioinformatic algorithms, to single cells.
Our results are consistent with CpG methylation analysis of bulk cells
We first tested the CGI-seq method with 30 LQC samples. Reads were aligned onto the human genome version 19, and methylated as well as unmethylated regions were called (see ‘Materials and Methods’ section, Supplementary Table S3). We first validated our results against widely used benchmark data from the ENCODE Infinium HumanMethylation450 BeadChip bulk analysis (M450K). M450K covered 99% of RefSeq promoters and 96% of CGIs, which was more than RRBS (76.8% CGIs with bulk cells), and the result was consistent when comparing with other methods (13,42,43). We used a 5-fold level above minimal reads of the TEST sample (parameter C = 5) as the requirement for assigning a region in the TEST sample as methylated by balancing the detection rate and the data quality (Supplementary Figure S3a). We found a good correlation between the global methylation pattern of CGIs obtained with our method with LQC and the bulk M450K data (Pearson correlation coefficient R = 0.71, Figure 3A). We then investigated our data compared with ENCODE bulk data for 41 types of specific regulatory markers; we found that the methylation level of these markers were highly consistent between two datasets (R = 0.88–0.89, Figure 3B and Supplementary Figure S3b). We furthermore clustered the LQC samples for all detected CGIs and promoters, and found that the data from the same cell types clustered together (Figure 3C, D and Supplementary Figure S4), again supporting the validity of this method. The methylation levels of these cells (Supplementary Figure S3d) were in agreement with previous reports; in particular, we found that iPSC were more methylated than other cell types (44,45).
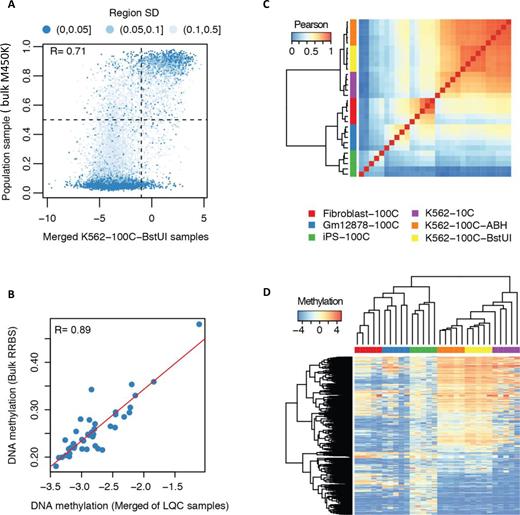
Characterization of CGI-seq on low quantity cells (LQC). (A) The correlation between the averaged methylation score of five 100-cell K562 samples and bulk M450K data with 350 000 K562 cells (UCSC ENCODE website). The Pearson correlation based on all informative CGIs was used to measure the diversity of CpG methylation. Region SD is the standard deviation of methylation scores of all CpGs in one CGI. Points in dark blue clusters are those CGIs whose CpGs have a similar methylation score, and points in light blue are those CGIs with diverse methylation of their CpGs. (B) DNA methylation levels of 41 classes of different regulatory markers between bulk ENCODE RRBS data and averaged LQC data generated by CGI-seq for K562 cell line. These 41 regions include Cbp, Cbx2, Cbx3, Cbx8, CGI, Chd1, Chd4, Chd7, Cfcf, Ezh2, H2az, H3k27ac, H3k27me3, H3k36me3, H3k4me1, H3k4me2, H3k4me3, H3k79me2, H3k9ac, H3k9me1, H3k9me3, H4k20me1, Hdac1, Hdac2, Hdac6, Lsd1, Ncor, Nsd2, P300, Pcaf, Phf8, Plu1, Pol2b, Promoter, Rbbp5, Rest, Rnf2, Sap30, Setdp1, Sirt6 and Suz12. (C) CGI-seq clustering based on Pearson correlation of CGI methylation across 30 LQC samples of four cell lines (Fibroblast-100C, GM12878-100C, iPS-100C, K562-100C and K562-10C). 100C: 100-cell sample; 10C: 10-cell sample. The samples not indicated with ABH (AciI, BstUI and HpaII) or BstUI are all cut by ABH as RE2. (D) Heatmap of the top 1000 variant CGIs in methylation across 30 LQC samples of four cell lines.
To further optimize and characterize our method, we then conducted three additional investigations using K562 cells with varying cell numbers or alternative RE2 sets: 10-cell samples digested with ABH, 100-cell samples digested with ABH and 100-cell samples digested with BstUI. The results from all samples demonstrated a similar pattern for both CGIs and promoters (in-group R was about 0.86, Figure 3C, D and Supplementary Figure S4); such a correlation coefficient is considered excellent for comparing completely different methodologies (13,14).
As expected, the number of CGIs and CpG sites detected increased with the sequencing depth (Supplementary Figure S5). When ABH instead of BstUI alone was used as RE2, more sequencing reads were required to generate the same level of CGI coverage. Indeed, for the same level of CGI coverage (11.1 million), more than twice the sequencing depth was necessary (37.0 million versus 16.5 million) for ABH, but ABH led to the coverage of more than 4 times the number of CpG sites (308.6 k versuss 69.6k, Supplementary Table S3). This observation reflects the fact that ABH provides multiple overlapping hits for each AMR, which resulted in more complexity and a better representation than BstUI alone (Supplementary Figure S2). This feature of ABH is useful for single cell measurements so as to maximize the signal obtained with the MRE digestion and MDA amplification.
scCGI-seq analysis of two hematopoietic cell lines
On the basis of the LQC results, we applied CGI-seq using ABH as the RE2 to eight K562 and eight GM12878 single cells isolated manually from cultures (Figures 4 and 5; Supplementary Figures S6–11). With the algorithm described (‘Materials and Methods’ section), the best coverage of the CGIs we obtained in a single cell was 22 21 (77.1%) of total CGIs (28 691), and the average was 21 798 (76.0%) (Supplementary Table S4 and Figure 4A). When the data of all 16 single cells generated with scCGI-seq were merged, 22 227 CGIs (77.5%) and 13 625 promoters were detected, of which 20 864 CGIs (72.7%) and 12 961 promoters were commonly detected across all 16 single cells. Notably, this coverage is comparable to conventional RRBS using millions of cells (22 037 CGIs or 76.8% of total CGIs). In general, the number of consistently covered CGIs would be further reduced if more single cell samples were tested (Figure 4A). Nevertheless, compared to other methods (Supplementary Figure S6), scCGI-seq provided the best coverage of shared CGIs when the same number of single cells was compared. The intersection of the coverage data of 16 single cells for scCGI-seq was ∼66 times higher than for scRRBS, and 3.6× higher than for scBS. In contrast, the number of CGIs consistently detected across 16 single human cell samples was 323 CGIs (1.13%) by scRRBS (17) and 4079 CGIs (14.22%) by scBS (18).
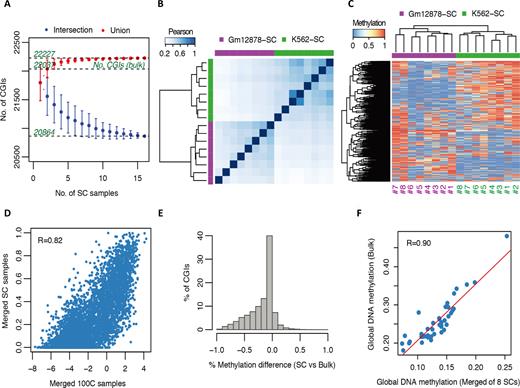
scCGI-seq. (A) Intersection and union coverage of CGIs across 16 single cells (SCs) with K562 and GM12878 analyzed together. (B) Unsupervised clustering based on Pearson correlation of CGI methylation profiles of scCGI-seq analysis across 16 SCs. (C) Unsupervised heatmap of top 1000 variantsof CGI methylation profiles on scCGI-seq analysis across 16 SCs. (D) Scatter plot between merged eight SCs and merged 100-cell methylation scores across all CGIs of the scCGI-seq analysis for K562 cell line. The imperfect correlation may due to different algorithms used for CGI-seq and scCGI-seq, and the limited number of single cells merged. (E) CGI methylation differences between averaged scCGI-seq values of eight SCs and ENCODE bulk M450Kresults of K562 cell line. (F) Global DNA methylation level of 41 classes of different regulatory markers (the same as in Figure 3B) between the averaged scCGI-seq analysis of eight SCs and the ENCODE bulk RRBS result of K562 cell line.
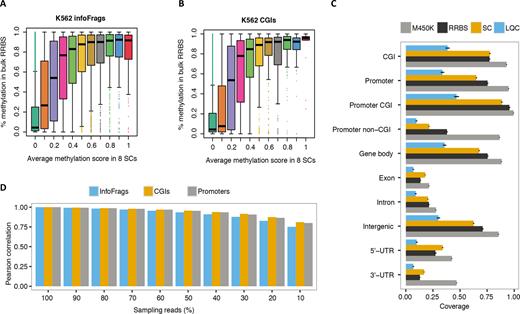
Genome-wide correlation and distribution of scCGI-seq. (A and B) Correlation of scCGI-seq versus bulk RRBS. X is the methylation rate displayed as 10 bins of the methylation score for the scCGI-seq result of K562, and Y is the methylation score of bulk RRBS of K562. (A) Informative fragments. (B) CGIs. (C) Comparison of the coverage in different genomic contexts for CGI-seq of LQC and SC samples to ENCODE M450K and RRBS bulk data of K562 and GM12878 cells. All LQC and SC samples studied in this report were used in the analyses. The standard error of samples in each group was plotted as error bar. Note that the M450K data has higher coverage than RRBS data. In addition, the M450K and RRBS are bisulfite conversion-based methods, and so their outputs are similar (Pearson correlation coefficients are 0.91 and 0.92 for CGIs in K562 and Gm12878 data). (D) The influence of sequencing depth on single cell methylation estimation is shown by Pearson correlation. A total of 3 315 469 kept reads (as 100%) from K562-SC1 (single cell1) were down-sampled to 90, 80, …, and 10%. DNA methylation of informative fragments, CGIs and promoters were estimated following the single cell method (see ‘Materials and Methods’ section). The correlation between K562-SC1 and down-sampling data (to 10% of the original reads) is still much larger (0.810 for CGI) than that between K562-SC1 and the other K562 single cell data, which is ∼0.468.
We then performed an unsupervised clustering of the entire scCGI-seq profile of all informative CGIs and promoters, which readily distinguished the two hematopoietic cell types (K562 and GM12878) among the 16 single cell samples (Figure 4B and Supplementary Figure S7a). Using the 1000 top-variant CGIs and promoters also effectively identified two cell type groups, and an appreciable level of cellular heterogeneity in CGI methylation was observed within each group (Figure 4C and Supplementary Figure S7b). Similarly, we found heterogeneity among single cells of the same type using RNA-seq and chromatin conformation analysis (46,47).
In addition, the methylation levels identified in 10-cell versus single cell samples, and 100-cell versus single cell samples, were consistent (R = 0.65–0.82, Figure 4D and Supplementary Figure S7c and d). When a cutoff of methylation difference was set at 0.5, only ∼13% of the CGIs differed between single cell and bulk data for both cell types (Figure 4E and Supplementary Figure S7e). We further extended the global comparison of single cell methylation patterns to several sets of specific genes. The scCGI-seq profile was compared with the average of ENCODE bulk RRBS data for the 41 classes of regulatory markers available for K562 cells and 15 markers available for GM12878 cells (Figure 4F and Supplementary Figure S7f). The pattern was highly consistent between single-cell and bulk CGI-seq (R = 0.90–0.92). We also validated the reliability of scCGI-seq by comparing the global methylation status of single cells at different AMRs to the bulk data generated by the ENCODE consortium using RRBS (Figure 5A and B; Supplementary Figure S8a and b). For both informative fragments and CGIs, the methylation rate measured with ENCODE data was highly correlated with the methylation score obtained with scCGI-seq. The heterogeneity of the cellular population quantified by scCGI-seq and LQC CGI-seq (Supplementary Figure S8c and d) as well as the coverage for variant categories of regions were also consistent (Figure 5c; Supplementary Figure S8e and f). These results demonstrate the robustness of CGI-seq.
Overall we observed more discrepant calls of unmethylated than methylated CGIs (12% for K562 and 13% for GM12878). This observation could be due in part to the possible miscounting of sequences identified as unmethylated CGIs that actually represented sequence loss during the processing of single cell-derived DNA, which is a common occurrence in single cell analysis (16–20). Furthermore, when using only 10% of the sequencing reads for analysis, which represents ∼3.5M sequenced reads and ∼2.1M mapped reads per sample, we found that the correlation was only slightly reduced (>0.8 for CGIs, Figure 5D and Supplementary Figure S9), while single cells were correctly clustered (Supplementary Figure S9b). This finding allows us to reduce the sequencing depth and substantially increase the number of single cells per batch in order to interrogate highly heterogeneous populations (Supplementary Figure S9c and d). Importantly, the pair wise Pearson correlation between merged single cells and merged LQC samples across K562 and GM12878 demonstrated that, as anticipated, the merged single cell and LQC samples were more correlated within the same cell line than across cell lines (0.71–0.83 versus 0.52–0.54, Supplementary Figure S10). This result indicated the value of scCGI-seq in unsupervised analysis of heterogeneity in CpG methylation.
We also found that the variation of CpG methylation within CGIs was much lower than that across CGIs (Supplementary Figure S11), which is consistent with previous results (17,18,39). This finding furthermore confirmed that the MRE digestion status of certain informative fragments represented the overall methylation status of the entire CGI. We observed a higher number of hypermethylated CGIs and promoters and a higher number of hypomethylated repeat regions in K562 (erythroleukemia cell) as compared to GM12878 (lymphoblastoid cell) (Supplementary Figure S12). These findings are supported by the current understanding of cancer methylation patterns (8,48).
DISCUSSION
Here we report the development of scCGI-seq, a bisulfite-independent method for genome-wide CpG methylome analysis at the single cell level. With this method, most AMRs, particularly CGIs, were consistent across all 16 single cells profiled. An unsupervised clustering of all CGIs and/or promoters revealed the differences in methylation patterns of single cells from two hematopoietic cell lines, K562 and GM12878. We found that the CGI methylation patterns deduced from merged scCGI-seq data were highly correlated with bulk data derived from the M450K and RRBS results. scCGI-seq also revealed the level of epigenetic heterogeneity and the overall methylation level of a cell type when a set of single cells were analyzed. These results indicate the potential of the method for applications such as stratification of a highly heterogeneous population at the single cell level for detection of subpopulations with a higher coverage of CGIs than the methods with bisulfite conversion (16–19).
The simplified procedure with off-the-shelf reagents and highly multiplexed target sequencing potentially allows for scale up to high-throughput analysis with cost efficiency and operation convenience. The minor discrepancy revealed through the comparison with bulk analyses is mainly due to the intrinsic differences of the two methodologies (13,14) as well as cellular heterogeneity (49–51). The loss of sequences during single cell DNA processing could result in false calls of unmethylated regions, but our analyses show that the contribution of this factor is minimal. The high efficiency of CpG site recovery with our method could be attributed to the process design in which genome-scale amplification is performed immediately following the MRE digestion in the same tube without purification or other enzymatic treatment, minimizing the loss of DNA sequences as compared with harsh chemical treatment, particularly bisulfite conversion.
Compared to scBS or scWGBS, scCGI-seq covers fewer total CpG sites across the genome because the BS methods detect all CpG at single nucleotide resolution in those fragments that are recovered. Although it recovers fewer fragments, scCGI-seq, consistently detects more CGIs shared by all single cells analyzed. Our method also consistently detects more shared CGIs than the scRRBS method for each single cell. scCGI-seq does not provide a result at the single nucleotide resolution, but it can measure the methylation status down to the level of single informative fragments, each of which includes at least four CpG sites, over a single genome and overall it faithfully informs about the methylation status of the CGIs, promoters and other AMRs. It has been recognized that low-depth sequencing for RNA could represent the transcriptomic profile of each single cell (52); however this is not the case for whole genome sequencing for single nucleotide variation (SNV) analysis (53), which requires high coverage (20), as does the whole genome DNA methylation analysis at single nucleotide resolution. A random, shallow sequencing of a whole genome could only allow a random detection of the DNA sequences, which would lead to inconsistent, low coverage of the CGI message (similar to SNV) and would less accurately reflect single cell methylation pattern. Indeed, scCGI-seq not only minimizes DNA loss by using a simplified and mild procedure compared to bisulfite conversion, but also enriches the CGI sequences so as to maximize the sequencing efficiency for CGIs. In addition, scCGI-seq may potentially detect homogeneously methylated and un-methylated CGIs, or half-methylated CGIs in which one allele is methylated and the other allele is unmethylated, but further improvements are necessary for large-scale population heterogeneity analysis. However, due to the dependence of a few MREs, which show uneven distribution on some AMRs or CGIs, and whose digestion on DNA may be occasionally incomplete although very rarely for single cell, the CGI-seq may not perfectly detect some minor difference between cells, especially on certain AMRs whose MRE sites are not evenly distributed.
In summary, scCGI-seq faithfully captures the methylation status of a single cell at the genome scale. It provides a new and robust tool for unsupervised stratification of a population of single cells, and efficiently elucidates DNA methylation heterogeneity at the single cell level, which makes it particularly useful in studies of development, differentiation, stimulation response and cancer. However, scCGI-seq does not promise detection of all small differences between cells. Potential improvements include recovering shorter fragments with the RE2 digestion so as to further increase the sequencing efficiency by focusing on CGIs, and recovering more informative fragments or sites for each detectable methylated region, and high-throughput and multiplex processing of a large panel of single cells in a run with an automated instrument. Because of the high CGI coverage and the faithful exome-sequence retaining, scCGI-seq could be used in combination with scRNA-seq and exome-seq to address the relationship of DNA mutation, CpG methylation and RNA expression genome-wide for each single cell (20). The principle used in scCGI-seq may also be extended to genome-wide mapping of 5-hydroxymethylcytosine (5hmC) for single cells using 5hmC-sensitive restriction endonuclease.
AVAILABILITY
The analysis code is available at: https://bitbucket.org/mthjwu/sccgi-seq.
ACCESSION NUMBER
The sequencing data was submitted to GEO; the access number is GSE75346.
SUPPLEMENTARY DATA
Supplementary Data are available at NAR Online.
ACKNOWLEDGEMENTS
We thank Drs Jie Deng, Jun Lu and Yoshiaki Tanaka for valuable discussions, and Dr Mei Zhong at Yale Stem Cell Center and Dr Shrikant Mane at Yale Genomics Cores for technical assistance.
FUNDING
National Institutes of Health Grants [P01 GM099130, R01 DK100858, U54 CA143798]; Packard Fellowship for Science and Engineering Award [201238215]; U.S. National Cancer Institute Physical Sciences-Oncology Program Grant [U54 CA193461]. Funding for open access charge: U.S. National Cancer Institute Physical Sciences-Oncology Program Grant [U54 CA193461].
Conflict of interest statement. None declared.
REFERENCES

Comments