


Abstract
Objective
We used passive acoustic monitoring (PAM) and automatic detection of spawning splashes to examine the timing and environmental drivers of spawning in river herring (Alewife Alosa pseudoharengus and Blueback Herring A. aestivalis).
Methods
Acoustic recordings of spawning splashes were collected from March to May 2021 in the Choptank River, Maryland, using an AudioMoth recorder. Recordings were analyzed using a random forest model on the Rainforest Connection ARBIMON platform to determine hourly presence–absence of splashes.
Result
At a seasonal scale, our results suggested two peaks in spawning activity: early March and mid‐April, corresponding with the known phenologies of Alewife and Blueback Herring. Hourly patterns in spawning activity suggested distinct diel cycles, with spawning most concentrated at dawn. In contrast, sonar fish counts collected for 1 week during the season indicated that migration occurred throughout daylight hours. We also found a potential relationship between spawning activity and the presence of great blue herons Ardea herodias.
Conclusion
Overall, our results demonstrate that PAM can be an efficient and affordable method for studying the spawning ecology of anadromous fish.
Monitoring fish migrations in rivers can be costly and time consuming. We present a method that automatically detects the splashing sounds some fish make when they spawn. Using this efficient method, we examine the timing and environmental drivers (e.g., temperature, tides, predators) of spawning in river herring.
INTRODUCTION
Anadromous fishes, such as many salmonids and alosines, annually migrate from marine to freshwater habitats to spawn. The predictable timing of these migrations makes anadromous species a valuable resource in coastal ecosystems, ecologically linking marine and freshwater food webs and supporting higher‐trophic‐level predators, including other economically valuable fish species (e.g., Largemouth Bass Micropterus salmoides and Atlantic Cod Gadus morhua; Yako et al. 2000; MacAvoy et al. 2009; Mattocks et al. 2017; Dias et al. 2019). Anadromous fish also support some of the most profitable fisheries in the United States (National Marine Fisheries Service 2021). River herring (Alewife Alosa pseudoharengus and Blueback Herring Alosa aestivalis), for example, were targeted by one of the largest fisheries in many regions along the Atlantic coast of North America in the mid‐20th century (Hildebrand and Schroeder 1928; Krauthamer and Richkus 1987). River herring, along with many other anadromous species, have since experienced severe declines in abundance due to habitat loss and overexploitation (Limburg and Waldman 2009). By the 2010s, river herring harvests were less than 2% of their historic peaks (ASMFC 2017).
The complex life cycles of anadromous fish and their dependence on freshwater habitats make them extremely vulnerable to anthropogenic disturbance. Loss of spawning habitat to human development and the damming of rivers that block spawning migrations have been identified as the most critical threats to anadromous fish populations (Atkins and Foster 1868; Limburg and Waldman 2009; Hall et al. 2012; Hasselman et al. 2016). Understanding the phenology of migration and spawning is critical for the management of anadromous fish, especially as these species are increasingly at risk from the detrimental effects of climate change and warming temperatures are causing shifts in the timing of migrations and further restricting suitable spawning habitat (Nye et al. 2009; Peer and Miller 2014; Lynch et al. 2015; Lombardo et al. 2019; Nack et al. 2019; Staudinger et al. 2019). Thus, for the restoration of river herring and other anadromous fish species, there is a need to monitor the timing of migrations and spawning patterns (Hare et al. 2021).
Monitoring of river herring phenology during their spawning migrations is conducted in many rivers throughout their range (ASMFC 2017). Often, the timing of spawning runs is derived from counts of individual fish as they move upstream through fish ladders or culverts. Methods used in such efforts include electronic resistivity counters, video recordings, and imaging sonar. However, each of these techniques has drawbacks. The accuracy of electronic counters can decrease during periods of high fish passage (Sheppard and Bednarski 2015), and video recordings are not as effective in turbid water or at night (Hiebert et al. 2000). In addition, both electronic counters and video recordings require narrow fish passage structures, which can obstruct fish migrations and affect passage rates. Imaging sonar can be used in natural, unobstructed waterways at night and in turbid waters, but smaller fish can be difficult to observe (Hightower et al. 2013). These three monitoring methods also require costly equipment, and in the case of video and sonar recordings, the investment of time into manually counting fish or automating counts. High costs are one factor limiting the widespread monitoring of river herring migrations within and among many river systems (Hare et al. 2021). Alternative, efficient methods could thus be valuable for filling gaps in the monitoring needs for river herring.
Several fish species have been observed to produce audible splashes at the surface of the water when they spawn, including Common Carp Cyprinus carpio, Northern Pike Esox lucius (Clark 1950), Bream Abramis brama (Poncin et al. 1996), Atlantic Sturgeon Acipenser oxyrinchus (Sulak et al. 2002), catostomids, and salmonids (Rountree et al. 2018). In some European fisheries, anadromous species such as the Allis Shad Alosa alosa and Twaite Shad Alosa fallax are monitored by counting the number of spawning splashes produced by male fish (e.g., Lebel et al. 2001; Baglinière et al. 2003; Chanseau et al. 2004). This method allows for the direct assessment of spawning activity and is conducted as an alternative to (or used in addition to) counting the number of individual fish. Although manual counting of spawning splashes can be costly, similar to the task of manually counting fish in video and sonar recordings, this problem can be solved by using methods to automatically detect splashes from acoustic recordings (Diep et al. 2013, 2016; Guyot et al. 2021).
Passive acoustic monitoring (PAM) and automatic detection of auditory signals and cues have been used to study the ecology and behavior of animals across taxa (recent examples in birds: Campos‐Cerqueira et al. 2021, Dickerson et al. 2022; frogs: Lapp et al. 2021; mammals: Bailey et al. 2021, Law et al. 2021, Madhusudhana et al. 2021, Palacios et al. 2021), including fish (Gannon 2008; Luczkovich et al. 2008). However, despite the imperiled status of many North American fishes (Jelks et al. 2008) and the need for monitoring programs (river herring: ASMFC 2012, Hare et al. 2021), these methods have rarely been applied to fish species in this region. Here, our goal is to provide a proof of concept demonstrating how PAM can be used to answer questions about the timing and environmental drivers of spawning in anadromous fish. As a case study, we monitor and analyze the spawning activity of river herring by collecting acoustic recordings and using a machine learning approach to automatically detect the presence of spawning splashes. We present examples for how these data can be applied, including to (1) assess the seasonal, daily, and hourly patterns of spawning activity; (2) examine the relationships between spawning and abiotic environmental factors (water temperature, river discharge, lunar cycle, solar elevation, and tidal cycles); (3) examine biotic environmental factors, such as the presence of predators (great blue heron Ardea herodias, bald eagle Haliaeetus leucocephalus, and osprey Pandion haliaetus); and (4) compare spawning activity with other monitoring methods (sonar counts) of fish migrating upstream.
METHODS
Study site
Acoustic recordings of river herring spawning splashes were collected from the Choptank River, Maryland, on the Eastern Shore of the Chesapeake Bay (38°59′40"N, 75°47′17"W; Figure 1). River herring are known to spawn at the study site, and spawning activity and splashes have been observed and recorded previously at this location (Figure S1; Videos S1–S3 [both available in the Supplemental Materials separately online]). The study site was also chosen due to the availability of river‐specific, multi‐year environmental and river herring run count data. The site is located just upstream of the tidal limit and is approximately 300 m downstream from a U.S. Geological Survey gauging station (01491000). National Oceanic and Atmospheric Administration tide predictions are available for the nearby town of Hillsboro, Maryland (station 8572669). For several years from 2013 to 2021, counts of river herring during the upstream migration were collected via imaging sonar at the same site used in the present study (Ogburn et al. 2017).
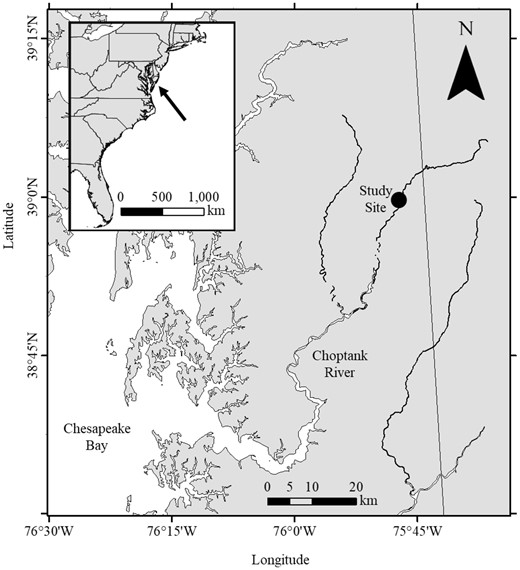
Location of the study site in the Choptank River, Maryland, on the Eastern Shore of the Chesapeake Bay (38°59′40"N, 75°47′17"W).
Spawning splash recording and processing
River herring spawning activity was monitored by documentation of splashing throughout the spawning season from March 8 to May 25, 2021, using an AudioMoth acoustic recording device (version 1.1.0; Hill et al. 2018, 2019). The AudioMoth was attached to a tree on the bank of the river approximately 2.5 m from ground level. Acoustic recordings were collected 24 h/day for 1 min every 10 min (i.e., 6 samples/h), yielding a total of 11,215 recordings. The recordings were analyzed using a random forest model (RFM) on the Rainforest Connection (RFCx) ARBIMON platform (https://arbimon.rfcx.org/; Aide et al. 2013; Bravo et al. 2017) to automatically determine the presence or absence of splashes. The RFM was trained using a subsample of 400 haphazardly chosen recordings in which the presence or absence of splashing had been manually determined. This subsample was evenly split such that 200 recordings had splashes and the other 200 did not. In each set of 200 recordings, 140 were used in model fitting and 60 were used to verify the model by assessing precision (true positives/[true positives + false positives]) and accuracy ([true positives + true negatives]/total). Following the RFM analysis, the per‐hour presence of spawning splashes was established. An hour was scored as having splashes if they were detected in at least one of the six recordings for that hour. Daily splash activity was calculated as the number of hours in which splashing was detected each day (0–24 h).
Abiotic environmental data
Hourly measures of water temperature (°C) were obtained using a HOBO Pendant water temperature logger (Onset Computer Corp Model UA‐002‐08; accuracy within ±0.53°C from 0°C to 50°C). Values of river discharge (m3/s) were obtained from U.S. Geological Survey gauging station 01491000, and water levels (m) relative to mean lower low water were obtained from National Oceanic and Atmospheric Administration tide predictions for station 8572669. Values for solar elevation (angle [degrees] from the horizon) were calculated in R version 4.0.3 using the astrocalc4r function in the fishmethods package (G. A. Nelson; available at https://cran.r‐project.org/web/packages/fishmethods/fishmethods.pdf). Daily lunar cycle values were obtained using the lunar.illumination function in the R package lunar (E. Lazaridis; available at https://cran.r‐project.org/web/packages/lunar/lunar.pdf). The lunar values are calculated from MULTIFAN‐CL fisheries stock assessment models from the R4MFCL project (Hoyle et al. 2009). All fish, predator, and environmental data were set to a local standard time of UTC‐5 (Universal Time Coordinated‐5).
Predator data
The presence or absence of the calls of three avian predators (great blue heron, bald eagle, and osprey) was assessed from the recordings of spawning splashes (n = 11,215). The calls from these species were too rare in the recordings to build subsamples for training RFMs. Instead, the presence of calls for each species was detected using the RFCx ARBIMON Pattern Matching algorithm to identify regions of interest that were similar (correlation coefficient r > 0.20) to example recordings of each species (Bravo et al. 2017). Recordings with regions of interest above the correlation threshold were manually reviewed to confirm avian call presence.
Sonar fish counts
Counts of adult river herring migrating upstream were conducted using imaging sonar at a site located 240 m upstream from the recorded spawning splashes. Counts were collected for the entire spawning season, but processed data from only a 1‐week period (April 15–21, 2021) during the estimated peak of the spawning run were available at the time of this study for making hourly comparisons between spawning splashes and fish counts. Imaging sonar video recordings were collected for 10‐min segments every hour using a dual‐frequency identification sonar (DIDSON) unit (Sound Metrics Corp). These recordings were processed in accordance with established protocols (Ogburn et al. 2017), wherein individual fish moving upstream in the recordings were manually counted by a trained observer using DIDSON version 5.25.52 software. The observer was trained using a standard set of files (Petreman et al. 2014).
Statistical analyses
Analyses of river herring spawning splashes were conducted using R version 4.0.3. The spawning season start, middle, and end dates were calculated as the dates by which 5, 50, and 95%, respectively, of the total hours with splashing present had been accumulated. The season duration was the difference between the start and end dates. Daily patterns in spawning splashes (hourly presence per day; values ranged from 0 to 24 h) were analyzed using a linear model in the glmmTMB package (M. Brooks; available at https://github.com/glmmTMB/glmmTMB). This daily model included the main effects of the daily change in water temperature, daily change in river discharge, and lunar cycle. Daily changes in water temperature and river discharge were used because both factors changed throughout the season: temperature increased, whereas discharge decreased. By assessing daily change, we separated daily patterns in these factors from the overall seasonal patterns (Wu et al. 2007; Ogburn et al. 2017; Legett et al. 2021). The relationship between daily patterns in spawning splashes and daily changes in environmental factors was further assessed using cross‐correlation analysis at lags of ±12 days, with 95% confidence intervals (CIs) calculated following Brockwell and Davis (2002).
Hourly patterns in the presence or absence of spawning splashes were analyzed using a generalized linear mixed‐effects model with a binomial error structure and logit link function. This hourly model included the main effects of water temperature, solar elevation, and tide (water level), with date included as a random effect. The fits of both the daily and hourly models were evaluated using diagnostic tools and residual plots in the package DHARMa version 0.4.5 (F. Hartig; available at http://florianhartig.github.io/DHARMa; Zuur and Ieno 2016). Hourly patterns in spawning splashes and abiotic environmental factors were further compared using cross‐correlation analysis at lags of ±12 h, with 95% CIs. We also examined diel cycles in hourly spawning splash patterns by calculating von Mises maximum likelihood estimates of the distribution of hours (mean μ and dispersion κ) in the package circular (C. Agostinelli and U. Lund; available at https://cran.r‐project.org/web/packages/circular/circular.pdf). A Rayleigh test of uniformity was used to examine the null hypothesis that spawning splashes were randomly distributed from hour to hour throughout the day. Longer term (>24‐h) and shorter term (<24‐h) cycles of hourly splash presence were additionally assessed using wavelet analyses in the WaveletComp package (A. Roesch and H. Schmidbauer; available at http://www.hs‐stat.com/projects/WaveletComp/WaveletComp_guided_tour.pdf).
The hourly patterns of the presence of avian predators and sonar fish counts were assessed by using a Rayleigh test of uniformity and by calculating von Mises maximum likelihood estimates of the distribution of hours. Hourly patterns in the presence of avian predators and spawning splashes were only compared at a lag of 0 h by calculating Pearson's r. Additional analyses of predator presence were not conducted because so few avian calls were detected in this study. Sonar fish counts and spawning splash presence were compared using cross‐correlation analysis at lags of ±12 h, with 95% CIs.
RESULTS
Temporal patterns of spawning activity
River herring spawning splashes were successfully recorded and automatically detected. The RFM validation using the subset of recordings in which the presence–absence of splashing had been predetermined indicated that the model achieved high precision (0.93) and high accuracy (0.92), with a true positive detection rate of 90% and a true negative detection rate of 93% (Table S1 available in the Supplemental Materials separately online). River herring spawning splashes were detected in 10% of recordings (1125 of 11,215). In 2021, the spawning season started on March 12 (day of year [DOY] 71) and ended on May 20 (DOY 140), lasting 70 days (Figure 2A). The middle of the season occurred on April 18 (DOY 108). There was a brief initial peak in the hourly presence of spawning splashes at the start of the spawning season in early March, followed by a more prolonged second peak around the midpoint of the season, approximately between April 15 and April 21 (DOY 105 and 111). The presence of spawning splashes fluctuated throughout the day and was most concentrated in the morning between 0400 and 0700 hours (μ = 4.61, κ = 0.52; Rayleigh test of uniformity: = 0.25, p < 0.001; Figure 3A). Peaks in hourly spawning splash activity occurred at approximately 12‐ and 24‐h cycles, as indicated by peaks in power of the wavelet spectrum (Figure 4).

Hourly presence of (A) river herring spawning splashes, (B) great blue heron calls, and (C) bald eagle calls per day detected from acoustic recordings. Vertical dotted lines in panel (A) represent the first 5% (March 12), 50% (April 18), and 95% (May 20) of spawning splashes (start, middle, and end of the spawning season).
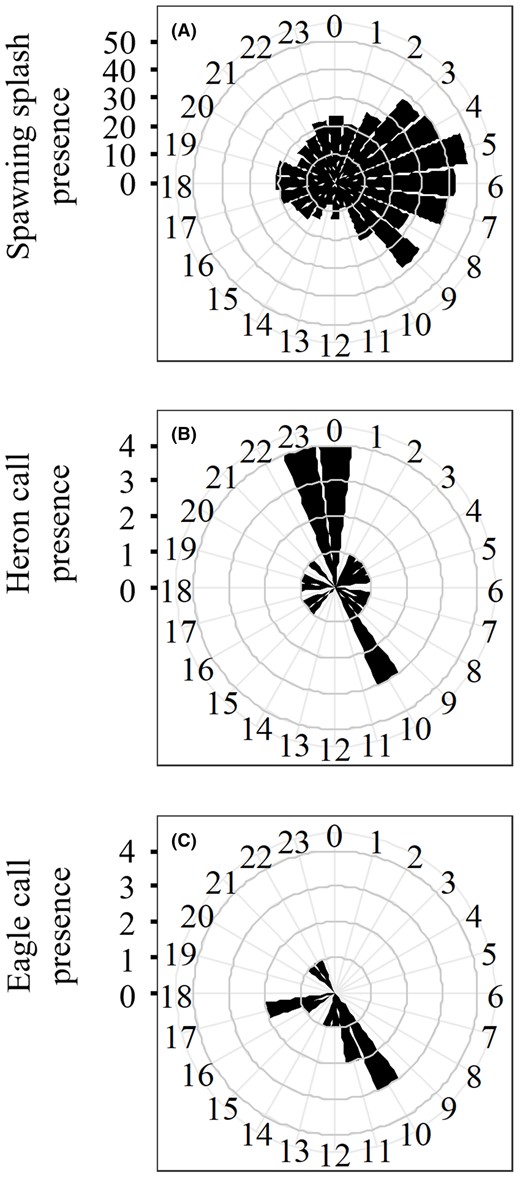
Circular histograms representing the time of day that (A) river herring spawning splashes, (B) great blue heron calls, and (C) bald eagle calls were detected from acoustic recordings. Black wedges indicate the total number of splashes or avian predator calls detected within the hour for the duration of the season.
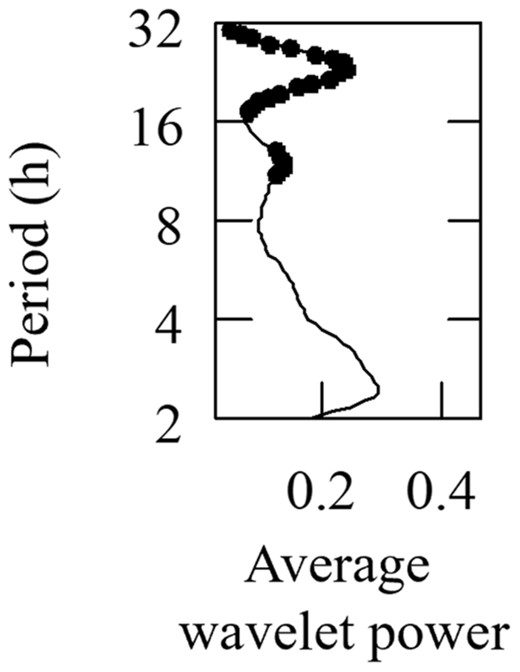
Wavelet analysis of the hourly presence of river herring spawning splashes. Black dots indicate peaks that exceed the 95% confidence interval.
Influence of abiotic environmental factors on spawning activity
At a daily scale, no significant relationships were observed between the presence of spawning splashes and daily change in the average water temperature, daily change in discharge, or the lunar cycle (Table S2; Figure S2). At an hourly scale, there was a significant but weak relationship between spawning splash presence and solar elevation (estimate < 0.01, z1865 = −3.67, p = < 0.001) and between spawning splash presence and tide (estimate ± SE = −0.62 ± 0.23, z1865 = −2.65, p = 0.008; Table S3). In a cross‐correlation analysis, hourly water temperature was positively correlated with spawning splash presence 2–12 h before peaks in spawning activity (peak r = 0.10; Figure 5A). Water temperature was positively correlated again 8–12 h after peaks in spawning activity (peak r = 0.10). Solar elevation was negatively correlated with spawning splash presence 0–9 h before peaks in spawning activity (peak r = −0.22; Figure 5B). Solar elevation was positively correlated 3–12 h after peaks in spawning activity (peak r = 0.24). Tide (water level) was negatively correlated with spawning splash presence from 2 h before to 2 h after peaks in spawning activity (peak r = −0.07; Figure 5C). Tide was positively correlated 3–12 h after peaks in spawning activity (peak r = 0.10).
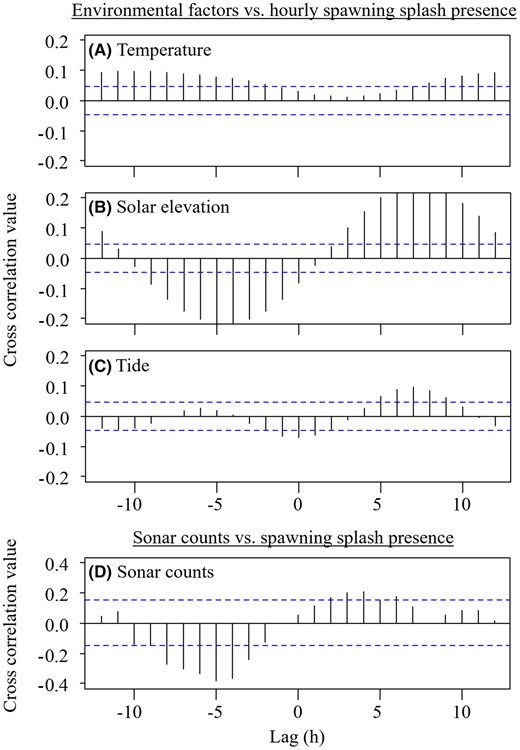
Cross‐correlation analyses of (A) water temperature, (B) solar elevation, (C) tide, and (D) sonar counts compared to the hourly presence of river herring spawning splashes at lags of −12 to 12 h. Horizontal dotted lines indicate the 95% confidence interval.
Link between spawning activity and predators
Pattern matching yielded 23 recordings with great blue heron calls, 12 recordings with bald eagle calls, and no recordings with osprey calls. The calls of both great blue herons and bald eagles were detected most often in late April through early May (Figure 2B,C). At an hourly scale, great blue heron calls were slightly correlated with the presence of spawning splashes (r1848 = 0.13, p < 0.001; Figure 3B), whereas bald eagle calls were not significantly correlated with spawning splashes (r1846 = −0.03, p = 0.278; Figure 3C).
Link between spawning activity and run counts
During the week of April 15–21, 2021, an estimated 11,364 river herring migrated upstream past the sampling site. Spawning splashes within this 1‐week period were most concentrated in the morning between 0300 and 0900 hours (μ = 5.29, κ = 0.84; Rayleigh test of uniformity: = 0.39, p < 0.001; Figure 6A), while sonar fish count estimates were most concentrated later in the morning and throughout the day from 0600 to 1900 hours (μ = 10.07, κ = 0.79; Rayleigh test of uniformity: = 0.37, p < 0.001; Figure 6B). Run counts were negatively correlated with spawning splash presence 3–8 h before peaks in spawning activity (peak r = −0.38) and were positively correlated 2–6 h after peaks in spawning activity (peak r = 0.21; Figure 5D).
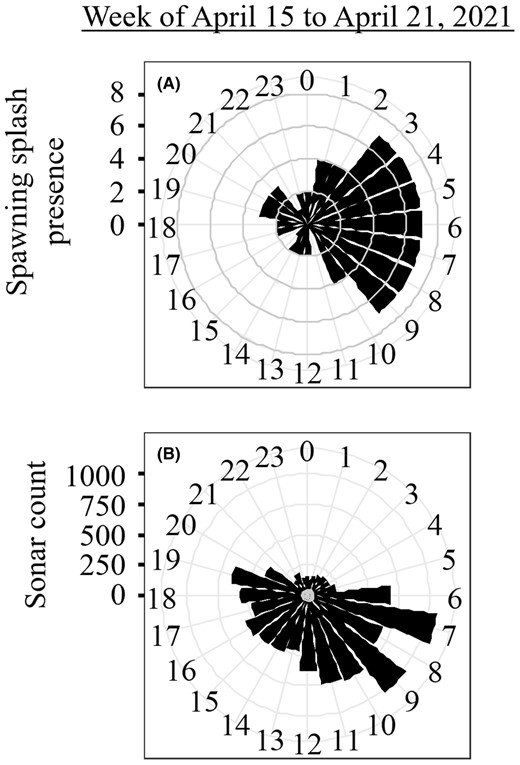
Circular histograms representing the time of day that (A) river herring spawning splashes were detected from acoustic recordings and (B) fish were counted while moving upstream based on sonar recordings. Black wedges indicate the total number of splashes detected or fish counted within the hour during the week of April 15–21, 2021.
DISCUSSION
In this study, we demonstrated the potential viability of PAM as a method for monitoring anadromous fish and addressing questions about the timing and environmental drivers of spawning activity. We recorded and automatically analyzed the sound of river herring spawning in the Choptank River, Maryland. Our results indicated seasonal, daily, and hourly patterns in spawning activity; revealed environmental drivers of spawning activity at these temporal scales; and suggested preliminary patterns in predator presence. We also demonstrated how PAM could be used to complement other monitoring methods, such as sonar counts of individual fish. The potential applications of PAM for monitoring anadromous fish are not limited to the examples covered in this study. Future studies using networks of acoustic recorders could be used to compare relative spawning activity and habitat use among and within river systems. Overall, PAM can be a valuable tool in filling the need for expanded monitoring of river herring populations and other anadromous fish species.
Temporal patterns and environmental drivers of spawning activity
Passive acoustic monitoring and automatic detection of spawning splashes revealed temporal patterns in the spawning activity of river herring in the Choptank River. At a seasonal scale, the hourly presence of splashes per day indicated two peaks in activity: a brief initial peak in early March and a longer peak during the midpoint of the season in mid‐April. Across their range, Alewife typically migrate and spawn earlier in the season in colder water, whereas Blueback Herring migrate and spawn later in the season in warmer water (ASMFC 2017; Hare et al. 2021). Alewife in the Choptank River are known to run from early March to mid‐April, while the Blueback Herring run occurs from mid‐April to late May (Speir et al. 2008; Ogburn et al. 2017). Thus, the early March peak in spawning activity may represent an early pulse of Alewife, and the second peak in mid‐April may be a period of overlapping presence of both river herring species. Day‐to‐day changes in river herring migration rates are linked to changes in water temperature, with a variable influence from other environmental factors, such as discharge and lunar cycle (e.g., Ogburn et al. 2017; Rosset et al. 2017; Lombardo et al. 2019; Legett et al. 2021). However, we observed no other patterns for daily changes in spawning activity, and our results did not suggest a relationship between spawning activity and daily change in water temperature, daily change in river discharge, or the lunar cycle.
Hourly patterns in spawning splash presence suggested that river herring were matutinal, as we found that splashes were most concentrated in the hours just before sunrise. In many rivers, including the Choptank River, previous analyses of fish counts conducted using nets, passive integrated transponder tags, and imaging sonar have indicated diurnal patterns in upstream migrations (Choptank River: Ogburn et al. 2017; other river systems: Cooper 1961, Saila et al. 1972, Kissil 1974, Richkus 1974, Mullen et al. 1986, Andrews 2014, Rillahan et al. 2021). However, nocturnal (McCartin et al. 2019) and crepuscular (Alcott et al. 2021) patterns in river herring counts have also been observed in some systems. During the week that river herring were counted by using imaging sonar in the present study, upstream movement was diurnal and increased in the hours following peaks in spawning activity. Thus, our results suggest that river herring spawned in the hours just before and after dawn and then migrated during the rest of the day. As with diel migration patterns, diel spawning patterns may vary between rivers based on local conditions. Previous studies in other systems have found no relationship between the duration of migration and the duration of spawning (Rosset et al. 2017). Further studies are needed to understand how diel patterns in migration might influence the diel patterns in spawning or how the relative timing of migration and spawning might vary between systems.
Solar elevation was the strongest indicator of hourly spawning activity, as measured by splashing, because of the distinct diel pattern. Shorter term (~12‐h) fluctuations in spawning activity also indicated a link with tidal cycles. We found that tide was negatively correlated with spawning splash presence from 2 h before to 2 h after peak spawning activity, suggesting an increase in spawning activity at low tide and a decrease at high tide. Spawning at tidal peaks (high or low) may be a strategy to avoid tidal currents that can interfere with spawning success (Hay 1990). The manner in which tides otherwise influence migrations is not well known, except where higher tides are needed for fish to pass anthropogenic obstacles, such as low dams, tide gates, and culverts (O'Connell and Angermeier 1999; Ogburn et al. 2017; Alcott et al. 2021; Rillahan et al. 2021). In addition to tides, our results suggest a correlation between higher water temperatures and hourly spawning activity, with increased spawning occurring 2–12 h after increased temperatures. Hourly changes in water temperature have been observed to influence the upstream migration rates of river herring (Ogburn et al. 2017) and the density of river herring eggs (O'Connell and Angermeier 1999). This leading influence of water temperature in our study is further notable because spawning splash presence peaked in the hours before dawn, when water temperatures were colder on average. Thus, water temperature may influence spawning activity independent of diel patterns.
Link between predators and spawning activity
When animals produce conspicuous auditory signals, they can attract “eavesdropping” predators that use the signals as cues to find their prey (Zuk and Kolluru 1998). Spawning splashes can expose fish to a wide range of potential predators, including mammals (e.g., black bear Ursus americanus: Klinka and Reimchen 2009; gray wolf Canis lupus: Gable et al. 2018), fish (e.g., European Catfish Silurus glanis: Boulêtreau et al. 2021), and birds (e.g., double‐crested cormorant Nannopterum auritum: Dalton et al. 2009). We detected the calls of bald eagles and great blue herons from mid‐April through May, roughly corresponding with the middle and end of the river herring spawning season. The calls of great blue herons were very weakly correlated with spawning splashes at an hourly scale, suggesting a potential relationship between spawning presence and predator presence. However, these results are highly speculative given the low number of predator vocalizations detected in this study. Additionally, predators could have been present at our study site without producing calls. Thus, while acoustic predators are an environmental factor that could be monitored using PAM, future studies that are designed specifically to compare predator presence and spawning activity are needed. Complementary detection methods that more directly assess predator presence, such as camera traps (e.g., Shardlow and Hyatt 2013), could be useful in establishing a link between spawning activity and predation.
Strengths, weaknesses, and future directions of acoustic monitoring of spawning splashes
Many fish produce species‐specific aquatic acoustic signals, which can be passively monitored to study their behavior and ecology (reviewed by Gannon 2008, Luczkovich et al. 2008; recent examples include Ibrahim et al. 2018, Picciulin et al. 2019, Van Hoeck et al. 2021). Similar to the monitoring of aquatic signals, terrestrial acoustic monitoring of spawning splashes can be an efficient method for measuring species presence as well as spawning activity (e.g., Lebel et al. 2001; Baglinière et al. 2003; Chanseau et al. 2004). The primary advantages of PAM methods are that they are relatively noninvasive and have a low cost compared to other monitoring techniques. In addition, PAM combined with automatic detection allows for the collection and processing of a greater amount of data across larger spatial scales and at higher temporal resolutions. Collection of acoustic recordings can also be analyzed to assess other environmental factors, such as the presence of predators, as demonstrated in this study.
The primary drawback of using spawning splashes to passively monitor fish is that the species cannot be distinguished. Although aquatic acoustic signals and cues can have species‐specific spectral and temporal characteristics that allow for species identification (Gannon 2008; Luczkovich et al. 2008), the sound of splashing is more generalized in comparison. In addition, animals other than fish can produce splashes when walking or foraging in water, and these sounds may be falsely interpreted as spawning splashes. In the present study, the two species of river herring (Alewife and Blueback Herring) could not be distinguished. Other fish species that migrate in the Choptank River during the spring, such as White Perch Morone americana and Yellow Perch Perca flavescens, may also confound our results (Ogburn et al. 2017). Thus, to assess species‐specific spawning activity, terrestrial acoustic monitoring of spawning splashes must be paired with aquatic (hydrophone) acoustic monitoring to collect species‐specific acoustic signals (Rountree et al. 2018). Biological samples (e.g., adult fish or eggs) or environmental DNA samples can also be paired with PAM to measure species‐specific spawning activity (Ogburn et al. 2017; Plough et al. 2018). Longer term use of PAM across multiple seasons will also allow for more accurate models that can better distinguish between spawning splashes and non‐target sounds.
Another limitation of PAM is the need for acoustically quiet environments. High levels of background noise, such as from fast‐flowing water or automobile traffic, may acoustically mask target sounds like spawning splashes. Noisy weather conditions, such as high winds or rain, are particularly critical, as they may affect spawning activity but may cause spawning splashes to go undetected by PAM. Examining the effectiveness of automatic detection programs when there is background noise and finding solutions to address this limitation constitute an important future direction for the use of PAM in fisheries management.
Given the advantages associated with the acoustic monitoring of spawning splashes, a number of other future directions for this method exist. We only collected sonar fish counts for 1 week during this study, which limited our comparisons between fish counts and spawning activity. Simultaneously recording spawning splashes and counting fish for the entire duration of the season in multiple years are needed to establish a link between measurements from these two monitoring methods. Other proxies of fish abundance, such as ichthyoplankton and environmental DNA concentrations (Plough et al. 2018; Ogburn et al. 2023), could similarly be collected throughout the season and linked to spawning activity. We also only recorded spawning splashes from a single location in the Choptank River. Further studies could assess spawning activity on a larger spatial scale across multiple river systems or multiple tributaries within a river system, addressing the need for expanded monitoring of river herring populations (Hare et al. 2021). Finally, spawning activity could be examined at a higher spatial resolution within a single tributary, such as by using a transect of recording devices placed along a stream (e.g., Lapp et al. 2021), to identify fine‐scale habitat use for spawning.
ACKNOWLEDGMENTS
We thank F. Wothers for his hospitality and for allowing us access to the study site. A.S. was supported by the National Fish and Wildlife Foundation (Award 67700), and H.D.L was supported by a Smithsonian Environmental Research Center postdoctoral fellowship.
CONFLICT OF INTEREST STATEMENT
There is no conflict of interest declared in this article.
DATA AVAILABILITY STATEMENT
Data for this study are publicly available on Figshare at https://doi.org/10.25573/serc.22277893.
ETHICS STATEMENT
Collection of acoustic data and sonar fish counts were approved by the Maryland Department of Natural Resources.
