


Abstract
Hatchery production of Chinook Salmon Oncorhynchus tshawytscha in the Columbia River basin comprises most of the anadromous salmonid production in this region. Hatchery facilities and programs serve to mitigate for impacts to salmonids due to the construction and operation of hydropower dams and habitat impacts from development in addition to the conservation and restoration of natural populations. A genetic method referred to as parentage‐based tagging (PBT) enables highly reliable detection of hatchery‐origin fish and inference of multigeneration pedigrees. This study compiles 11 years of PBT data from nearly 125,000 interior stream‐type Chinook Salmon from 24 spawning hatcheries located on tributaries of the mid‐ and upper Columbia River and in the Salmon, Clearwater, and Grande Ronde River subbasins. Multigenerational pedigrees allowed for investigation of the proportions of natural‐ and hatchery‐origin broodstock (pNOB and pHOB, respectively) for each hatchery and enumeration of the scale of production between segregated and integrated programs. We then compared how pHOB and the scale of production influenced the number of stray fish observed, genetic diversity, relatedness, and age‐class compositions within broodstocks. Over 91.0% of hatchery broodstock could be assigned back to their parents, and overall less than 1.0% of broodstock consisted of fish that were unintentionally incorporated into nonnatal hatchery programs. We evaluated 11 segregated programs with 0.0–10.0% pNOB, 9 intermediate programs (10.1–50.0% pNOB), and 3 integrated programs (>50.0% pNOB). There was no correlation between the scale of production or pNOB with the level of genetic diversity, but as production size increased, so did the effective number of breeders. This study demonstrates the utility of PBT as a monitoring tool for hatchery broodstocks, and results suggest that segregated and integrated programs have tradeoffs that generally align with their intended broodstock management purpose of providing fish for harvest and/or fish for supplementation or reintroduction.
The severe population declines of Pacific Northwest salmon and steelhead Oncorhynchus mykiss in the last 150 years can be attributed to a variety of factors, including construction of hydropower dams, negative impacts of hatcheries, historical overharvest, and habitat degradation due to mining, agriculture, and urbanization (McClure et al. 2003; Schaller and Petrosky 2007). In addition, there has been an increasing focus on concerns related to climate change effects on freshwater and ocean conditions, with worsening ocean productivity linked to decreasing survival and abundance of salmonids throughout the Pacific coast region (Scheuerell and Williams 2005; Chittenden et al. 2009). Twelve salmonid evolutionarily significant units in the Columbia River basin are listed as threatened or endangered (McClure et al. 2003; Gustafson et al. 2007). One strategy in place to prevent further declines and support natural populations is artificial propagation of salmonids in hatchery settings (Blankenship and Leber 1995). Within the Pacific Northwest, hatcheries produce over 325 million anadromous salmon juveniles per year (Flagg 2015). Of the salmon species, Chinook Salmon O. tshawytscha have the highest production of hatchery rearing, representing 56.0% of all hatchery‐reared juvenile anadromous salmon in this region (Flagg 2015). Hatchery programs are designed to increase the number of returning adults to mitigate for declining population abundance, but they are also managed to serve multiple objectives, including harvest augmentation, supplementation, and reintroduction (Mobrand et al. 2005; Naish et al. 2007). These hatcheries generally are operated as one of the following: (1) a segregated program, in which only hatchery‐origin adults are used for the broodstock; (2) an integrated program, in which a certain proportion of natural‐origin fish will be incorporated into the broodstock in an effort to preserve the genetic identity of the local population; or (3) a combination of both, depending on abundance (Paquet et al. 2011). There are potential adverse effects on fitness due to artificial propagation (Blankenship and Leber 1995; Levin et al. 2001; Naish et al. 2007; Berejikian and Van Doornik 2018; Tillotson et al. 2019), and management of the genetic resources of hatchery fish may need to be adjusted to avoid those effects. For example, the influence of hatcheries has been implicated in skewing age‐class proportions toward jacks, increasing the number of strays, and decreasing the genetic diversity and increasing genetic divergence between the hatchery‐ and natural‐origin spawning segments in a watershed (reviewed by Naish et al. 2007). In one example, spring Chinook Salmon reared at Warm Springs National Fish Hatchery (NFH) exhibited no difference in pre‐ and posthatchery genetic divergence, but a decrease was observed in the expected heterozygosity and effective population size of the posthatchery fish (Smith et al. 2014). Reproductive success can be lower in hatchery‐origin Chinook Salmon (Williamson et al. 2010; Anderson et al. 2012; Ford et al. 2015), but incorporation of natural‐origin fish into a hatchery broodstock program may mitigate the decreased fitness of hatchery fish (Paquet et al. 2011; Waters et al. 2015; Ford et al. 2016; Janowitz‐Koch et al. 2019).
Effective management of the various types of hatchery programs involves setting and meeting standards for the proportions of hatchery‐ and natural‐origin fish in the broodstock and the proportions allowed on spawning grounds (Mobrand et al. 2005; Paquet et al. 2011). For this type of oversight, hatchery fish must be identifiable, such as with a coded wire tag (CWT) or other physical tag (Paquet et al. 2011), an adipose fin clip, or DNA collected for parentage‐based tagging (PBT; Anderson and Garza 2006; Steele et al. 2019). Identification of hatchery fish can also aid in determining the number of hatchery‐origin fish on the spawning grounds, which can help to improve estimates of growth rates and/or declines for natural‐origin fish (McClure et al. 2003; Hinrichsen et al. 2016). Adipose clips are the most common marks used to identify hatchery‐origin anadromous salmonids (Johnson 2004). Since the late 1960s, CWTs, either in lieu of or in addition to adipose clips, have been used in the Pacific Northwest (Johnson 2004); however, the ability to recover CWTs is limited, which ultimately lowers the accuracy of estimated stock contributions (Beacham et al. 2019; Steele et al. 2019). Physical tags in hatchery‐released fish have traditionally been used in the calculation of the smolt‐to‐adult return ratio—a measure of success in fish returning to a hatchery (Beckman et al. 1999). Parentage‐based tagging works by genetically sampling all hatchery fish that are spawned in a brood year so that the offspring can be assigned to their hatchery of origin, parent pair, and brood year (a proxy for total age; Anderson and Garza 2006; Steele et al. 2019).
Although parentage analyses have been used for decades in salmonids (Wilson and Ferguson 2002), the routine collection of broodstock PBT data from Chinook Salmon hatcheries of the Snake River basin began in 2008 (for a comprehensive review of PBT, see Steele et al. 2019). With as few as 60–100 single‐nucleotide polymorphisms (SNPs; genetic markers that are frequently used for PBT), pedigrees can be constructed with a high degree of accuracy (Anderson and Garza 2006; Abadía‐Cardoso et al. 2013). One benefit of PBT is that tagging rates commonly approach 100% given the efficiency from genotyping a relatively small number of parents (Steele et al. 2019) in contrast to lower tagging rates for CWTs, which require physically tagging millions of juveniles, with tag rates generally between 10% and 20% (Beacham et al. 2017). Several studies have noted the accuracy of PBT for assigning fish to a hatchery of origin (Abadía‐Cardoso et al. 2013; Hess et al. 2016a; Beacham et al. 2017), including the detection of stray fish confirmed with CWT recoveries (Beacham et al. 2017). Studies using PBT have estimated stock‐specific abundances (Hess et al. 2016a; Beacham et al. 2020), detected thermal refuge utilization during periods of increased water temperatures (Hess et al. 2016b), and identified the proportion of hatchery fish on spawning grounds (Hinrichsen et al. 2016). Hatchery‐marked fish can be visually assessed for age, where it is generally easy to discriminate between age‐3 fish and older individuals based on length, but overlapping lengths often exist for ages 4 and above. Fish can be aged using scales or otoliths, but analyses with PBT can provide an accurate age‐class for nearly all fish that are genotyped (Beacham et al. 2017). The implementation of PBT has become streamlined, with the genetic baseline for PBT being housed in a shared repository (FishGen.net; McCane et al. 2018).
A major concern in the management of salmonid populations is the potential for straying of hatchery‐reared fish from segregated programs into natural populations, as there can be negative consequences for the recipient population, such as outbreeding depression, competition, displacement, and reduced resiliency (reviewed by Keefer and Caudill 2014). There are also potential benefits of straying in natural populations of salmonids, as it can lead to critical evolutionary advantages through recolonization of newly accessible habitat, such as after de‐glaciation or dam removal (Keefer and Caudill 2014; Pess et al. 2014; Pitman et al. 2010). In the upper Columbia River, the overall stray rate of natural‐origin Chinook Salmon and steelhead has been estimated at between 1.3% and 5.0% (Ford et al. 2015; Pearsons and O'Connor 2020), and rates tended to increase (up to 3 out of 18 fish) as the spatial scale decreased (Pearsons and O'Connor 2020). Stray rates have been shown to increase when fish are of hatchery origin or have at least one hatchery‐origin parent (Ford et al. 2015). The negative effects of straying are dependent on the size of the recipient and donor populations: straying into small populations will have a greater effect than straying into large populations (Keefer and Caudill 2014; Bett et al. 2017). Strays often fail to breed or have lower overall reproductive success (Keefer and Caudill 2014). Several mechanisms have been identified that can cause straying in hatchery salmonids; these include incomplete or interrupted juvenile imprinting due to limited time in rearing streams, adult sensory or memory failure, density‐dependent reproductive behaviors, genetic and life history effects, attraction to nonnatal sites, and downstream transportation of hatchery juveniles on barges (Keefer and Caudill 2014; Bond et al. 2016; Sturrock et al. 2019; Tattam and Ruzycki 2020). Implementing hatchery practices that mimic natural ecology and do not interfere with juvenile imprinting is often considered the best way to reduce the number of hatchery strays (e.g., Quinn 1993; Bett et al. 2017). There are several ways in which hatchery strays can be detected, including PIT tagging, coded wire tagging, and PBT; however, the high tagging rate with PBT makes this is a highly efficient stray detection method (Hess et al. 2014; Keefer and Caudill 2014; Pollock et al. 2020). Although stray rates of hatchery‐origin fish to natural spawning areas have been investigated in several previous studies, very few studies have examined the straying of hatchery‐origin fish that unintentionally become incorporated as broodstock in nonnatal hatchery programs (Keefer and Caudill 2014).
In parts of the Columbia River basin, over 10 years of PBT data have been collected for many Chinook Salmon hatchery programs. These data can provide a multitude of information, including the proportions of hatchery‐ versus natural‐origin fish incorporated as broodstock, the age‐class structure of each brood year, the rate of nonnatal inclusion in the broodstock over time, and genetic measures of diversity and differentiation. The focus of the current study is on hatchery programs throughout the Columbia River basin for the interior stream‐type lineage of Chinook Salmon (Waples et al. 2004). The hatchery programs for the interior stream‐type lineage are generally comprised of spring‐run and spring/summer‐run Chinook Salmon that originate from above Bonneville Dam and have a yearling life history, are rarely caught in the ocean, and are genetically distinct from summer‐run fish from the upper Columbia River, which belong to the interior ocean‐type lineage (Waples et al. 2004; Narum et al. 2010). Hatchery programs for interior stream‐type Chinook Salmon are widespread throughout the interior Columbia River basin and may have influenced the genetic variation in natural populations (Myers et al. 1998; Narum et al. 2010; Hecht et al. 2015).
In this study, we compared integrated and segregated interior‐stream type hatchery programs using the following primary characteristics: proportion of hatchery‐origin broodstock (pHOB), proportion of natural‐origin broodstock (pNOB), and scale of production, measured as the number of adult spawners. With these primary characteristics, we tested whether a greater pHOB would affect the following set of secondary standardized characteristics in a consistent manner according to our predictions: (1) number of strays among hatcheries; (2) genetic diversity, relatedness (effective number of spawners), and divergence; (3) age‐class proportions of broodstock; and (4) the number of each parent's offspring that become incorporated into the subsequent broodstock. We predicted that segregated programs using mostly hatchery‐origin broodstock could result in increased straying, decreased diversity, and/or age‐class proportions that are skewed toward jacks.
METHODS
Hatchery programs
The hatchery programs in this study are categorized by geographic location, including five major regions: Columbia River (mid to upper subbasins), Clearwater River subbasin, Grande Ronde River subbasin, Snake River, and Salmon River subbasin (Figure 1). Hatcheries with spring‐run Chinook Salmon in the lower Columbia River were not included since they represent a different genetic lineage than spring/summer‐run Chinook Salmon in the interior stream‐type lineage (Narum et al. 2010; Hecht et al. 2015) and because they were not included in PBT sampling in comparable years. Below, we provide a brief description of each hatchery program; more details can be found in Supplemental Table 1 (available in the online version of this article).
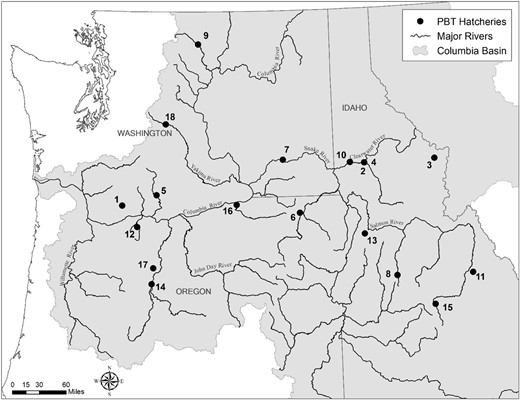
Map detailing the locations of Columbia River basin facilities rearing spring/summer‐run stream‐type Chinook Salmon for various hatchery programs sampled via parentage‐based tagging (PBT). Multiple stocks may be reared at each facility, but broodstock collection sites and juvenile release locations may differ depending on the program. Location numbers correspond to those in the “Map” column of Table 1.
Mid‐ and upper Columbia River hatchery programs
Data from PBT are available for a total of eight Columbia River hatchery programs beginning in either 2008 (Klickitat Hatchery) or 2012 (remaining hatcheries). There are five additional interior stream‐type spring Chinook Salmon hatchery programs in this region (Chief Joseph Hatchery, Eastbank Hatchery, Leavenworth NFH, Little White Salmon NFH, and Winthrop NFH) where sampling for PBT has begun; however, our study was limited to those hatchery programs for which data were available starting in 2012 or earlier in order to record multiple generations. Other lower Columbia River hatcheries spawn the ocean‐type or lower Columbia River lineages of Chinook Salmon and therefore were not included in this study. The included hatcheries are (1) Carson NFH on the Wind River, Washington; (2) Cle Elum Hatchery on the Yakima River, Washington; (3) Klickitat Hatchery on the Klickitat River, Washington; (4) Methow Hatchery on the Methow River, Washington; (5) Parkdale Fish Facility on the Hood River, Oregon; (6) Round Butte Hatchery on the Deschutes River, Oregon; (7) the Umatilla program on the Umatilla River, Oregon; and (8) Warm Springs NFH on the Warm Springs River, Oregon.
The spring Chinook Salmon program at Carson NFH began in 1955 to mitigate for the loss of Chinook Salmon in the main‐stem Columbia River due to the construction of dams and other developments along the Columbia River (USFWS 2004). Fish are collected from those returning volitionally to the hatchery. The original spring Chinook Salmon ancestry at Carson NFH included a mixture of upper Columbia River and Snake River populations that were trapped as they passed Bonneville Dam and were intended as mitigation as part of the Grand Coulee Fish Maintenance Program (USFWS 2004). Since the Snake River fish represented an out‐of‐basin transfer, the lasting genetic signatures of this are still observable (Hess et al. 2021). Natural‐origin returns to Carson NFH in recent years are likely of a Carson NFH‐stock background, as there were no native fish remaining in the Wind River (USFWS 2004). Cle Elum Hatchery supports an upper Yakima River spring‐run Chinook Salmon stock with the use of two programs: an integrated program and a segregated program (Fast et al. 2015). The integrated program uses natural‐origin fish exclusively as broodstock, whereas the segregated program contains only hatchery‐origin fish that are differentially marked by adipose clips or CWTs (YN 2010). Fish for broodstock are collected at Roza Dam on the Yakima River for both programs. Klickitat Hatchery originally operated as a segregated program but has recently been transitioning to an integrated program (YN 2018); for this study, Klickitat Hatchery is classified as “intermediate.” Broodfish for Klickitat Hatchery were sourced from individuals that returned naturally to the Klickitat River and were collected at Lyle Falls, at Castile Falls, and at the hatchery (YN 2018). Spring‐run Chinook Salmon for the Umatilla program are collected at Three Mile Falls Dam; they are held and spawned at the South Fork Walla Walla Facility, and the fertilized eggs are incubated and reared at Umatilla Hatchery (ODFW and CTUIR 2010). If broodstock goals are not met, fish from Carson NFH or Little White Salmon NFH are included as broodstock. The Umatilla spring‐run Chinook Salmon program is managed as an integrated program, but few natural‐origin fish are typically available for broodstock. Since Chinook Salmon were extirpated from the Umatilla River, Carson NFH‐stock fish were used to seed the program.
The Parkdale Fish Facility is part of the spring‐run Chinook Salmon hatchery program in the Hood River (CTWS and ODFW 2017). Spring‐run Chinook Salmon were extirpated from the Hood River; hence, donor stock from the Deschutes River was initially used as broodstock. This program rears fish returning to the Hood River, which are collected at the Moving Falls Fish Facility; the program aims to incorporate 10.0% natural‐origin fish. If broodstock goals cannot be met, fish returning to the Deschutes River are used. Incubation and rearing take place at Round Butte Hatchery for half of the Parkdale Fish Facility Chinook Salmon (CTWS and ODFW 2017). Round Butte Hatchery is located on the Deschutes River, and broodstock are collected from fish returning to the Pelton Trap at Round Butte Dam. Broodstock for Round Butte Hatchery were originally collected from fish at Sherars Falls on the Deschutes River, which is the same founding stock as was used for Warm Springs NFH; sharing of broodstock between these two facilities is ongoing (Smith et al. 2014; ODFW 2017). Warm Springs NFH is located on the Warm Springs River, a tributary to the Deschutes River, and operates as a part integrated program (Smith et al. 2014). Warm Springs NFH aims to incorporate 10.0% natural‐origin fish into the broodstock from all fish that return to the fish ladder located at the hatchery. In the upper Columbia River, Methow Hatchery on the Methow River is an integrated recovery program that serves to mitigate for losses of the salmon population upstream of Rock Island, Wells, Priest Rapids, Wanapum, and Rocky Reach dams. This program began natural‐origin fish collections in 1996 from fish returning to Winthrop NFH, Methow Hatchery, Wells Dam, and a fish weir located on the Twisp River (Chelan County PUD and WDFW 2015).
Clearwater River hatchery programs
Spring‐run Chinook Salmon in the Clearwater River were extirpated in the late 1920s after the construction of Lewiston Dam (IDFG 2011a) but were reintroduced and continued to return after the dam was removed in 1973 (Myers et al. 1998; Narum et al. 2007). The operation of hatcheries in the subbasin mitigates for the loss of spring‐run Chinook Salmon in the Clearwater River, and these hatcheries primarily operate as segregated programs to support harvest for tribal and recreational fisheries. There were four spawning hatcheries in the Clearwater River subbasin for which PBT data from 2008 to 2018 were available: (1) Clearwater Hatchery, (2) Clearwater Hatchery–Powell satellite facility, (3) Dworshak NFH, and (4) Nez Perce Tribal Hatchery (NPTH). Reintroductions of spring‐run Chinook Salmon into the Clearwater River basin were primarily from Rapid River Hatchery on the Snake River and from several sources downriver (Carson NFH, Big White Salmon Hatchery, Little White Salmon NFH, Leavenworth NFH, and captures at Bonneville Dam; NPT 2019). The NPTH program receives egg transfers from Clearwater Hatchery and Dworshak NFH, and the fish are then reared to full‐term smolts at NPTH (IDFG 2011a). The Powell satellite facility was originally founded with fish sourced from the Lochsa River; however, juveniles have also been sourced from Kooskia NFH, Dworshak NFH, and Rapid River Hatchery (IDFG 2011a).
Grande Ronde River hatchery programs
There are several tributaries of the Grande Ronde River in which spring‐run Chinook Salmon have been extirpated or in which returns are too low to support a viable population. Hatchery intervention to prevent extirpation is ongoing in the Grande Ronde River basin, with PBT data from 2008 to 2018 existing for five programs that operate at Lookingglass Hatchery: Catherine Creek, Grande Ronde River, Imnaha River, Lookingglass Creek, and Lostine River. These programs represent the release locations for the fish reared at Lookingglass Hatchery. The goal of each program is to maintain a locally adapted, distinct stock in each subbasin. Hatchery management for each unit is an integrated/recovery program wherein both hatchery‐origin (~70.0%) and natural‐origin (~30.0%) fish are incorporated into the broodstock (NPT 2011; ODFW 2011a, 2011b, 2011c); for this study, the five programs are classified as “intermediate” programs. The Lookingglass Creek stock was previously extirpated; therefore, fish from Catherine Creek were utilized as a source for reintroductions (ODFW 2011b).
Salmon River hatchery programs
Salmon River hatcheries operate to mitigate impacts to salmon and steelhead due to the construction and operation of four dams on the lower Snake River, the Federal Columbia River Power System, and/or the Hells Canyon Dam Complex that blocked or impeded the return of anadromous salmonids from the Pacific Ocean. Data from PBT for 2008–2018 are available for five Salmon River hatcheries: (1) McCall Hatchery, (2) Pahsimeroi Hatchery, (3) Rapid River Hatchery, (4) Sawtooth Hatchery, and (5) the Johnson Creek supplementation program (fish reared at McCall Hatchery). McCall Hatchery operates an integrated program and a segregated program that spawn spring/summer‐run Chinook Salmon from the South Fork Salmon River population (IDFG 2011b); here, we focus on the segregated program. All broodstock for this program are trapped on the South Fork Salmon River. Pahsimeroi Hatchery, operating as both an integrated and a segregated program, spawns spring/summer‐run Chinook Salmon from the Pahsimeroi River population (IDFG 2017a). Fish are collected from the lower Pahsimeroi River hatchery weir. Sawtooth Hatchery is a segregated program that spawns fish from the upper Salmon River spring‐run Chinook Salmon population, and broodfish are collected directly from a weir at the hatchery, located near the headwaters of the Salmon River (IDFG 2017b). Rapid River Hatchery operates as a segregated program to produce spring Chinook Salmon that are collected at both the Rapid River weir on the Little Salmon River and the Hells Canyon Dam trap on the Snake River. Offspring from these fish are destined for release in the Snake, Little Salmon, and Rapid rivers (IDFG 2016a, 2016b). The Johnson Creek program is an experimental supplementation program that incorporates only natural‐origin fish into the broodstock (Hess et al. 2012; Rabe et al. 2016; Janowitz‐Koch et al. 2019).
Snake River hatchery program
Lyons Ferry Hatchery has a program to supplement native Tucannon River spring‐run Chinook Salmon as a response to the four lower Snake River dams, which severely limited the number of native fish returning to the Tucannon River. Fish are collected for broodstock at the Tucannon Hatchery adult trap located on the Tucannon River and are spawned at Lyons Ferry Hatchery in Washington State (WDFW 2011). A program goal is to incorporate 50.0% natural‐origin fish into the broodstock.
Genetic data
The genetic data used in this study are housed in the FishGen.net (McCane et al. 2018) repository. We used the data available from interior stream‐type Chinook Salmon from 24 spawning programs, spawned at 17 hatchery facilities within the mid‐ and upper Columbia River basins. For 15 of the programs, data were available from brood years 2008–2018; for eight programs, data were available from brood years 2012–2018; and for the Tucannon River broodstock at Lyons Ferry Hatchery, data were available from brood years 2008–2014 (Table 1). There are an additional five hatcheries that spawn stream‐type Chinook Salmon from which PBT data were not available for the same time frame. Sample sizes varied among hatcheries and brood years (Table 1), for a total of 128,519 fish. During spawning at each individual hatchery, a hole punch or scissors were used to remove a piece of fin tissue or an opercle punch from each spawned fish. Tissues were placed on Whatman filter paper or in coin envelopes and, at a minimum, the spawn date and gender were recorded. Tissue samples were sent to the Idaho Department of Fish and Game (IDFG) Eagle Fish Genetics Lab (Eagle, Idaho) or the Columbia River Inter‐Tribal Fish Commission (CRITFC) Hagerman Genetics Lab (Hagerman, Idaho) for genetic analysis. Genomic DNA was extracted with a standard Qiagen DNeasy Kit (Qiagen, Inc.), a Chelex protocol (Sigma‐Aldrich), or a Nexttec DNA Isolation Kit (nexttec Biotechnologie GmbH). Broodstock samples were genotyped with the genotyping‐in‐thousands by sequencing (GT‐seq) method outlined by Campbell et al. (2015) for a panel of 298 SNP markers specific to Chinook Salmon (Janowitz‐Koch et al. 2019). The PBT analyses were performed with a subset of 93 SNP markers, and genetic stock identification (GSI) was performed with a subset of 177 SNP markers (Supplemental Table 2). For a complete list of primer and probe sequences, see Janowitz‐Koch et al. (2019).
Number of Chinook Salmon that were genotyped for each hatchery by brood year. Samples that failed genotyping at a 90.0% threshold and were found to be duplicated are excluded from the table. Numbers in the “Map” column correspond to labeled locations on the map in Figure 1.
| Hatcherya | Map | 2008 | 2009 | 2010 | 2011 | 2012 | 2013 | 2014 | 2015 | 2016 | 2017 | 2018 | Total |
| CNFH | 1 | 904 | 910 | 942 | 986 | 1,027 | 993 | 850 | 6,612 | ||||
| CTHCR | 6 | 57 | 159 | 70 | 72 | 83 | 84 | 92 | 103 | 71 | 76 | 84 | 951 |
| CLWFH | 2 | 983 | 668 | 741 | 566 | 611 | 790 | 1,201 | 1,144 | 1,487 | 1,619 | 1,068 | 10,878 |
| POWP | 3 | 864 | 545 | 413 | 846 | 642 | 219 | 618 | 25 | 345 | 438 | 354 | 5,309 |
| DWOR | 4 | 1,204 | 1,176 | 1,227 | 1,411 | 2,086 | 1,810 | 1,982 | 2,193 | 1,939 | 971 | 789 | 16,788 |
| GRRD | 6 | 25 | 360 | 430 | 317 | 148 | 359 | 141 | 175 | 1 | 138 | 150 | 2,244 |
| IMNH | 6 | 240 | 223 | 242 | 247 | 228 | 188 | 261 | 240 | 243 | 242 | 214 | 2,568 |
| KFH | 5 | 232 | 762 | 673 | 521 | 248 | 371 | 399 | 427 | 476 | 484 | 291 | 4,884 |
| LOOK | 6 | 149 | 63 | 154 | 146 | 744 | 118 | 126 | 152 | 283 | 84 | 149 | 2,168 |
| LSTW | 6 | 248 | 105 | 126 | 118 | 123 | 120 | 121 | 120 | 132 | 122 | 115 | 1,450 |
| TUCC | 7 | 119 | 169 | 159 | 164 | 162 | 149 | 126 | 1,048 | ||||
| JNCR | 8 | 71 | 53 | 68 | 63 | 57 | 74 | 64 | 72 | 65 | 60 | 95 | 742 |
| MCCA | 8 | 1,881 | 927 | 1,004 | 919 | 1,018 | 1,066 | 444 | 1,166 | 842 | 806 | 740 | 10,813 |
| METH | 9 | 164 | 98 | 116 | 117 | 112 | 137 | 127 | 871 | ||||
| NPTH | 10 | 191 | 420 | 487 | 356 | 241 | 372 | 347 | 456 | 557 | 377 | 180 | 3,984 |
| PAHH | 11 | 706 | 620 | 556 | 651 | 408 | 446 | 771 | 1,029 | 690 | 368 | 692 | 6,937 |
| PFF | 12 | 129 | 48 | 164 | 222 | 293 | 178 | 189 | 1,223 | ||||
| RRFH | 13 | 2,795 | 2,017 | 2,291 | 1,878 | 1,316 | 1,850 | 2,370 | 1,930 | 2,060 | 2,537 | 1,727 | 22,771 |
| RBFH | 14 | 666 | 412 | 275 | 888 | 313 | 841 | 681 | 4,076 | ||||
| SAWFH | 15 | 1,184 | 893 | 638 | 318 | 965 | 966 | 871 | 760 | 1,057 | 664 | 896 | 9,212 |
| UMAFH | 16 | 391 | 441 | 451 | 480 | 464 | 511 | 460 | 3,198 | ||||
| WSNFH | 17 | 434 | 481 | 110 | 262 | 627 | 667 | 291 | 2,872 | ||||
| CleElumINT | 18 | 368 | 307 | 360 | 435 | 389 | 340 | 308 | 2,507 | ||||
| CleElumSEG | 18 | 142 | 132 | 61 | 59 | 108 | 98 | 94 | 694 | ||||
| Total | 10,949 | 9,160 | 9,279 | 8,593 | 12,278 | 11,811 | 12,413 | 13,441 | 13,581 | 12,751 | 10,544 | 124,800 |
Hatchery codes: CNFH = Carson National Fish Hatchery (NFH); CTHCR = Lookingglass Hatchery–Catherine Creek program; CLWFH = Clearwater Fish Hatchery; POWP = Clearwater Fish Hatchery–Powell satellite facility; DWOR = Dworshak NFH; GRRD = Lookingglass Hatchery–Grande Ronde River program; IMNH = Lookingglass Hatchery–Imnaha River program; KFH = Klickitat Fish Hatchery; LOOK = Lookingglass Hatchery–Lookingglass Creek program; LSTW = Lookingglass Hatchery–Lostine River program; TUCC = Lyons Ferry Hatchery–Tucannon River stock; JNCR = Johnson Creek program; MCCA = McCall Hatchery; METH = Methow Hatchery; NPTH = Nez Perce Tribal Hatchery; PAHH = Pahsimeroi Hatchery; PFF = Parkdale Fish Facility; RRFH = Rapid River Fish Hatchery; RBFH = Round Butte Fish Hatchery; SAWFH = Sawtooth Fish Hatchery; UMAFH = Umatilla Fish Hatchery; WSNFH = Warm Springs NFH; CleElumINT = Cle Elum Hatchery integrated program; and CleElumSEG = Cle Elum Hatchery segregated program.
Spring‐run Chinook Salmon return to freshwater to spawn at an age of 3–5 years, with 4‐year‐old fish being the most common age‐class on the spawning grounds (Myers et al. 1998). With a baseline starting in 2008, returning adult offspring from the same cohort with all potential ages of 3–5‐year‐old fish could be detected in brood year 2013 (Supplemental Table 3). Assignments of offspring to parent pairs within the PBT baseline were assessed using the program SNPPIT (Anderson 2012). Confident assignments were accepted using a false discovery rate score of less than 0.1 and a logarithm‐of‐odds score greater than 14. Individuals that were not assigned via PBT were assigned to a GSI reporting group by using the program ONCOR (Kalinowski et al. 2007) and the baseline reported by Hasselman et al. (2017), which has been shown to be accurate in differentiating stock assignments at low genetic differentiation values (Araujo et al. 2014). Assignments with GSI were performed with a subset of 177 SNPs having close to 80.0% accuracy in assigning Chinook Salmon to reporting groups (Hasselman et al. 2017). Assignments with GSI were retained if the posterior probability was greater than or equal to 0.95. The pNOB was calculated using the average number of individuals that did not assign with PBT (i.e., were assumed to be of natural origin) across all brood years within a hatchery, corrected for the genetic tagging rate. The genetic tagging rate, defined as the number of known hatchery crosses that genotyped successfully in the broodstock divided by the total number of spawned fish, was used to determine the rate of untagged fish (1 – the tag rate; Hargrove et al. 2020; Delomas and Hess 2021). The proportion of fish with no PBT assignment was subtracted from this untagged proportion to achieve the pNOB.
The term “stray” fish in the study is defined as a fish that returned to a nonnatal hatchery and was incorporated as broodstock. Stray hatchery fish can often be identified through the presence of CWTs or PIT tags upon entry at the hatchery. In many years, hatcheries within the same geographic region and/or those spawning fish with shared genetic ancestry will share broodstock during low‐return years to meet hatchery production goals. In these cases, the fish returns to its natal hatchery and is spawned; therefore, a genetic record will appear in the PBT baseline of that parent pair. After spawning, the eggs will be transferred to a different hatchery for rearing and release. When a fish from this next generation returns to the rearing hatchery as an adult, PBT will identify that fish as having parents from a nonnatal hatchery and the individual will be designated as a stray. We conferred with hatchery managers about potential stray PBT assignments to determine which were “true” versus “false” straying events. To identify natural‐origin fish that strayed into a hatchery program and subsequently were spawned, GSI assignments were assessed for out‐of‐basin reporting group assignments or for assignments within a basin in which the hatchery stock did not belong.
Measures of genetic diversity and differentiation were estimated within and among brood years and hatchery stocks by using the 93‐SNP baseline. The R package GPoppin (https://github.com/StevenMicheletti/GPoppin) was used to estimate observed heterozygosity (HO), expected heterozygosity (HE), the inbreeding coefficient (FIS), and the amount of genetic differentiation (FST) and structure (principal components analysis). Relatedness among brood years within a hatchery was assessed in the R package Demerelate (Kraemer and Gerlach 2017), which includes the method of Blouin et al. (1996) to estimate the number of nonrelated, full‐sibling, and half‐sibling individuals. Based on the objectives of this study, it was expected that higher FIS and relatedness values would be observed in segregated hatchery programs with a smaller production size. Spearman's rank correlation (coefficient rs) was used to assess for correlations among the expected and observed numbers of full siblings, half‐siblings, and nonrelated individuals and the number of natural‐origin fish incorporated into the broodstock, the number of stray offspring, and the HO.
The effective number of breeders (Nb) was calculated with two different methods. First, the “true” Nb was calculated using equation (1) from Waples and Waples (2011). This method uses the number of parents in a brood year along with the number of offspring contributed by each parent to estimate Nb. These data were available for spawn years 2008–2014. Next, the linkage disequilibrium (LD) method (Waples 2006; Jones et al. 2016) was used to estimate Nb (Nb‐LD) for brood years 2008–2018 and to account for integrated programs in which the number of returning offspring is unknown since the fish are allowed to spawn naturally. Estimates of Nb‐LD were run in the program NeEstimator version 2.1 (Do et al. 2014). The census size (Nc), determined by how many adults were spawned at each hatchery, was used to obtain an Nb:Nc ratio. This measure of Nc will likely bias Nb:Nc ratios high, as it does not consider all fish that returned to a watershed—only those individuals that were selected by the hatchery for spawning.
RESULTS
Proportions of Hatchery‐ and Natural‐Origin Broodstock and Scale of Production
In total, 128,519 broodstock adults were genotyped across years from the hatchery programs included in this study. Of these, 3,551 (2.8%) failed genotyping at a 90.0% threshold or were found to be a duplicate sample and were discarded, leaving 124,968 samples for analysis (Table 1). Of those fish that did pass the genotyping threshold, 114,436 (91.6%) fish could be assigned back to a hatchery of origin with PBT analysis, resulting in only 10,532 (8.4%) that could not be assigned to a natal hatchery.
The pNOB in each hatchery ranged from 0.0% to 98.5% (Figure 2; Supplemental Table 4). Integrated programs (Cle Elum Hatchery integrated, Johnson Creek, and Methow Hatchery) had relatively high values of pNOB (>70.0%) compared to the segregated programs (11 of the 23 hatcheries; 0.0–10.0% pNOB; Figure 2). Among regions, hatcheries in the Grande Ronde River subbasin had greater pNOB values compared to most of the other segregated programs in the Salmon, Clearwater, and Columbia River subbasins (Figure 2). There was variation among years within hatchery programs for the number of fish spawned, but generally this was low (Table 1). From 2012 to 2018 (comparable time span for all programs except the Tucannon River program), Rapid River Hatchery (n = 13,790) and Dworshak NFH (n = 11,770) produced the most fish. The Johnson Creek integrated program had the lowest production size from 2012 to 2018 (n = 487), with the other integrated programs (Cle Elum Hatchery integrated: n = 2,507; Methow Hatchery: n = 871) being in the bottom half of all hatchery programs based on production size.
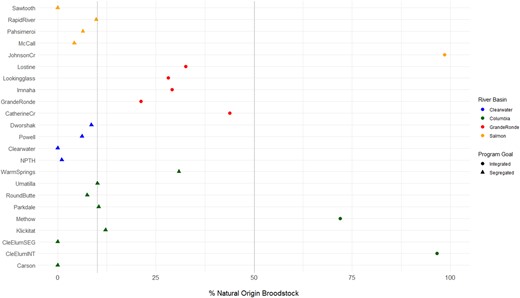
Proportion of natural‐origin Chinook Salmon broodstock (pNOB) in each hatchery program, corrected for tag rates, across all brood years (NPTH = Nez Perce Tribal Hatchery; CleElumSEG = Cle Elum Hatchery segregated program; CleElumINT = Cle Elum Hatchery integrated program). Dotted vertical lines represent the cut‐off values for designation in the current study for segregated (pNOB <10%), intermediate (pNOB = 10–50%), and integrated (pNOB >50%) programs. We evaluated 11 segregated programs, 9 intermediate programs, and 3 integrated programs.
Expectation 1: Straying
Straying was estimated among hatchery programs after accounting for known transfers among hatcheries. There was no correlation between the pHOB (rs = 0.29, P = 0.564) or the production size (rs = 0.11, P = 0.676) and the number of strays for both integrated and segregated programs (Figure 3). In total, there were only 512 straying events among hatcheries where fish were incorporated into broodstock (Figure 4A, B). The integrated hatcheries had 32 strays out of 4,009 total broodstock fish, the segregated hatcheries had 206 strays out of 112,449 broodfish, and the Lookingglass Hatchery programs with intermediate pNOB values had 238 strays out of 9,381 total broodfish. If considering the Columbia and Snake rivers as major basins, there were 141 strays among Columbia River hatcheries and 296 strays among Snake River hatcheries. Of those strays between major basins, there were similar numbers of Columbia River fish that strayed into Snake River hatcheries (n = 39) and Snake River fish straying into Columbia River hatcheries (n = 36) that were incorporated as broodstock (Figure 4B), despite there being more Snake River fish (n = 96,815) compared to Columbia River fish (n = 28,153).
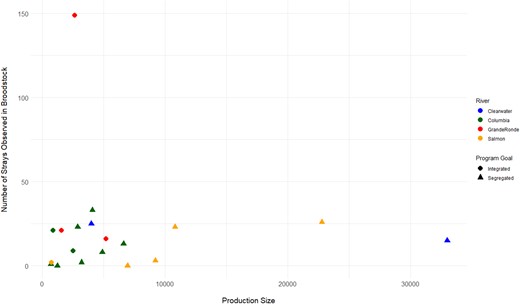
Production size of each hatchery (brood years combined) compared to the number of stray Chinook Salmon observed as part of the broodstock.
![(A) Proportion of returning adult Chinook Salmon offspring that returned to a natal hatchery and were incorporated as broodstock; and (B) the number of stray fish, defined as those that were born into a hatchery (natal hatchery; x‐axis) and returned to a nonnatal hatchery (returning hatchery; y‐axis). The colors in panel A correspond to fish that returned to the natal hatchery as 4‐ or 5‐year‐olds (light blue) or as jacks (dark blue) or fish that strayed to a nonnatal hatchery as 4‐ or 5‐year‐olds (dark brown) or as jacks (light brown). Samples from three of the Lookingglass Hatchery programs (Lookingglass Creek, Catherine Creek, and Grande Ronde River) are combined based on genetic structure analyses (labeled “Lookingglass”); the other two Lookingglass Hatchery programs are labeled separately (Lookingglass‐IMN = Imnaha River; Lookingglass‐LST = Lostine River). The Cle Elum Hatchery segregated program is labeled “Cle Elum SEG.” The integrated hatchery programs (Cle Elum Hatchery integrated [Cle Elum INT], Johnson Creek, and Methow Hatchery) and the Nez Perce Tribal Hatchery program are not included in panel A due to the small number of hatchery‐origin fish included as broodstock. In panel B, hatchery locations are grouped by river (see inset key). Note that additional hatcheries are listed in panel B to reflect strays from the interior ocean‐type lineage (i.e., fish spawned at Chief Joseph Hatchery, Little White Salmon National Fish Hatchery, or Wells Hatchery) into the spring/summer Chinook Salmon hatcheries included in this study.](https://oup.silverchair-cdn.com/oup/backfile/Content_public/Journal/najfm/43/3/10.1002_nafm.10890/8/m_nafm10890-fig-0004-m.jpeg?Expires=1750285625&Signature=jRrNB3gaH627YK1566o197Eef05d21JZPCZb5CBUWnDd89GK~Iu0dpKDTq3bxMVDG0eBly-FPtN56PQ5tL2zAAVegll-vahKB09UL8KzLG6ppEPHbfz7PSY9pZYszZU6-Bh5CWTd-K4WbwSMUFev-cgGV6Kn-c0cKy6woCcDWr7LFEwHlnDxAWy5o5hAG679LC2MPWycgO6vKtQWXCb~XUSaEc157fpbHrXZdePM6mF5zIt74NrblbXbIdOuwvd3dOu3C36MvbEKheTb2rVD7d5equ1YdQuHYhakg1OFOQcu5AdRn2yrWU7yIUUO4KLWclv1QCs4HT1yUp-p51ay-w__&Key-Pair-Id=APKAIE5G5CRDK6RD3PGA)
(A) Proportion of returning adult Chinook Salmon offspring that returned to a natal hatchery and were incorporated as broodstock; and (B) the number of stray fish, defined as those that were born into a hatchery (natal hatchery; x‐axis) and returned to a nonnatal hatchery (returning hatchery; y‐axis). The colors in panel A correspond to fish that returned to the natal hatchery as 4‐ or 5‐year‐olds (light blue) or as jacks (dark blue) or fish that strayed to a nonnatal hatchery as 4‐ or 5‐year‐olds (dark brown) or as jacks (light brown). Samples from three of the Lookingglass Hatchery programs (Lookingglass Creek, Catherine Creek, and Grande Ronde River) are combined based on genetic structure analyses (labeled “Lookingglass”); the other two Lookingglass Hatchery programs are labeled separately (Lookingglass‐IMN = Imnaha River; Lookingglass‐LST = Lostine River). The Cle Elum Hatchery segregated program is labeled “Cle Elum SEG.” The integrated hatchery programs (Cle Elum Hatchery integrated [Cle Elum INT], Johnson Creek, and Methow Hatchery) and the Nez Perce Tribal Hatchery program are not included in panel A due to the small number of hatchery‐origin fish included as broodstock. In panel B, hatchery locations are grouped by river (see inset key). Note that additional hatcheries are listed in panel B to reflect strays from the interior ocean‐type lineage (i.e., fish spawned at Chief Joseph Hatchery, Little White Salmon National Fish Hatchery, or Wells Hatchery) into the spring/summer Chinook Salmon hatcheries included in this study.
Of the 10,532 (8.4%) fish that did not assign via PBT analysis, 4,896 fish were assigned to a GSI reporting group. A total of 5,909 fish remained that could not be assigned via PBT or GSI analysis, resulting in 4.7% of all fish in the PBT baseline lacking assignments. In general, the GSI assignments corresponded to regions located within close geographic proximity to the return hatchery (Supplemental Figure 1 available in the online version of this article). Of the fish assigned with GSI, the presence or absence of an adipose clip or other hatchery mark was recorded for 3,637 fish. There were 1,451 fish with intact adipose fins and 2,186 fish with clipped adipose fins, resulting in a total of 1.8% (2,186 of 124,968) of known hatchery fish that were not assigned with PBT. Within each hatchery, the proportion of non‐PBT fish ranged from 2.3% to 56.5%. The hatcheries with the largest number of natural‐origin fish that could be positively identified by GSI included the Cle Elum Hatchery integrated program (96.3%) and the Johnson Creek program (97.4%), which confirms the goal of each program to breed natural‐origin fish (Hess et al. 2012; Fast et al. 2015).
Expectation 2: Genetic Diversity
The levels of heterozygosity and FIS at each hatchery were not associated with the production size (HO: rs = −0.12, P = 0.653; HE: rs = −0.05, P = 0.845; FIS: rs = −0.19, P = 0.457) or with pHOB (HO: rs = 0.30, P = 0.240; HE: rs = 0.31, P = 0.231; FIS: rs = 0.16, P = 0.531; Supplemental Figure 2A, B). Heterozygosity was also not correlated with pNOB (HO: rs = 0.36, P = 0.153; HE: rs = 0.34, P = 0.186) or with Nb (HO: rs = −0.12, P = 0.295; HE: rs = −0.10, P = 0.382; Supplemental Figure 3A, B). The HO and HE values ranged from 0.33 to 0.36 for integrated hatcheries and from 0.33 to 0.37 for the segregated hatcheries; the programs from Lookingglass Hatchery (intermediate) had an HO of 0.35 and an HE of 0.35. This may indicate that increasing the number of natural‐origin fish in a broodstock will not increase the levels of genetic diversity within the time frame observed here. There was a positive correlation between the production size and both Nb (rs = 0.88, P < 0.001) and Nb‐LD (rs = 0.31, P < 0.001; Figure 5A, B). A positive correlation existed between the number of nonsiblings and pNOB (rs = 0.24, P = 0.034), and there was a negative correlation between the number of half‐siblings and pNOB (rs = −0.25, P = 0.029; Supplemental Figure 4).
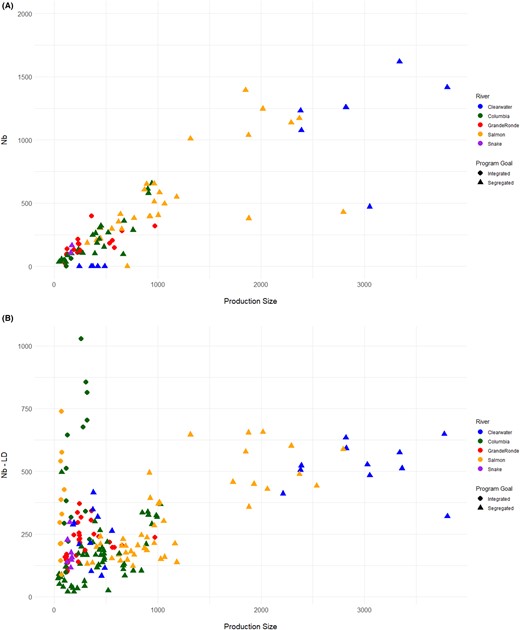
Effective number of breeders (Nb; as estimated with two different methods) compared to the production size of each Chinook Salmon hatchery: (A) Nb represented as a count of returning fish spawned as broodstock and (B) Nb estimated with the linkage disequilibrium method (Nb‐LD) based on genetic data (Do et al. 2014). An Nb value of zero is generated if none of the spawned fish produced offspring that returned to the hatchery.
Overall, HO and HE ranged from 0.31 to 0.37 (mean HO = 0.34; mean HE = 0.34; Figure 6; Supplemental Figure 5A, B). Generally, HO and HE were larger in the Columbia, Clearwater, and Grande Ronde River subbasins compared to the Salmon River subbasin (Figure 6). The mean FIS value across all hatcheries and brood years was 0.006 (range = −0.054 to 0.086; Supplemental Figures 6 and 7A, B). There were no linear trends in HO, HE, or FIS for all hatcheries across brood years, indicating that genetic diversity and relatedness varied randomly by year. There were larger numbers of full siblings and half‐siblings than expected for all hatcheries, with some exceptions in specific brood years (Supplemental Table 5). Measures of FST were largest among the hatcheries within the Columbia River versus the Salmon River (Supplemental Figures 8 and 9), which reflects known genetic structure in the region (Narum et al. 2010). The largest degree of differentiation was observed for the Cle Elum Hatchery programs, Klickitat Hatchery, Parkdale Fish Facility, Round Butte Hatchery, and Warm Springs NFH relative to the remaining hatcheries (Figure 7; Supplemental Figure 10). In general, there was minimal differentiation among years within each hatchery (Supplemental Figure 9), and programs were genetically more similar if located within the same geographic region (Supplemental Figure 10).
![Overall observed (dark shading) and expected (light shading) heterozygosities for each Chinook Salmon hatchery, with colors denoting river basin (ParkdaleFF = Parkdale Fish Facility; CleElumINT = Cle Elum Hatchery integrated program; CleElumSEG = Cle Elum Hatchery segregated program; WSNFH = Warm Springs National Fish Hatchery [NFH]; CLWDWOR = Clearwater Hatchery and Dworshak NFH; NPTH = Nez Perce Tribal Hatchery). The “Lookingglass” designation represents three of the Lookingglass Hatchery programs combined (Lookingglass Creek, Catherine Creek, and Grande Ronde River); the other two Lookingglass Hatchery programs are labeled separately (Lookingglass‐IMN = Imnaha River; Lookingglass‐LST = Lostine River).](https://oup.silverchair-cdn.com/oup/backfile/Content_public/Journal/najfm/43/3/10.1002_nafm.10890/8/m_nafm10890-fig-0006-m.jpeg?Expires=1750285625&Signature=gBhAzyOA-1Zkgvtj5F6lHTF79HzbIUdVgj3ZGqWxcrJu1-LdJ0IxT6WIb~8Fe505OcHXtl~YLthlsquzgZRRA5nabDWowTXN7HfOwo2fie493zgIQJbYxmaJWmVdC0P2abj5VQN5tFGWvCbTTqouwegOLpIDogelAmyxC7J400xM8~iXCKhd6j8g-M3xxtRxXF8tC5N1GRozlcKux7MdTkqpCRw3YmBVYAMVy0hbTEAZ5x1esLvifeArT8RIoVnbq7GQwR61Kh3HlDjmBfw8lv7ySWQSBD0JNjcU8Awb-xg63G9ZG0El9CfU3-6xVWt3WBIQglJnwrk9yxbeeD3IZw__&Key-Pair-Id=APKAIE5G5CRDK6RD3PGA)
Overall observed (dark shading) and expected (light shading) heterozygosities for each Chinook Salmon hatchery, with colors denoting river basin (ParkdaleFF = Parkdale Fish Facility; CleElumINT = Cle Elum Hatchery integrated program; CleElumSEG = Cle Elum Hatchery segregated program; WSNFH = Warm Springs National Fish Hatchery [NFH]; CLWDWOR = Clearwater Hatchery and Dworshak NFH; NPTH = Nez Perce Tribal Hatchery). The “Lookingglass” designation represents three of the Lookingglass Hatchery programs combined (Lookingglass Creek, Catherine Creek, and Grande Ronde River); the other two Lookingglass Hatchery programs are labeled separately (Lookingglass‐IMN = Imnaha River; Lookingglass‐LST = Lostine River).
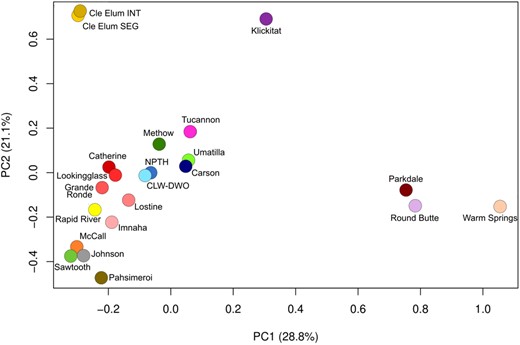
Principal components analysis of allele frequencies for each Chinook Salmon hatchery, with brood years combined (PC1, PC2 = principal components 1 and 2; Cle Elum INT = Cle Elum Hatchery integrated program; Cle Elum SEG = Cle Elum Hatchery segregated program; CLW‐DWO = Clearwater Hatchery and Dworshak National Fish Hatchery; NPTH = Nez Perce Tribal Hatchery).
Values of “true” Nb among hatcheries ranged from 0.0 in NPTH for spawn years 2010–2013 to 1,618 in the Clearwater River hatchery programs (Supplemental Figure 11A; Supplemental Table 6). The zero values in the NPTH program were due to the low number of returning adult offspring. There were also values of zero for the Johnson Creek and Cle Elum Hatchery integrated programs because the true Nb value could not be calculated since returning offspring are allowed to spawn naturally and are not taken for broodstock. The geometric mean Nb and Nb‐LD values across brood years were largest for the Clearwater River hatcheries (geometric mean Nb = 1,123; Nb‐LD = 331) compared to the Lookingglass Hatchery programs (Nb = 426; Nb‐LD = 309), the Salmon River hatcheries (Nb = 497; Nb‐LD = 271), and the Columbia River hatcheries (Nb = 135; Nb‐LD = 173; Supplemental Figure 11A). Ratios of Nb:Nc were on average 0.45 but ranged from 0.0 to a high of 0.977 in the Tucannon River program for spawn year 2009 (Supplemental Figure 11B).
Expectation 3: Assessment of Offspring Produced by Parents
There was a positive correlation (rs = 0.97, P < 0.001) between the production size and the number of returning adult offspring that were subsequently incorporated into the broodstock; however, this pattern was not observed for the integrated hatchery programs (Supplemental Figure 12). Of the 87,509 total fish that could be assigned via PBT from 2008 to 2015 to evaluate returns produced by parents, 37,651 parents produced at least one offspring that returned to a hatchery and was subsequently used as broodstock (43.0% return and incorporation rate). Note that this total includes the 2014 and 2015 brood years, for which data were not yet available to identify the 5‐year‐old returns from 2014 and the 4‐ and 5‐year‐old returns from 2015. There were 19,563 males that produced offspring that returned to a hatchery and 18,088 females that produced returning offspring (Figure 8). Most parents produced no returning adult offspring that were detected as subsequent broodstock (Figure 9A, B; Supplemental Table 7). From the 37,651 parents with at least one offspring, a total of 56,543 offspring were produced that survived and returned to a hatchery. If parents from brood years 2014 and 2015 were excluded (i.e., since not all offspring could be detected), the total number of parents producing at least one offspring was 30,757 (16,056 males; 14,701 females), with a return rate of 49.8%. Including all brood years, over half of the parental fish produced one (5,933 males; 6,507 females) or two (4,046 males; 4,452 females) offspring, with a range of up to 34 offspring from a single male and 41 offspring from a single female (Figure 9A, B; Supplemental Table 7).
![Proportion of male and female Chinook Salmon that produced an offspring that returned to a hatchery as an adult and was subsequently used in the broodstock program (blue and pink, respectively) compared to the proportion of parents for which we did not detect any returning adult offspring that was used in the broodstock program (gray). Gray bars can account for fish that incurred mortality at any life stage, were harvested in ocean fisheries or in‐river fisheries, were excluded as broodstock, or returned to natural spawning grounds. Integrated programs (Cle Elum Hatchery integrated program [Cle Elum INT], Johnson Creek, and Methow Hatchery) that targeted 100.0% natural‐origin broodstock were expected to have very few hatchery offspring represented since offspring from those programs are allowed to spawn naturally and are not intentionally collected as broodstock (gray bar approaching 100.0%). Samples from three of the Lookingglass Hatchery programs (Lookingglass Creek, Catherine Creek, and Grande Ronde River) are combined based on genetic structure analyses (labeled “Lookingglass”); the other two Lookingglass Hatchery programs are labeled separately (Lookingglass‐IMN = Imnaha River; Lookingglass‐LST = Lostine River).](https://oup.silverchair-cdn.com/oup/backfile/Content_public/Journal/najfm/43/3/10.1002_nafm.10890/8/m_nafm10890-fig-0008-m.jpeg?Expires=1750285625&Signature=jXDdC5fw4M1G-rAMB7QOVX-w0n5tKZMO5f0csK1sAFFEr3zfcOWH6F1y63tQpLEDPEIAY1CKjzBpOBoDxAiphsv5EuYpu8MIbUmCPBPa6sDBNiPHfl10TMcKy-PLCQUT6iznxNKJwyia5e4OBFzfiFv8V~l09ColBXR0AaW5jTbPlb5k8zP40skC5x5EbNpZ~VHk4NhdczFv~A92kedirEVQzJfC65NpS~x8bJbFNqoTKY9ILmnu9iZD3xmTs4R6OO56TiUC~PMAPhSahFI-DtiUXYMMAjWX7dceQ6qxzq85MXlMcbDGOxGDFcXzAR9nRf0kMHYX2uufy5-8BMEoGw__&Key-Pair-Id=APKAIE5G5CRDK6RD3PGA)
Proportion of male and female Chinook Salmon that produced an offspring that returned to a hatchery as an adult and was subsequently used in the broodstock program (blue and pink, respectively) compared to the proportion of parents for which we did not detect any returning adult offspring that was used in the broodstock program (gray). Gray bars can account for fish that incurred mortality at any life stage, were harvested in ocean fisheries or in‐river fisheries, were excluded as broodstock, or returned to natural spawning grounds. Integrated programs (Cle Elum Hatchery integrated program [Cle Elum INT], Johnson Creek, and Methow Hatchery) that targeted 100.0% natural‐origin broodstock were expected to have very few hatchery offspring represented since offspring from those programs are allowed to spawn naturally and are not intentionally collected as broodstock (gray bar approaching 100.0%). Samples from three of the Lookingglass Hatchery programs (Lookingglass Creek, Catherine Creek, and Grande Ronde River) are combined based on genetic structure analyses (labeled “Lookingglass”); the other two Lookingglass Hatchery programs are labeled separately (Lookingglass‐IMN = Imnaha River; Lookingglass‐LST = Lostine River).
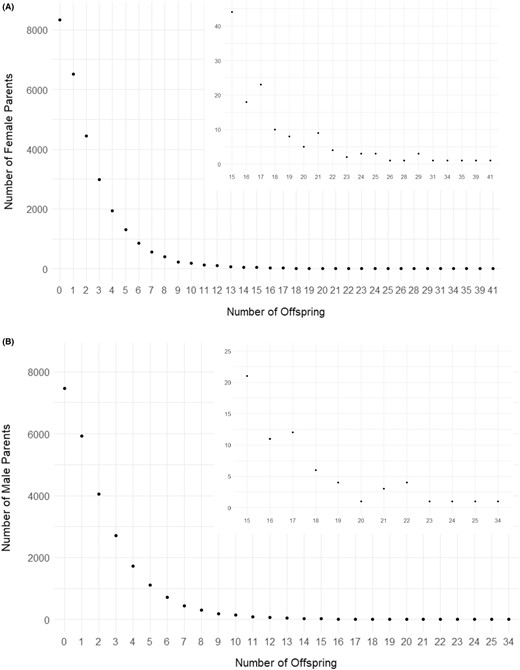
Number of Chinook Salmon (A) females or (B) males (y‐axis) and the number of offspring produced by a single male or female parent (x‐axis). Inset plot shows a magnified view of the number of females or males that produced 15 or more offspring.
Expectation 4: Age Composition of Broodstock
As hatchery production increased in the segregated programs, the numbers of both 3‐ and 5‐year‐old adults also increased (rs = 0.90, P < 0.001; Figure 10A). In the integrated programs, a full accounting of all age‐classes could not be detected in the returning adult offspring since those fish are allowed to spawn naturally. In all hatchery programs, broodstock predominately consisted of 4‐year‐old fish (43,296), followed by 5‐year‐olds (3,007) and 3‐year‐olds (1,501; Figure 10B; Supplemental Table 8). In over half of the surveyed hatcheries, 4‐year‐old fish comprised over 90.0% of the broodstock, with the broodstocks from Parkdale Fish Facility, Methow Hatchery, and Warm Springs NFH being composed of over 97.0% 4‐year‐old fish (Supplemental Table 8). In the majority of programs, the proportion of each brood year consisting of 3‐year‐old fish was no greater than 5.0%; the exceptions were Round Butte Hatchery (7.4% 3‐year‐olds), Lookingglass Hatchery (8.4%), and the Cle Elum Hatchery segregated program (15.9%). Seven programs incorporated 5‐year‐old fish at over 5.0% of the broodstock, including Rapid River Hatchery (5.1%), Lookingglass Hatchery (6.7%), Dworshak NFH (7.5%), McCall Hatchery (7.6%), Sawtooth Hatchery (8.7%), Pahsimeroi Hatchery (10.4%), and NPTH (18.2%; Supplemental Table 8). The integrated hatchery programs (Cle Elum Hatchery integrated, Johnson Creek, and Methow Hatchery) were not included in this analysis due to the small number of hatchery‐origin fish included as broodstock.
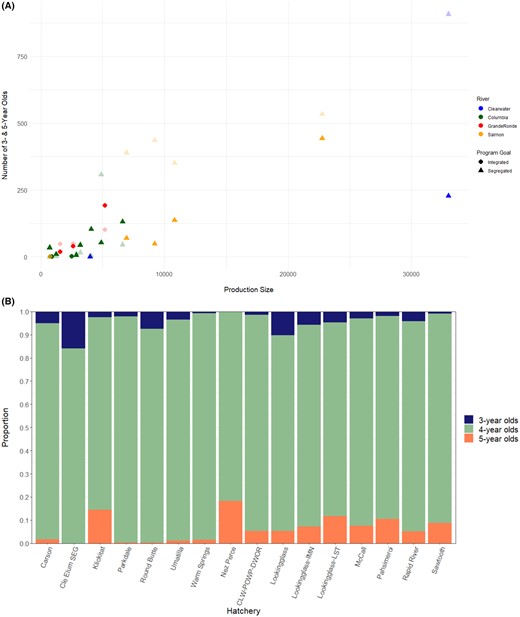
(A) Production size of each hatchery and the number of 3‐year‐old (dark shading) and 5‐year‐old (light shading) Chinook Salmon detected in a broodstock, with all brood years per hatchery program combined; and (B) proportion of each age‐class (3‐, 4‐, and 5‐year‐olds) among all brood years combined in each hatchery (Cle Elum SEG = Cle Elum Hatchery segregated program; CLW‐POWP‐DWOR = Clearwater Hatchery, Powell satellite facility, and Dworshak National Fish Hatchery). The three integrated programs (Methow Hatchery, Johnson Creek, and Cle Elum Hatchery integrated program) have been removed because only a small number of hatchery‐origin fish were identified with parentage‐based tagging and thus the proportions were not representative of the integrated broodstock as a whole. Samples from three of the Lookingglass Hatchery programs (Lookingglass Creek, Catherine Creek, and Grande Ronde River) are combined based on genetic structure analyses (labeled “Lookingglass”); the other two Lookingglass Hatchery programs are labeled separately (Lookingglass‐IMN = Imnaha River; Lookingglass‐LST = Lostine River).
Mid‐ and Upper Columbia River Hatchery Programs
Data on PBT were available from eight hatcheries in subbasins of the Columbia River basin. Data from 2012 to 2018 were available for all programs except Klickitat Hatchery, which had PBT data available from 2008 to 2018. Males whose offspring returned to Columbia River hatcheries produced 1–22 offspring (maximum was observed at Round Butte Hatchery), with an average of 2.5 offspring per male (Supplemental Table 9). Females whose offspring returned to Columbia River hatcheries produced 1–30 offspring (maximum was observed in the Umatilla program), with an average of 2.7 offspring per female. The lowest average numbers of offspring per male and female were from Cle Elum Hatchery (integrated and segregated programs) and Methow Hatchery. Males and females that produced returning offspring at the Parkdale Fish Facility had the smallest percentage of adults producing only one offspring (29.8% of males; 27.3% of females), with more than two‐thirds of the adults at the Parkdale Fish Facility producing two or more offspring that returned to the Columbia River.
The pNOB estimates ranged from 0.0% at Carson NFH to 72.0% at Methow Hatchery (Figure 2). Methow Hatchery strives for a pNOB of at least 75.0% (Chelan County PUD and WDFW 2015), and our estimate for pNOB was only slightly below this goal. There was a much larger pNOB for the Cle Elum Hatchery integrated program (96.6%) compared to the Cle Elum Hatchery segregated program (0.0%), as expected based on the objectives of these two programs (Figure 2).
There were only 39 strays from out of basin (Supplemental Table 10). The most out‐of‐basin straying was observed in the Round Butte Hatchery broodstocks from 2016 to 2018, with about 2.0% of the broodstock being made up of Clearwater River (n = 10), Grande Ronde River (n = 11), or Salmon River (n = 12) fish. The Carson NFH broodstocks had few strays: only seven and six fish were incorporated into the 2017 and 2018 broodstocks from Little White Salmon NFH, a facility that is known to share broodstock with Carson NFH (USFWS 2004). The Cle Elum Hatchery integrated program had very few broodstock that assigned via PBT (39 of 1,055) because this program aims to spawn all natural‐origin broodstock. The Cle Elum Hatchery integrated program incorporated a small number of strays from the Wells Hatchery summer‐run program, which is part of a different genetic lineage (interior ocean type) than Cle Elum spring‐run Chinook Salmon (interior stream type). Klickitat Hatchery had six stray fish in the broodstock; all six were from the Clearwater River. Methow Hatchery had a lower number of PBT assignments for all brood years and some incorporation of fish from Winthrop NFH, which is also located on the Methow River. There was substantial sharing of fish between the Parkdale Fish Facility and Round Butte Hatchery; in brood years 2013, 2014, and 2016, there were known transfers of either eggs or adults to be used in the broodstock between the two hatcheries, indicating that these were not true straying events. In the 2018 brood year at Warm Springs NFH, most of the fish were from the Parkdale Fish Facility and Round Butte Hatchery due to the spawning of Warm Springs NFH stock at the Parkdale Fish Facility in 2014.
Genetic stock identification was used to assign those fish not identified with PBT to a GSI reporting group. Fish generally assigned to the GSI reporting group that encompassed the return hatchery (from 90.0% to 99.0% of fish; Supplemental Figure 1). The GSI‐assigned fish from the Parkdale Fish Facility were the exception; 18.0% of the natural‐origin returns were outside of the expected Deschutes River spring‐run reporting group and originated from the Willamette River (7), Klickitat River (1), upper Columbia River (2), and Hells Canyon (5) reporting groups (Supplemental Figure 1).
Clearwater River Hatchery Programs
In the Clearwater River subbasin, PBT data for spring‐run Chinook Salmon during 2008–2018 were available from four hatcheries: Dworshak NFH, Clearwater Hatchery, the Powell satellite facility, and NPTH. There was a total of 36,959 individuals in the PBT baseline representing Clearwater River fish. Starting in 2013, 20,074 fish (out of 21,281 from the period 2013–2018) could be assigned with PBT. There were 5,537 females and 6,109 males that produced returning offspring (Supplemental Table 11). About one‐third of the parents produced one returning offspring (females: 30.2%; males: 32.8%); however, the number of returning offspring ranged from 1 to 34 for both females (mean = 3.5) and males (mean = 3.2).
The pNOB values in the Clearwater River hatcheries ranged from 0.0% to 9.6% (Figure 2). Sharing of broodstock was observed between the hatcheries within the Clearwater River basin. Generally, fewer than 17 strays from outside of the Clearwater River were incorporated as broodstock (Supplemental Table 12). Fish from McCall Hatchery and Rapid River Hatchery were responsible for most occurrences of non‐Clearwater River fish in the broodstock. When broodstock goals are not met in the Clearwater River hatcheries, fish are first sourced from Rapid River Hatchery and then from McCall Hatchery to backfill any shortages (B. Leth, IDFG, personal communication). Thus, assignments to these hatcheries should not be considered “true strays” because the fish did return to their natal hatchery, but adults and/or eggs were subsequently moved to the Clearwater River hatcheries for spawning, rearing, and acclimation.
Only 183 of the 379 GSI‐assigned fish were clustered into the expected reporting group: Hells Canyon. The remaining fish were either from the upper Columbia or South Fork Salmon River reporting groups (Supplemental Figure 1). Seven of the GSI‐assigned fish returning to Clearwater River hatcheries assigned to downstream Columbia River reporting groups.
Grande Ronde River Hatchery Programs
For the five hatchery programs within the Grande Ronde River subbasin, there were increased strays observed among programs. For each Lookingglass Hatchery program, the number of PBT assignments to other Lookingglass Hatchery programs was as follows: 3 (1.1%) of the 263 assignments in the Catherine Creek program, 16 (2.1%) of the 763 assignments in the Grande Ronde River program, 42 (4.4%) of the 963 assignments in the Imnaha River program, 60 (9.7%) of the 621 assignments in the Lookingglass Creek program, and 21 (4.5%) of the 466 assignments in the Lostine River program (Supplemental Table 13). These values exceed those reported here for other stream‐type Chinook Salmon hatcheries. Genetic differentiation values (Supplemental Figure 13A) were generally smaller than 0.02 among the five programs; the Lostine River program was the most distinct from the others, followed by the Imnaha River program (Supplemental Figure 13B), but with low FST values (average pairwise FST between the Lostine River program and the other Lookingglass Hatchery programs was 0.01). In general, the fish spawned at Lookingglass Hatchery genetically clustered with the samples from the Clearwater River hatcheries and Rapid River Hatchery; the exception was the Lostine River release group (Supplemental Figure 14). Because of the shared ancestral genetic history of the fish in the Grande Ronde River, the genetic structure observed here, and the level of straying among release sites, measures of heterozygosity and FIS for the Lookingglass Creek, Catherine Creek, and Grande Ronde River programs were combined. Across all brood years (2008–2018) and programs, there were 1,457 females and 1,540 males that produced returning offspring (Supplemental Table 14). Males produced 1–15 returning offspring, with 722 of the males returning one offspring. Females produced 1–20 offspring, with 660 of the females returning one offspring. On average, males and females produced two returning offspring.
Across all brood years and programs within the Grande Ronde River subbasin, there were 1,430 fish that did not assign via PBT. The average pNOB estimates (pNOB = 41.8%; Figure 2) exceeded the goal of 30.0% put forth for the Catherine Creek program. The incorporation of natural‐origin spawners in these programs is higher than that in most other spring‐run Chinook Salmon hatcheries in the Columbia River basin except for those programs that strive to include only natural‐origin fish in their broodstocks.
Stray fish from other subbasins were very limited; the only documented cases were within the Imnaha River broodstock, in which stray fish from Dworshak NFH (7), Pahsimeroi Hatchery (1), Sawtooth Hatchery (3), and Rapid River Hatchery (96) were detected as broodstock (Supplemental Table 13). In 2014 and 2015, the number of Imnaha River broodstock originating from Rapid River Hatchery was 45 of 741 fish and 37 of 790 fish, respectively.
Of the 518 fish that could not be assigned with PBT, 504 individuals assigned to the Hells Canyon GSI reporting group, as would be expected for natural‐origin fish from the Grande Ronde River. The other fish assigned to the Youngs (1), Klickitat River (1), Deschutes River (1), upper Columbia River (8), and South Fork Salmon River (3) reporting groups (Supplemental Figure 1).
Salmon River Hatchery Programs
Data were available for five hatcheries within the Salmon River subbasin from 2008 to 2018. At McCall Hatchery, 1,416 males and 1,370 females produced returning offspring (Supplemental Table 15). A single female produced 1–18 offspring (average = 3.4), with 486 females producing one offspring. A single male produced 1–22 offspring (average = 3.3), with 497 males producing one offspring. At Pahsimeroi Hatchery, 1,058 females and 1,141 males produced returning offspring (Supplemental Table 15). A single female produced 1–41 offspring (average = 3.5), with 294 females producing a single offspring. A single male at Pahsimeroi Hatchery produced 1–24 offspring (average = 3.3), with 324 males producing one offspring. At Rapid River Hatchery from 2008 to 2015, there were 3,853 females and 4,223 males that produced returning offspring (Supplemental Table 15). A single female produced 1–15 offspring (average = 2.8), with 1,228 females producing only one returning offspring. A single male produced 1–13 offspring (average = 2.6), with 1,378 males producing a single offspring. At Sawtooth Hatchery, 1,724 females and 1,882 males produced returning offspring (Supplemental Table 15). A single female at Sawtooth Hatchery produced 1–24 offspring (average = 2.9), with 582 females producing a single offspring. Each male produced 1–19 offspring (average = 2.7), with 657 males producing only one returning offspring.
The pNOB values for the Salmon River hatchery programs (excluding Johnson Creek) ranged from 0.0% to 9.4% (Figure 2). There was a low overall rate of stray inclusion in all the Salmon River hatchery programs (Supplemental Table 16). The only notable occurrence was that 361 fish from Dworshak NFH (Clearwater River) were included in the 2016 Rapid River Hatchery broodstock. Transfers of fish from the Clearwater River stock do occur when Rapid River Hatchery is short on eggs; therefore, these fish should not be considered true strays. On average (and excluding the Johnson Creek program), 15.0% of fish from the Salmon River hatcheries could not be assigned via PBT.
Over 99.0% (1,610 of 1,621) of the GSI‐assigned fish clustered into the Hells Canyon (896), South Fork Salmon River (388), or upper Salmon River (326) reporting group (Supplemental Figure 1). Most of the fish that assigned to the Hells Canyon reporting group (n = 901 from five hatcheries) returned to Rapid River Hatchery (n = 840).
The Johnson Creek program is a supplementation program that intends to only incorporate natural‐origin fish into the broodstock (Hess et al. 2012; Rabe et al. 2016; Janowitz‐Koch et al. 2019). The PBT results did indeed show that almost none of the broodstock assigned back to hatchery‐origin fish from the Johnson Creek program or otherwise. Over the six brood years in this survey, only 6 individuals out of over 700 fish in the broodstock could be assigned via PBT (Supplemental Table 15). Considering the tagging rate, the Johnson Creek program has a pNOB of 98.6%—the highest recorded pNOB for Chinook Salmon hatchery programs in this study.
DISCUSSION
The objectives of the present study were to evaluate broodstock composition at spawning hatcheries with PBT relative to the production size of various programs for spring/summer‐run Chinook Salmon in the Columbia River. It was expected that the use of mostly hatchery‐origin fish would result in an increased number of strays being unintentionally incorporated into nonnatal broodstock programs, a decrease in genetic diversity, and an increase in the number of jacks. However, results indicated that relationships between the production size of hatchery programs and broodstock composition were often not predictable and may be more complex than expected. The broodstocks in this study do not represent all of the adult fish that return from each hatchery program, as not all returning adult fish are spawned and many are harvested or experience other forms of mortality. This study does, however, detail the genetic legacy passed on by those spawned fish, which subsequently are responsible for characteristics of the next generation of hatchery stocks.
Most of the stream‐type Chinook Salmon hatcheries in this study operate as segregated programs, which was apparent in the pNOB estimates, with most hatcheries having a pNOB less than 12.5%. The largest pNOB values, as expected, belonged to those hatcheries that are managed as integrated programs: Methow Hatchery, the Cle Elum Hatchery integrated program, and the Johnson Creek program. This is also reflected in the low number of returning fish incorporated as broodstock, as most fish for these programs are not collected for broodstock and are allowed to spawn naturally. The high pNOB may reduce domestication selection and reduce fitness impacts to wild fish, as has been shown in recent studies (Hess et al. 2012; Ford et al. 2016; Janowitz‐Koch et al. 2019) and as suggested by models for integrated hatcheries (e.g., Baskett and Waples 2013). However, in this study, there was no direct correlation between larger pNOB values and heterozygosity. The NPTH program also had a small number of returning adults. With the loss of spring Chinook Salmon in the Clearwater River after the construction of Lewiston Dam in the 1920s (IDFG 2011a), efforts have focused on the reintroduction and establishment of a Clearwater River stock through segregated hatchery programs. The hatcheries within the Clearwater River share broodstock to meet production goals, which is evident in the PBT assignments; however, we were only able to assign 12 fish back to parents that were spawned at NPTH. There could be several reasons for this, including but not limited to the life stage at release (parr versus pre‐smolt versus smolt), a low proportion of juvenile out‐migrants from acclimation sites, a larger proportion of NPTH fish being harvested before arrival to the hatchery, or NPTH fish spawning naturally in the Clearwater River and not being taken for broodstock.
Expectation 1: Straying
Stray fish in the context of this study were identified as individuals that returned to a nonnatal hatchery and were unintentionally incorporated as broodstock, with the caveat that more stray fish may have been present at a nonnatal hatchery but were discarded before spawning if they were detected via a CWT or PIT tag. This would lead to the absence of stray occurrence since the PBT baseline is composed of only spawned fish. The PBT baseline also allowed for the detection of “false” strays—those fish that returned to their natal hatchery and were spawned but whose eggs were intentionally moved to a different hatchery to help meet broodstock production goals. Conversations with hatchery managers helped to confirm these known transfers of broodstock.
Strays between hatcheries have rarely been quantified but may contribute to increased gene flow and overall genetic similarity among stocks in the Columbia River basin (e.g., Myers et al. 1998; Narum et al. 2010). Overall, stray rates among hatcheries were low, with only 0.6% of the PBT‐assigned fish assigning to a nonnatal hatchery and spawned as broodstock. There was no correlation between the size of the hatchery production or the pNOB and the number of strays. This may be due to the use of traditional tagging or marking methods to identify and discard stray fish before spawning. To obtain a more accurate estimate of straying among hatcheries, it would be necessary to keep records on the number of stray fish detected at each hatchery that were excluded prior to spawning based on other information.
To detect straying of natural‐origin fish into hatchery broodstocks, the GSI reporting group assigned to natural‐origin fish was assessed for congruence with expected GSI assignments for native fish in the vicinity of the hatchery. About 1.0% of the natural‐origin fish incorporated into the broodstocks were identified as being from a nonnative GSI reporting group. There were GSI assignments of Snake River fish to the upper Columbia River reporting group; however, misassignment rates with GSI are known to be higher between these groups of fish due to shared genetic ancestral origins (Hess et al. 2021), making the accuracy of these assignments uncertain. In other studies, estimates of the mean stray rate for stream‐type Chinook Salmon were generally less than 5.0% (Keefer and Caudill 2014), but here we focused only on strays between hatcheries that were incorporated as broodstock, and we were not able to estimate strays that returned to natural spawning grounds. A variety of factors can contribute to straying, including population, sex, run size, and age (Hard and Heard 1999). We detected slightly more stray females (54.1%) compared to stray males (45.9%) that were incorporated into broodstock. In nonhatchery Chinook Salmon, males can be up to 12 times more likely to stray than females (Hamann and Kennedy 2012; Keefer and Caudill 2014). The difference in the sex ratio of strays between this study of hatchery fish and stray observations from native fish may be due to hatchery‐specific practices for strays and may not be a true reflection of the sex ratio of straying fish since some are excluded from broodstock based on physical tags or marks.
Expectation 2: Genetic Diversity
Our next objective was to estimate the genetic diversity within hatchery programs in relation to different breeding regimes and production size. It was expected that integrated programs and segregated programs with larger production sizes would exhibit an increase in the amount of genetic diversity; however, that expectation was not always met. There was also not a linear relationship between Nb and heterozygosity, indicating that high diversity may not directly translate to a high effective population size. Differences in heterozygosity were surprisingly small between hatchery programs across regions, with a narrow range of both HO and HE values across all programs. The highest diversity was likely due to admixture among lineages, as observed for Klickitat Hatchery, where the program has documented introgression from ocean‐type lineage fish (Hess et al. 2014) but still only had slightly higher heterozygosity (~0.05) than the least diverse programs. Although not significant, there was a consistent signal for slight heterozygote deficiency in most hatchery programs, which may reflect the incorporation of strays that are genetically distinct into the broodstock. This study suggests that ocean‐type introgression also may have occurred at low levels for the Cle Elum Hatchery program (~5.0% ocean type; Narum et al. 2010), and a few documented summer‐run strays from Wells Hatchery were incorporated into the Cle Elum Hatchery integrated broodstock. Finally, the Tucannon River program had multiple instances of negative FIS (heterozygote excess) that may indicate relatedness in this population during a few years, but this was not evident in the other 4 years examined for the program.
As observed in past studies, Chinook Salmon from many of the hatchery programs were genetically similar to one another, especially those programs that were within the same geographic region (e.g., Narum et al. 2010; Hecht et al. 2015). This reflects known transfers among broodstock programs, such as fish from the Clearwater River hatcheries that clustered genetically with fish from both Carson NFH and Rapid River Hatchery—programs that contributed fish during the reintroduction of salmon in the Clearwater River. Genetic structure may also be influenced by incorporation of strays from other hatchery programs, such as hatchery stocks nearest the lower Columbia River (Parkdale Fish Facility, Round Butte Hatchery, and Warm Springs NFH) that were distinct from other interior stocks and may reflect gene flow from spring‐run fish in the lower Columbia River lineage, as these were documented in broodstock. Historical stock transfers have also influenced the genetic variation of Chinook Salmon throughout the Columbia River (Myers et al. 1998).
Despite the greatest incorporation of natural‐origin individuals in integrated programs, there was not a notable increase in genetic diversity for the three integrated hatchery programs compared to other programs in close geographic proximity. Furthermore, there was not a large difference in diversity between fish reared in the PBT hatchery programs surveyed in this study and estimates from previous studies focusing on natural‐origin populations with similar marker panels (Hess et al. 2016a). This could be due to consistent genetic diversity levels across natural‐ and hatchery‐origin fish. Another reason could be that most hatcheries experience high gene flow, regardless of whether the programs are segregated or integrated, through interbreeding with natural‐origin fish on spawning grounds (Hinrichsen et al. 2016) or through broodstock transfers from other hatchery programs.
In the past, salmonid hatcheries were largely focused on production goals directly related to harvest. However, the Hatchery Scientific Review Group (established in 1999) aimed to shift the focus to the conservation and propagation of natural populations in addition to sustaining harvest goals (Paquet et al. 2011). Integrated hatchery programs attempt to maintain a locally adapted hatchery‐reared population, with an emphasis on conservation, by incorporating natural‐origin fish into the broodstock. In contrast, segregated hatchery programs incorporate only hatchery‐reared fish into the broodstock, with an emphasis on harvest goals. Both types of programs have a role in the management and propagation of hatchery and natural populations of salmonids in the Pacific Northwest. For example, in the Clearwater River subbasin, populations of spring‐run Chinook Salmon were extirpated in the late 1920s after the construction of Lewiston Dam (IDFG 2011a). In this river, hatcheries operate as segregated programs since there is no locally adapted population. Elsewhere, two integrated programs—Johnson Creek and Cle Elum Hatchery—aim for 100% natural‐origin broodstock per year. In general, PBT data can be used to confirm that this is occurring for some years (2 of 6 years for the Johnson Creek program; 0 of 3 years for the Cle Elum Hatchery integrated program) and include unmarked hatchery‐origin fish. In the Grande Ronde River subbasin, a mixture of integrated and segregated management is employed, with approximately 30% natural‐origin fish included in the broodstock (NPT 2011; ODFW 2011a, 2011b, 2011c). Compared to a fully segregated program, the fish spawned at Lookingglass Hatchery in the Grande Ronde River subbasin have higher genetic diversity, likely due to this increase of natural‐origin fish. One goal of integrated hatchery programs is to reduce the inbreeding depression that is often observed in hatchery settings (Paquet et al. 2011). The present study demonstrated a positive correlation between the number of natural‐origin fish and the number of nonrelated individuals, suggesting that integrated hatchery programs can be implemented to reduce inbreeding depression.
Expectation 3: Assessment of Offspring Produced by Parents
The third objective of the study was to compare the scale of various hatchery programs based on the number of broodstock spawned and the contributions of returning adults to subsequent broodstock. This is only a rough proxy for the overall fitness in a specific geographic region since the record of returning fish is skewed by hatchery practices, fish harvest, hatchery fish escapement to the spawning ground, and the method of PBT data collection (i.e., only collecting spawned fish). Because of this, fitness in our study is only related to the broodstock and cannot be used to represent the actual fitness of hatchery fish within a river or subbasin. Overall, the scale of hatchery production varied widely, with integrated programs generally representing a much smaller proportion of the number of adults contributed each year to the broodstock compared to segregated hatcheries. Larger production size was positively correlated with a higher number of returning offspring and higher Nb values, which may indicate that increasing hatchery production will return more offspring—a point that is not novel but was estimated in this study. The integrated programs did not follow this pattern, as returning offspring were allowed to spawn naturally; therefore, no record of these returns exists within the PBT data. However, evaluation of the fitness in these integrated programs has been quantified in previous studies through routine genetic sampling and PBT analysis of fish that are passed upstream to spawn naturally (Williamson et al. 2010; Hess et al. 2012; Janowitz‐Koch et al. 2019).
Most parents produced no returning adult offspring that were detected as subsequent broodstock, but many adult offspring were not detected in these analyses since many hatchery‐origin stocks were subject to harvest in various fisheries or other factors that led to mortality. The negative binomial distribution of fitness in this study is commonly observed in studies of salmonid reproductive success (reviewed by Christie et al. 2014; Koch and Narum 2021). Of those hatchery fish that produced offspring returning in subsequent years, most (14.1% of females; 16.2% of males) produced few adults returning to the hatchery (1–3 offspring). There were examples of extremely high fitness: a few females (0.5%) produced between 10 and 41 offspring that were used as broodstock, and 0.4% of males produced between 10 and 34 offspring that were used as broodstock. This could indicate that the contribution of most family sizes was similar in hatcheries, but occasionally high variation occurs that could influence diversity and effective size (Hedrick 1995). This may also contribute to domestication selection, where specific families become adapted to rearing in artificial conditions (e.g., Christie et al. 2014). The Nb:Nc ratio within hatchery programs averaged 0.44, which is higher than that observed in other studies of hatchery‐reared Chinook Salmon (Nb:Nc = 0.15; Van Doornik et al. 2011). The higher Nb:Nc ratio in the current study may be due to including only those fish incorporated as broodstock to estimate Nc.
Expectation 4: Age Composition of Broodstock
The last expectation was that larger production hatchery programs and segregated programs would produce more 3‐year‐old fish, also known as jacks. The predominant age‐class for hatchery programs was 4‐year‐old fish (average = 90.6%), but high variability existed; three programs had more than 20.0% of the broodstock composed of jacks, and two of the three were integrated programs. Variable and overlapping age‐classes are thought to buffer against negative environmental factors (i.e., the portfolio effect; Schindler et al. 2010) and may provide benefits to hatchery programs in addition to natural populations. The exclusion of age‐classes from the broodstock can cause the creation of genetically distinct broodlines and phenotypic divergence across years (Smith et al. 2015; Larsen et al. 2019). It may be challenging, however, for hatcheries to target production of specific portions of age‐classes since age at maturity in Chinook Salmon has been shown to be influenced by both genetic and environmental factors that contribute to this complex trait (e.g., Hankin et al. 1993; Heath et al. 1994; Larsen et al. 2006). One caveat to note is that the rate of jacks returning to hatcheries may be higher than reported here, as hatchery practices often intentionally exclude jacks with small body size from the broodstocks. Generally, surveyed hatcheries aim to use 5.0–10.0% of jack males in the broodstock but can receive a greater percentage of jacks, as reported in the hatchery genetic management plans (from 0.8% to 96.0% jacks; ODFW 2002; USFWS 2010; IDFG 2011a).
Conclusions
Whether hatcheries are intended to operate as integrated or segregated programs, monitoring systems are in place to inform future directions and strategies for salmon hatchery practices. Monitoring strategies often include the use of CWTs and PIT tags, but the current study demonstrates that PBT provides a complementary method to these approaches in the Columbia River basin. Many Chinook Salmon and steelhead hatcheries are already collecting PBT samples from broodstock throughout the Columbia River (see Steele et al. 2019 for a list). Additionally, multiple programs have been utilizing genetic pedigree methods to monitor the fitness and demographic effects of supplementation programs for spring/summer‐run Chinook Salmon, wherein hatchery‐reared individuals are allowed to spawn naturally (e.g., Williamson et al. 2010; Janowitz‐Koch et al. 2019). Those genetic pedigrees are more complete for all spawners and have been used to estimate relative reproductive success across years while linking these data to various phenotypic traits, such as time of arrival to the spawning grounds or body size (Janowitz‐Koch et al. 2019). Several Snake River Chinook Salmon hatchery programs (Sawtooth, Pahsimeroi, and McCall hatcheries) implement monitoring for the proportion of natural influence (PNI) in supplemented populations and the survival rates of natural‐origin fish compared to hatchery‐origin fish (Venditti et al. 2019). For evaluations of the hatchery influence on natural populations, PNI is often considered (Mobrand et al. 2005), which requires knowledge of the pNOB for hatcheries. These estimates of pNOB can be combined with PBT detections in spawning ground surveys to precisely estimate the proportion of hatchery‐origin spawners (Hinrichsen et al. 2016) in order to provide information on PNI.
Unlike other tagging techniques, data collected to implement PBT (e.g., genetic samples and genotypes from broodstock) have applications beyond the recovery and identification of tagged fish. As demonstrated here, genotypes allow for detailed genetic monitoring and evaluation of hatchery populations with no additional data collection. Genotypes from broodstock can also be used to infer relationships apart from the parent–offspring relationships used in PBT. One particularly informative relationship for fisheries management is that of grandparent–grandchild (Letcher and King 2001; Christie et al. 2011; Sard et al. 2016). Grandparent assignment with only two grandparents (e.g., two individuals in the hatchery broodstock) would allow managers to positively identify the offspring of unsampled hatchery strays and natural fish (Delomas and Campbell 2022). One major hurdle in implementing this analysis is the time span between the collection of candidate grandparents and the collection of grandchildren. For Chinook Salmon adults returning in a given year, the oldest candidate grandparents needed (assuming adults return at 3–5 years of age) spawned 10 years prior. This time span is now within reach for Snake River hatchery Chinook Salmon, as collections began in 2008. Collecting samples as part of a PBT program will make these analyses immediately possible once large‐scale grandparent assignment becomes feasible via genotyping techniques and statistical advances.
In this study, we have demonstrated the utility of multigenerational PBT data to gather production metrics for hatchery‐reared, interior stream‐type Chinook Salmon. The direct application of the PBT baseline has generally been to make assignments of unknown adult fish as they return upstream to quantify the contributions of specific hatchery stocks to the run at large. However, the accumulation of multiple years of PBT data has allowed for a more in‐depth analysis of the return rate of hatchery‐reared juveniles that are then incorporated into the broodstock in subsequent years, the age‐class composition of hatchery broodstock for each brood year, the rate of straying among hatcheries, and a variety of genetic diversity and differentiation measures. These genetic‐based metrics are intended to provide hatchery managers with further information that can assist with operational decisions and broodstock management. To date, specific hatchery managers have utilized PBT data to identify the pNOB value for a brood year, keep a record of all age‐classes and nonnatal fish present in a broodstock, and determine the reproductive success of hatchery‐ and natural‐origin fish (in the case of Johnson Creek, see Janowitz‐Koch et al. 2019). In many cases, these multigeneration pedigrees provide information that is more complete than information derived from other methods (due to the high tagging rates with PBT) or that is only possible through DNA parentage analyses.
ACKNOWLEDGMENTS
Tissues were collected from broodstock by staff at tribal, state, and federal hatcheries throughout the Columbia River basin. Sampling materials were coordinated by Megan Moore and sent to hatchery staff for tissues to be collected at various facilities. Several laboratory technicians from CRITFC, Pacific States Marine Fisheries Commission, and IDFG generated genotypes for tissue samples over multiple years. Funding for this study was provided by the Bonneville Power Administration through grants to CRITFC (2008‐907‐00) and to IDFG (2010‐031‐00). There is no conflict of interest declared in this article.
