


Abstract
Increasingly, management efforts are being directed at Blue Catfish Ictalurus furcatus native and invasive populations; however, a lack of standardized sampling procedures using low‐frequency electrofishing (LFE) has hampered the ability to collect comparable data across temporal and spatial scales. Therefore, we conducted wetlab LFE trials to determine optimal power densities that elicit a capture‐prone surfacing response by Blue Catfish. We tested power density applied to the fish (Dm) from 4.69 × 10⁻⁶ to 3.65 μW/cm3 and trials with at least one surfacing fish occurred between Dm values of 2.144 × 10⁻⁵ and 0.854 μW/cm3. Trials in which ≥50% of fish surfaced all occurred at Dm values between 9.29 × 10⁻⁵ and 0.2084 μW/cm3. Even within this narrower range, responses were variable and included trials where no fish surfaced, indicating a wide range of response rates across all power levels tested. Our results suggest that a power density applied to the fish (Dm) between 9.29 × 10⁻⁵ and 0.2084 μW/cm3 is most likely to elicit a surfacing response in Blue Catfish, thus exposing them for capture. Further research is needed to map power densities over a range of distances from the electrode (i.e., relating power at the electrode [Pa] with power density in the water [Da]) before standard power tables can be produced. Until this information becomes available, we recommend using the power tables from Bonar et al. (2009) because these allow effective capture of catfishes and will standardize the effectiveness until a better power table could be produced for LFE. Additional research is needed to better understand the Blue Catfish's unique electroreceptive mechanism that drives variability in the response to LFE and whether the proportion of fish surfacing is consistent enough to use catch per unit effort as an index of abundance.
Blue Catfish Ictalurus furcatus are a large, popular sport fish natively inhabiting North American river drainages of the Gulf of Mexico, with introductions expanding their ranges throughout the United States from California to the Atlantic coast states (Graham 1999). Blue Catfish are one of three ictalurid species in North America that reach a large size potential and are therefore of particular interest for trophy‐sized angling (>1,140 mm total length [TL]; Gabelhouse 1984; Arterburn et al. 2002). Where introduced, Blue Catfish can negatively alter fish communities due to their high abundances (Fabrizio et al. 2018, 2021), opportunistic generalist feeding behavior (Schmitt et al. 2017, 2019), fast growth (Hilling et al. 2021), and competition for resources (Schloesser et al. 2011). Interest in management of Blue Catfish populations is increasing; therefore, developing accurate and precise standardized sampling methods for assessing Blue Catfish populations is a priority for fishery managers (Michaletz and Dillard 1999; Porath et al. 2021). Consequently, the past two decades of research examining gears that sample Blue Catfish populations has increased.
Low‐frequency electrofishing (LFE; <30 Hz, commonly 15 Hz) is used for scientific sampling (Brown 2007), commercial harvesting (Trice 2017), and recreational angling (Fisk et al. 2019) of Blue Catfish because it is highly efficient (i.e., catch/gear effort, Bodine et al. 2013) and produces accurate size‐structure data (Buckmeier and Schlechte 2009; Bodine and Shoup 2010); however, LFE power output goals have not been standardized. Low‐frequency electrofishing results in an atypical response (relative to fish responses to the more widely used 60‐Hz electrofishing) in some ictalurid catfishes, including Blue Catfish, whereby fish surface slowly (up to 90 s after first exposed to LFE) up to 100 m away from the electrofishing boat, making them challenging to collect (Cailteux and Strickland 2009; Bodine et al. 2013). This behavioral difference between LFE and 60‐Hz electrofishing suggests that conventional high‐frequency (i.e., 60 Hz) electrofishing standards (Bonar et al. 2009) may not be applicable to LFE sampling for Blue Catfish. The mechanism underlying this unusual response for Blue Catfish is not known, but it is most likely related to electroreception. Unlike most teleost fish, ictalurid Catfish have electroreceptive organs known as ampullae of Lorenzini and are remarkably sensitive to local, low‐density electrical stimulation (Dijkgraaf 1968; Kalmijn 1974; Pettigrew and Wilkens 2003; Crampton 2019), especially at lower frequencies between 0.3 and 25 Hz (Peters and Buwalda 1972). Responses in catfish can vary depending on the density of an electric field, with very weak fields eliciting an attraction and feeding response but slightly stronger electric fields causing catfish to swim away from the electrical source (Parker and Van Heusen 1917). Because LFE is widely used but poorly understood, there is a need to evaluate LFE effects on Blue Catfish to determine the power densities required to elicit capture‐prone responses for this species so that standardized sampling protocols for this species can be developed.
Developing a standardized sampling protocol is important because it generates data that can be directly compared temporally and spatially (Bonar and Hubert 2002). Standardization requires assessing a gear's performance across a set of potential sampling conditions (e.g., time of day, water temperature, month) to determine the conditions that produce the most accurate sample, or a consistently biased sample that can still precisely index relative population changes. This information is then used to create a protocol that specifies the set of conditions that will allow comparable data to be collected. An important factor that must be accounted for when standardizing high‐frequency electrofishing is the power density applied to the fish (Dolan and Miranda 2003; Bonar et al. 2009). The power density generated by an electrofisher determines the volume of water around the electrodes in which fish are immobilized. Therefore, standardizing electrofishing power output is important because it makes catch per unit effort (CPUE) more consistent (i.e., immobilizes fish from a standardized volume of water). Further, when agencies use the same power standardization (including adjusting for water conductivity to maintain the effective sampling area), changes in CPUE are more likely to reflect population changes than changes in the effectiveness of the gear (Burkhardt and Gutreuter 1995; Bayley and Austen 2002). To develop an appropriate LFE power standardization goal and standardized sampling protocol, the power threshold needed to effectively immobilize Blue Catfish must first be determined. Therefore, the goal of this study was to evaluate how the power density applied to Blue Catfish affects the probability of fish exhibiting a “surfacing response” (fish swimming on the surface of the water for ≥2 s such that they can be dipnetted), subsurface immobilization, and limited/no response.
METHODS
Groups of Blue Catfish (group size was 8–13 fish per trial, n = 549 fish total in experiment) were collected from four reservoirs located in central Oklahoma (Lake Arcadia [Oklahoma County], Meeker Reservoir [Lincoln County], Lake Thunderbird [Cleveland County], and Wiley Post Reservoir [Garvin County]) using LFE (n = 459 fish) and gill nets (n = 90 fish) and transported to the Oklahoma Department of Wildlife Conservation Fisheries Research Laboratory from June 2021 to August 2022. Fish size distribution was reflective of the size distribution the sampling gear collected (i.e., fish were collected in the order they were sampled in the field) except that fish <195 mm TL were not used, as small fish often are underrepresented in LFE samples (D. E. Shoup, unpublished data). Fish were placed in a 363‐cm‐long × 94‐cm‐wide × 92‐cm‐high fiberglass test tank (2,627 L) filled to a depth of 77 cm with well water. Two metal plates (94‐ × 77‐cm, 0.32‐cm thick aluminum sheets) were placed at opposite ends of the tank and served as the cathode and anode (363 cm apart) to create a uniform power density across the entire tank when the plates were energized. The metal plates were connected to a Smith Root APEX electrofishing control box operating at 15‐Hz pulsed DC current and 25% duty cycle, which according to Justus (1994) produces optimal settings for attracting Blue Catfish to the surface for collection. Fish were held in the test tank for ≥48 h before undergoing an experimental trial. To increase resistance and allow lower voltage gradients to be tested, the anode wire of the APEX electrofishing unit was placed at one end of a 5‐gal bucket (32 cm diameter) filled with various volumes of low‐conductivity water (i.e., a blend of deionized and well water to produce the desired resistance). On the opposite side of the bucket, an AWG 10 wire with 0.38 cm of insulation removed was attached to the bucket and the other end of this wire was attached to the anode plate in the experimental test tank. Thus, the 5‐gal bucket served as an adjustable resistor that allowed us to produce voltage gradients as low as 3 × 10⁻⁶ V/cm2 in the experimental test tank when using the 1 V output setting on the APEX electrofisher.
Each group of Blue Catfish was tested in one 5‐min trial with an assigned voltage gradient. Voltage was varied between trials to determine the range of power densities applied to the fish that elicit the surfacing response characteristically observed when sampling with LFE. Fish responses were categorized as surfacing (i.e., swimming or immobilized [loss of all motor function] at the surface for at least 3 s such that it could be dipnetted), subsurface immobilization (i.e., immobilized but below the water surface), or limited/no response (all other changes to fish movement, such as muscle twitching, fast/slow swimming, barbel movements, or no detectible change to fish behavior when electricity was applied), similar to Morris (2018). Fish that surfaced were removed by dip net and placed into a round fiberglass tank (183 cm diameter). Each fish (both those that surfaced and those that did not) was measured (TL, mm), and water conductivity and water temperature were recorded at the end of the trial. Water temperatures during the experiment were 23.7–29.9°C, and water conductivities varied from 550 to 710 μS/cm.
At the conclusion of each trial, the test tank and plates were sanitized using a 1.0% bleach solution and the calcium buildup from the well water was cleaned using muriatic acid on all test tank equipment (including metal plates). The tank was then rinsed, refilled, and calibrated to establish the voltage gradient that was to be applied in the next trial (i.e., different voltage outputs on the APEX electrofisher and/or volumes of water or conductivity of water in the bucket were tried until the desired voltage gradient was achieved). Once the tank was calibrated, a new group of catfish was transferred into it and allowed to acclimate for a minimum of 48 h prior to starting the next trial.
Electrical Measurements
Power treatments were applied based on the APEX electrofishing unit's available voltage settings (i.e., 1–1,200 V in 1 V increments, but we only tested 1–300 V given that the responses of fish indicated no need for higher power levels) in combination with the 5‐gal bucket that served as a variable resistor described above. Initially, voltage levels producing power densities <1 μW/cm3 were selected based on results from Montague (2021) suggesting that Flathead Catfish Pylodictis olivaris respond best to electrofishing at power densities <2.2 μW/cm3. Voltages were haphazardly chosen for each trial to initially cover the range of values from 0 to 1 μW/cm3 and were later chosen to better refine the lower and upper edge of the effective range we began observing. We also added a few higher‐power trials to confirm that the results of Montague (2021) for Flathead Catfish were applicable to Blue Catfish (i.e., that higher voltages did not result in more surfacing fish). The peak voltage gradient (ε, V/cm) in the test tank was calculated as
where V is the peak voltage across the metal plates (measured during trials using an Eone ET310A oscilloscope), and cm is the distance between metal plates in cm (363 cm in all trials). The power density applied to the water between the metal plates (Da, μW/cm3) was calculated as
where Cw is the ambient water conductivity (μS/cm) on the day of the trial (measured with a YSI (model Pro 2030, Yellow Springs Instruments, Yellow Springs, Ohio) conductivity meter). Finally, power applied to the fish (Dm, μW/cm3) was calculated as
where Cf is the ambient conductivity of the fish (assumed to be 100 μS/cm), and Da and Cw are as defined above. We chose to use 100 μS/cm as the conductivity of fish because it was in the middle of several values reported in the literature (ranging from 75 to 175; Miranda and Dolan 2003; Morris 2018) and because Miranda and Dolan (2003) demonstrated that this parameter had minimal effect on Dm values.
Analysis
To determine if the gear used to collect fish may have influenced electrofishing response, we compared the proportion of fish that surfaced after being collected by gill net (9 trials) or LFE (22 trials). Only LFE trials within the Dm range of gill‐net‐collected fish were used for this comparison (4.69 × 10⁻⁶ to 5.84 × 10⁻² μW/cm3). The proportion of fish surfacing in these trials was compared between gears using Dm as a covariate via an analysis of covariance (ANCOVA) (α = 0.05). To determine if the TL of individual Blue Catfish may have influenced surfacing, we compared length‐frequency distributions between surfacing and nonsurfacing Blue Catfish (regardless of the gear used to collect fish from the field) via a two‐sample Kolmogorov–Smirnov test (α = 0.05, Kolmogorov 1933; Smirnov 1939), with significance determined via 1,000 Monte Carlo iterations using the ks.boot function of the Matching package (Sekhon 2011) in program R (R Core Team 2022).
Generalized linear models (McCullagh and Nelder 1989) were used to determine the relationship between power applied to the fish (Dm; independent variable) and either the proportion of fish surfacing or subsurface immobilization (dependent variables). Because the dependent variables represented the number of successes (i.e., either the number of fish surfacing or subsurface immobilizations) out of the number of observed replicates, models were constructed with a binomial distribution and a probit link using the generalized linear model (glm) function in program R (R Core Team 2022). Scatterplots of the proportion of fish surfacing or subsurface immobilization as a function of Dm suggested that a nonlinear relationship may exist between the variables. Therefore, we used an exploratory information theoretic approach (Burnham and Anderson 2002) with a series of polynomial models to determine the relationship between Dm and the proportion of fish surfacing or subsurface immobilization. A polynomial approach was selected as it allows generalized linear models to estimate nonlinear relationships (James et al. 2013). Our candidate model set consisted of an intercept‐only model (null model), a linear model, and second‐ to eighth‐order polynomial models (Table 1). The decision to include fifth‐order and greater polynomials was made to help confirm the results of our information theoretic approach. The selection of one of these high‐order polynomials via our ranking procedure would suggest that statistical overfitting occurred, and a nonlinear trend was not likely for our data. Candidate models were ranked based on their predictive potential using Akaike information criterion corrected for small sample size (AICc; Hurvich and Tsai 1989). Models within 2.0 ΔAICc of the top candidate model were considered to have similar likelihoods (Burnham and Anderson 2002). AICc weights (wi) were estimated for each candidate model and then used to estimate evidence ratios (Royall 1997; Burnham and Anderson 2002) for each model relative to the top‐ranked model (based on lowest AICc). McFadden's pseudo R2 (ρ2; McFadden 1974) estimates were obtained for all candidate models to approximate how well each model fit the data, with ρ2 = 0.20–0.40 suggesting excellent model fit (McFadden 1974).
Candidate models used to determine the relationship between the proportion of fish surfacing as a function of power applied to the fish (Dm [μW/cm3]). Included are the degrees of freedom (df) for each linear model, Akaike information criterion corrected for small sample size (AICc), relative difference in AICc to the top‐ranked model (ΔAICc), and likelihood relative to the other models within the candidate set (wi). Evidence ratios (ER) and McFadden's pseudo R2 (ρ2; McFadden 1974) are also included. Inestimable values are represented by (—).
| Model | df | AICc | ΔAICc | wi | ER | ρ2 |
| Fourth‐order polynomial | 5 | 267.2 | 0.0 | 0.56 | 1.00 | 0.35 |
| Fifth‐order polynomial | 6 | 269.7 | 2.6 | 0.16 | 3.62 | 0.35 |
| Second‐order polynomial | 3 | 270.0 | 2.8 | 0.14 | 4.06 | 0.33 |
| Third‐order polynomial | 4 | 271.1 | 3.9 | 0.08 | 7.19 | 0.33 |
| Sixth‐order polynomial | 7 | 272.0 | 4.8 | 0.05 | 11.04 | 0.36 |
| Seventh‐order polynomial | 8 | 274.9 | 7.8 | 0.01 | 48.53 | 0.36 |
| Eighth‐order polynomial | 9 | 278.0 | 10.9 | <0.01 | 225.16 | 0.36 |
| Linear | 2 | 288.6 | 21.5 | <0.01 | — | 0.25 |
| Intercept only | 1 | 356.3 | 89.1 | <0.01 | — | — |
RESULTS
There was no evidence that the proportion of surfacing fish varied based on the gear we used to collect the fish (df = 1, 28, P = 0.15; Figure 1). Our two‐sample Kolmogorov–Smirnov test suggested that there was also no relationship between length‐frequency distributions of nonsurfacing and surfacing Blue Catfish (D = 0.13, P > 0.05, Figure 2). Therefore, all fish were analyzed without respect to TL or the gear used to collect them. Of the 549 fish (195–802 TL mm, range) tested throughout the experiment, 154 fish (28.1%) exhibited surfacing behavior, with 30 of the 49 trials containing at least one surfacing fish (Figure 3). There appeared to be both a lower and upper threshold for Dm values that produced surfacing responses. These thresholds were most easily observed with Dm on a log10 scale, given the right‐skewed nature of the relationship (i.e., lower threshold was considerably more abrupt than the upper threshold; Figure 3). No fish surfaced in the six trials with Dm <2.14 × 10⁻⁵ μW/cm3 or the six trials with Dm >0.854 μW/cm3 (trials were conducted with Dm values that ranged from 4.69 × 10⁻⁶ to 3.65 μW/cm3). Trials in which ≥50% of fish surfaced (15 of the 49 trials) occurred at Dm values between 9.29 × 10⁻⁵ to 0.2084 μW/cm3, but even within this range there were trials in which no or very few fish surfaced (Figure 3). Only in 1 of the 49 trials did we observe all fish in a group surfacing.

Percent of Blue Catfish surfacing from each lab trial for fish collected via gill netting (white circles) or low frequency electrofishing (gray circles) based on the power applied to the fish (Dm) in each trial. Lines and shaded bands denote means and 95% confidence intervals of predictions from ANCOVA comparing fish collected by gill netting (gray line, light gray band) or low frequency electrofishing (black line, dark gray band). Observed percentages of Blue Catfish surfacing from each trial have been staggered slightly for visibility.
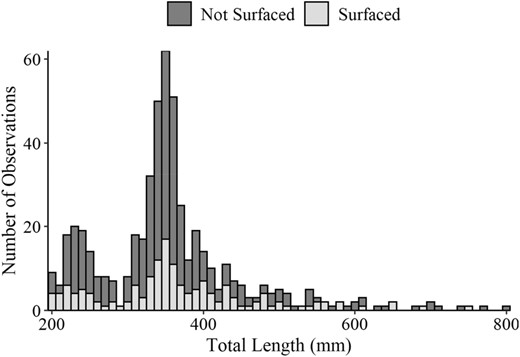
Length‐frequency histogram (10‐mm length bins) of Blue Catfish total lengths for fish that surfaced or did not surface during low‐frequency electrofishing trials.
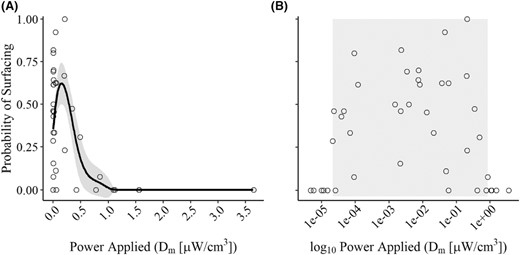
Proportion of Blue Catfish surfacing based on power applied to the fish (Dm) during low‐frequency (15 Hz) pulsed DC electrofishing trials. (A) The solid line represents the mean predicted proportion of fish surfacing across the range of Dm values tested during the study, and the gray shading represents a 95% confidence interval. (B) The gray shaded portion of the plot represents the range of Dm values on a logarithmic scale where a surfacing response was observed.
The proportion of fish surfacing at different Dm values was best described by a fourth‐order polynomial (based on AICc; Table 1), which produced a right‐skewed unimodal response (Figure 3A). No other models were within 2.0 ΔAICc of the fourth‐order polynomial. The fourth‐order polynomial also had the majority of the wi within the candidate set, suggesting that it was the most probable of our models. Evidence ratios suggested that the fourth‐order polynomial was ~3–4 times more likely than the next two best‐ranked models (fifth‐ and second‐order polynomials). Although ρ2 for the fourth‐order polynomial suggested an excellent model fit, the polynomial equation did not precisely predict the number of fish surfacing within the Dm range where the surfacing response was observed. Instead, the probability of fish surfacing appeared to be relatively similar (but variable) for all Dm values between a lower and upper threshold (Figure 3).
Twenty‐eight fish (5%) exhibited subsurface immobilization (occurring in 13 out of 49 trials; Figure 4). The Dm thresholds between which this behavior was observed were also most easily observed with Dm on a log10 scale, given the right‐skewed nature of the relationship (Figure 4). Trials with subsurface immobilization occurred at Dm values ranging from 1.49 × 10⁻⁵ to 0.854 μW/cm3. Within this range of Dm values, 0–67% of the fish in the tank exhibited this response on a given trial.
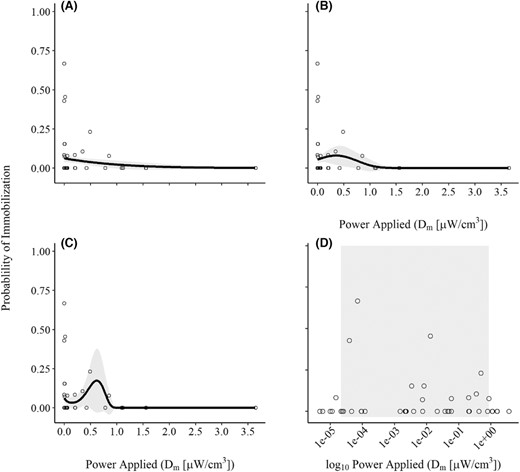
(A, B, C, D) Proportion of Blue Catfish exhibiting subsurface immobilization based on power applied to the fish (Dm) during low‐frequency (15 Hz) pulsed DC electrofishing trials. The solid line represents the mean predicted proportion of fish surfacing across the range of Dm values tested during the study, and the gray shading represents a 95% confidence interval (panels A, B, and C representing the three top models: linear, second‐order polynomial, and third‐order polynomial, respectively). In panel D, the gray shaded portion of the plot represents the range of Dm values on a logarithmic scale where subsurface immobilization was observed. Note: the curvature in panel A (linear model) is because the relationship is estimated via a probit‐link function.
The proportion of fish that exhibited subsurface immobilization at different values of Dm was best described by a third‐order polynomial trend (based on AICc; Table 2), again indicating a right‐skewed unimodal response (Figure 4). However, ΔAICc values suggested that the second‐order polynomial and linear models had equal likelihoods relative to the top‐ranked model. Estimates of wi and derived evidence ratios within the candidate set suggesting that the third‐order polynomial was the most probable, followed by the second‐order polynomial (~1.6 times less likely) and linear models (~2.5 times less likely). Estimates of ρ2 for the three equally likely models suggested that none of them explained a large amount of the variation in surfacing responses (ρ2 range = 0.05–0.12). But as with the probability of surfacing, the data were highly variable, with no subsurface immobilizations as the most frequent outcome of all trials (Figure 4).
Candidate models used to determine the relationship between proportion of fish exhibiting subsurface immobilization as a function of power applied to the fish (Dm [μW/cm3]). Included are the degrees of freedom (df) for each linear model, Akaike information criterion corrected for small sample size (AICc), relative difference in AICc to the top‐ranked model (ΔAICc), and likelihood relative to the other models within the candidate set (wi). Evidence ratios (ER) and McFadden's pseudo R2 (ρ2; McFadden 1974) are also included. Inestimable values are represented by (—).
| Model | df | AICc | ΔAICc | wi | ER | ρ2 |
| Third‐order polynomial | 4 | 115.2 | 0.0 | 0.38 | 1.00 | 0.12 |
| Second‐order polynomial | 3 | 116.1 | 1.0 | 0.23 | 1.62 | 0.09 |
| Linear | 2 | 117.0 | 1.8 | 0.15 | 2.49 | 0.05 |
| Fourth‐order polynomial | 5 | 117.5 | 2.4 | 0.12 | 3.23 | 0.13 |
| Intercept only | 1 | 119.5 | 4.3 | 0.04 | 8.50 | — |
| Fifth‐order polynomial | 6 | 119.9 | 4.7 | 0.04 | 10.56 | 0.13 |
| Sixth‐order polynomial | 7 | 120.2 | 5.0 | 0.03 | 12.28 | 0.16 |
| Seventh‐order polynomial | 8 | 123.2 | 8.0 | 0.01 | 55.62 | 0.16 |
| Eighth‐order polynomial | 9 | 126.2 | 11.0 | <0.01 | 252.13 | 0.16 |
DISCUSSION
Blue Catfish did not exhibit a surfacing response when Dm was <2.14 × 10⁻⁵ μW/cm3 or >0.854 μW/cm3. This is the first study that has identified minimum and maximum LFE power levels to elicit Blue Catfish's unique surfacing response. Morris (2018) tested Blue Catfish LFE response in a study similar to ours; however, he found that only 7 out of the 202 fish tested surfaced and these fish were captured using seven different waveforms (i.e., combinations of pulse rates and duty cycles). As such, he did not report a recommended power setting for maximizing capture probability based on these trials but simply concluded that surfacing behavior was rare. The seven fish that surfaced in Morris' study were tested at a peak voltage gradient of 0.36–0.73 V/cm. These trials were conducted at a water conductivity of 94 μS/cm, which matched the measured conductivity of their fish. Using equation (2) (equation 3 is unneeded, as conductivity of the water and the fish matched, so Da = Dm in these trials), we calculate that the range of Dm values associated with surfacing fish in Morris' trials was 12.2–50.1 μW/cm3. We did not test power levels higher than 3.65 μW/cm3 in our study; however, results from Morris (2018) indicate that some level of surfacing, although rare, can occur above our highest effective Dm (0.854 μW/cm3). However, it is also possible that the lower surfacing rates observed by Morris are due to procedural differences, such as handling and acclimation time (discussed below).
Some Blue Catfish appear more likely to exhibit a surfacing response during LFE than others. On average, only 45% of fish surfaced in the successful laboratory trials (i.e., trials in which at least one fish surfaced from the group tested), indicating a high degree of variation among individuals in response to electrical fields. Only 1 out of the 49 trials in our study had 100% of the fish respond. Morris (2018) also saw only a small proportion of Blue Catfish (5.2%) and Flathead Catfish (4.4%) surface in experimental tanks. Further, Montague (2021) found that only 9.8% of Flathead Catfish surfaced in the experimental trials, suggesting that not every fish exhibits a surfacing response when exposed to LFE. One possible explanation for this observation is that some fish may be physiologically more predisposed to exhibit surfacing behavior. If this were the case, we might expect to see a greater proportion of fish surfacing in trials where fish were originally collected with LFE (i.e., all fish collected this way must be susceptible to LFE) than when fish were collected with some other gear (some of which may be vulnerable to LFE but others may not be). However, we found no significant difference in the rate of surfacing fish between gill‐net‐collected and LFE‐collected fish, suggesting that this is not the case. Whatever the cause, we suggest that the probability of a given fish surfacing is not totally determined by reaching a Dm threshold but must include some additional behavioral component or is related to a physiological condition that varies between individuals and through time that affects the fish's response to the threshold.
The high variability in the proportion of fish that surfaced at any given Dm value is cause for concern that CPUE from LFE may not provide a precise method for estimating relative abundance in the field. An assumption relating CPUE to fish abundance is that the catchability (q; the proportion of fish present that are collected with one unit of effort) is constant across sampling events (Hubert et al. 2012). If variability in catchability is as great or greater than the magnitude of meaningful population changes, then CPUE will be unable to detect the population change and use of that gear is ill advised (i.e., could suggest no change occurred when the change was large enough to warrant management intervention). Buckmeier and Schlechte (2009) quantified catchability for Blue Catfish in a field study and found it was low (0.2–4.1%) and variable but showed no variation across size‐classes. Further research is needed to confirm if LFE CPUE for Blue Catfish can be used to accurately index abundance.
Time since last electrofishing exposure and handling stress may impact the surfacing rates of catfish exposed to LFE. In preliminary trials, we found that too short of an acclimation period (<24 h) would lead to unsuccessful trials (i.e., no fish exhibiting a surfacing response) even when testing Dm levels expected to produce surfacing (i.e., seven trials conducted with fish at power densities between 2.14 × 10⁻³ and 2.14 × 10⁻² μW/cm3 with <24 h acclimation time had no fish surface when seven trials conducted with >24 h at similar power densities all had at least two fish that responded). Without adequate acclimation time, this could mean that fish were physiologically incapable of exhibiting a surfacing response (although it is also possible that the mechanism was behavioral rather than physiological). Others have documented an inability to recapture catfish in the field after only short recovery times from previous electrofishing events. For example, Marshall (2009) collected very few recaptured Blue Catfish and Flathead Catfish (<2% recapture rate) from a known population in a blocked cove in Lake Wilson, Alabama, after waiting only 24 h before resampling the cove and theorized that it was due to too short of an acclimation period (<24 h). Additionally, preliminary trials in our study indicated that fish handling stress causes unsuccessful trials. Specifically, we could not get surfacing responses if we handled fish to move them into the test chamber <24 h before the test was conducted, even when it had been >48 h since they were electrofished in the field. These preliminary observations led us to place the fish directly into the test tank when they were brought into the lab, and we held them for ≥48 h in the test tank before conducting a trial. The ideal acclimation time for eliciting a surfacing response is still not known and warrants further research, as longer recovery periods may be required before catfish can become susceptible to electrofishing gear again.
The mechanism(s) underlying the response of Blue Catfish to LFE are not well understood but could be related to the presence of ampullae of Lorenzini, which are an electroreception organ found in Ictalurid catfish that is sensitive to signals <30 Hz (Crampton 2019). It has been suggested that fish with ampullae of Lorenzini are more vulnerable to electrofishing (Pettigrew and Wilkens 2003), but this is anecdotal and needs to be verified. Further research into the mechanism causing the LFE response in catfishes is needed, as it may help explain the variability we observed and provide additional information that would be useful in refining LFE sampling.
Flathead Catfish are also susceptible to LFE and are often sampled at the same time as Blue Catfish (Morris 2018); however, their immobilization thresholds are unknown. Montague (2021) was unable to find an immobilization threshold for Flathead Catfish; however, he noted that the probability of a fish surfacing was inversely related to Dm over the power range he tested (Dm = 1–14 μW/cm3), suggesting peak surfacing may occur at lower values than tested (potentially placing the Dm for peak capture of Flathead Catfish into a range similar to that we observed for Blue Catfish [2.14 × 10⁻⁵ to 0.854 μW/cm3], but this has yet to be tested). Determining if electrofishing power thresholds differ between Blue Catfish and Flathead Catfish is crucial in determining if the species can be sampled simultaneously. Therefore, determining LFE power thresholds for Flathead Catfish is an area that should receive future research attention.
Our recommended target Dm values are considerably lower than target Dm values (i.e., 60–82 μW/cm3; Miranda 2005, 2009) suggested for more typical higher‐frequency electrofishing (i.e., 30–60 Hz). This may be related to the electroreceptive abilities of some catfishes (Peters and Buwalda 1972; Crampton 2019). We suspect that this low Dm threshold is why Blue Catfish commonly surface far from electrofishing boats. The lower Dm values we found effective at eliciting a surfacing response in Blue Catfish are many orders of magnitude lower than common electrofishing immobilization thresholds. During a routine electrofishing survey, these lower Dm values would only occur out away from the electrofishing boat where Blue Catfish commonly surface. A better understanding of how LFE fields vary within the water column is needed to fully understand how this phenomena affects surfacing behavior in the field.
We found Dm values from 9.29 × 10⁻⁵ to 0.2084 μW/cm3 were effective at eliciting surfacing behavior by Blue Catfish (Figure 2). To meet this power target (Dm), the power in the water around the fish (Da) will need to be adjusted for the conductivity of the water on any given day using equation (3) (i.e., to account for the difference between conductivity of the water and fish). Detailed electrical field mapping around the electrodes of common electrofishing boat designs is then needed to establish how pulse‐box power settings affect the volume of water that has this range of Da values (i.e., to relate Pa, power at the electrode droppers, to Da, power density in the water). Ultimately, this information should then be used to develop electrode power or amperage goals that maintain the same volume of water with the effective Da value to standardize the area over which fish are being affected so that CPUE can be standardized. Ultimately, CPUE standardization in this manner should allow for more accurate estimates of population trends and more effective Blue Catfish management. Until Ictalurid power goals can be fully derived, we recommend that the power goals of Bonar et al. (2009) be used because these values are known to be effective for both Blue Catfish and Flathead Catfish (Shoup, unpublished data) and are already widely used for standardized 60‐Hz electrofishing. It is possible that there could be specific power settings that would be better optimized for Blue Catfish (e.g., produce a larger effective zone over which fish surface or have other desirable attributes), but until additional research illuminates these advantages, using a consistent set of power tables provides a simple way to standardize electrofishing effectiveness. Research should be conducted on power density gradients at various distances from the boat to better understand what the effective field size is when using the power tables from Bonar et al. (2009) for LFE. More important, additional research is still needed to determine if catchability of LFE is consistent enough to be useful for indexing Blue Catfish population demographics (i.e., with marked fish or other “known population” approaches).
ACKNOWLEDGMENTS
We thank Alexis Whiles, Jory Bartnicki, Shelby Jeter, Michael Richardson, and Olivia Knowles for assisting with field sampling and lab work for this project. We thank Jan Dean for help with our experimental design and calculations. Financial support for this publication was provided by the Sport Fish Restoration Program grants F‐50‐R‐25 and F‐86‐D‐1 to the Oklahoma Department of Wildlife Conservation, the Natural Resource Ecology and Management Department at Oklahoma State University, U.S. Department of Agriculture National Institute of Food and Agriculture Hatch project number 1023034, and the Division of Agricultural Sciences and Natural Resources at Oklahoma State University. Patrick B. Cooney is an employee of Smith‐Root and a Smith‐Rootproduct, the APEX box, was used in this work. There are no other conflicts of interest.
