


Abstract
The southwestern edge of the natural range of smallmouth bass Micropterus dolomieu contains streams that become disconnected pools during summer primarily owing to hydrogeologic conditions, including high evapotranspiration rates. These conditions may complicate fisheries management by affecting fish behavior or mortality rates. The objectives of this study were to characterize summer habitat use by smallmouth bass, estimate the changes in the extent of available habitat, describe summer movement patterns, and estimate summer survival rates. Radio transmitters were implanted into 60 smallmouth bass during May 2006, and the fish were tracked until October in the forks of the Illinois Bayou, which drains a portion of the Ozark National Forest. Habitat characteristics were measured as the summer progressed, and during this time most riffle–run habitat dried completely, resulting in a series of disconnected pools. The decreases in wetted area exceeded 55% in certain 2‐km study reaches; however, smallmouth bass were consistently found at a median depth of 0.80 m. Boulder habitat was preferred when it was available; however, cobble, gravel, and bedrock substrates were also used. By July, velocity was below detection levels and water temperature occasionally exceeded 30°C. The average distance moved by smallmouth bass was 270 m in May, decreasing to 54 m by July. The distances moved were greater on average but more variable in streams with larger losses of wetted area, as fish moved away from drying areas. The survival rate was lowest in the stream most accessible to anglers. Dryness appeared to increase mortality, as survival estimates were lower than expected from published studies of streams with continuous summer flow. The effective management of fisheries under such hydrologic conditions may require preserving continuous surface flow and the quality of remnant pools as well as implementing more restrictive harvest regulations in summer.
The southern parts of the range of smallmouth bass Micropterus dolomieu, such as northwestern Arkansas, contain streams that tend to lose surface flow (Hines 1975) during the summer when evapotranspiration is high. At this time, riffle–run habitats become rare (Homan et al. 2005). The surviving fish in these systems are forced to either congregate in remnant pools, where they must compete for available resources and are more susceptible to predators (Lowe‐McConnell 1975; Harvey and Stewart 1991; Gagen et al. 1998), or move long distances to escape the drying stream reaches entirely. The populations of smallmouth bass in streams that experience seasonally discontinuous surface flow have lower production rates and abundance than those in streams with more continuous surface flow (Homan 2005). Thus, managing a sustainable fishery in this type of stream will probably require assessing the potentially elevated mortality, avoidance movements, and changes in habitat use associated with dryness.
Smallmouth bass in lotic systems have been described as a sedentary species (Funk 1957; Todd and Rabeni 1989) with strong homing behavior after movement (Larimore 1952). Fajen (1962) found that the smallmouth bass in two small Ozark streams normally restricted their movements to one distinct pool. Lyons and Kanehl (2002) reviewed the available literature and concluded that during the summer smallmouth bass generally remained in localized areas, their net movements totaling less than 1 km. In Otter Creek and the Pecatonica River, Wisconsin, all movements were less than 200 m (Lyons and Kanehl 2002), and few long‐range movements were observed during the summer in the Wolf and Embarrass Rivers of Wisconsin (Langhurst and Schoenike 1990). Although the movement patterns of smallmouth bass have been studied extensively, the loss of surface flow during summer could affect them in ways that are not well understood.
It is not unusual for harvested smallmouth bass populations to have a total annual mortality rate of 50% or more (Coble 1975; Paragamian and Coble 1975). However, Reed and Rabeni (1989) found that annual mortality ranged from 11% to 16% in streams with light to no fishing pressure. Thus, natural mortality appears to be relatively low in typical smallmouth bass streams. Where seasonal drying is pervasive, elevated mortality has been documented for nongame fishes (Gagen et al. 1998), but the influence of stream drying on the natural mortality of smallmouth bass is not well known.
The objectives of this study were to (1) characterize smallmouth bass summer habitat use, (2) characterize the changes in the extent of available habitat (as determined by velocity, depth, temperature, and substrate) throughout the summer, (3) characterize summer movement patterns, and (4) estimate smallmouth bass summer survival rates in a stream system that has a tendency to lose surface flow. By comparing the movement patterns and survival rates with those reported for systems with continuous flow throughout the summer, we hoped to better understand the influence of these hydrologic conditions on smallmouth bass populations. This knowledge should help fisheries managers set harvest regulations that reflect the effects of low flows on mortality and inform decisions pertaining to the protection of surface flows and remnant pools in affected ecosystems.
Methods
This study was conducted on the North, Middle, and East forks of the Illinois Bayou, which drains a portion of the Boston Mountain ecoregion in Arkansas (Figure 1). As all three forks lie within the administrative boundaries of the Ozark National Forest, the riparian vegetation is protected by a streamside management zone. The upland stream system is characterized by pool‐and‐riffle sequences dominated by bedrock, boulders, and cobble; however, reduced flow results in a series of isolated pools during late summer (Homan et al. 2005). Sustained groundwater springs (which would be expected to supply significantly cooler water in summer) are rare or nonexistent for streams of this size in the Boston Mountain ecoregion. Furthermore, the subsurface flow between the more perennial pools isolated by dry surface reaches is so limited that its effect on stream temperature is negligible. The study reaches had similar watershed sizes (148 ± 3 km2), thus minimizing the effects of differing watershed size on the degree of seasonal drying.

Locations of study sections and sites at which smallmouth bass were initially implanted with radio tags in the Illinois Bayou. The searches for radio‐tagged fish were continuous from the furthest upstream to the furthest downstream marked portion of each fork. Wetted widths were regularly measured for all shaded stream sections, and additional habitat characteristics were assessed for one‐half of each section (the upstream halves of the upstream and midstream sections as shown in black in inset A and the downstream halves of the downstream sections as shown in black inset B).
Radio transmitters were surgically implanted in 60 smallmouth bass (20 per stream) to study habitat use, movement, and survival. Smallmouth bass were captured between 17 May and 26 June 2006 via hook and line. Based on visual observation, the majority of spawning activity was over before this sampling occurred. The length of each study fork was sampled from the upstream edge of the most upstream section to the downstream edge of the most downstream section to distribute the radio transmitters as evenly as possible (Figure 1). Fish capture locations were recorded with a handheld Global Positioning System unit (Magellan Sport Trek Pro; 3‐m accuracy). The fish were anesthetized in clove oil at a concentration of 60 mg/L following the methods outlined by Peake (1998). They ranged from 206 to 333 mm in total length (TL) and from 103 to 335 g in weight. To ensure that the weight of the transmitters did not exceed 3% of the fish's body weight, we used two sizes of transmitters with trailing‐wire antenna. Forty‐five of these (Model F1580; Advanced Telemetry Systems) weighed 3.6 g and had a battery life of 200 d; these were used in fish weighing more than 120 g. The remaining 15 (Model F1570) weighed 3.1 g and had a battery life of 146 d; they were used in fish weighing more than 103 but less than 120 g. After the fish were anesthetized, the transmitters were surgically implanted into their peritoneal cavities following the methods outlined by Hart and Summerfelt (1975). After a brief recovery period (typically 3 min), the fish were released at their original capture locations. We searched for them during daylight hours once per month between May and October 2006. The complete length of each study fork was traveled in a kayak with a handheld receiver (Model R‐1000; Communications Specialists) and Yagi–Uda antenna. When a radio‐tagged fish was located during this linear search but not observed (48% of locations), we used the strength of the signal to estimate its precise location. The depth of the water column was measured to the nearest centimeter at each fish location with a leveling rod, and the velocity was measured at the standard 6/10 of water depth (Model 2000 Flo‐Mate; Marsh‐McBirney). Temperature was measured to the nearest tenth of a degree (Celsius) at each fish location, and the primary and secondary substrates were estimated according to the grade scale defined by Wentworth (1922). These visual estimates of substrate composition were considered sufficiently accurate for this application based on Wang et al. (1996).
The extent of the wetted area (available habitat) was measured in June, July, and September within three 1‐km reference sections per stream (upstream, midstream, and downstream; Figure 1). Available habitat was also measured in the midstream reference section of the North Fork on 11 May 2007 to provide an estimate of habitat conditions at a time of year without stream dryness for comparison (normal spring discharge). In addition, the wetted area was measured monthly 1 km beyond the boundaries of each reference section, for an overall total of 6 km per stream (Figure 1). Habitat transects were set every 50 m along a hip‐chain extending throughout each 1‐km section. Locations (GPS) were recorded at each transect and the wetted width was measured with a laser range finder (Sokkia HL3D Handlaser; Lasercraft). Wetted widths were visually separated into quarters, and the depth and velocity were measured at the midpoint of each quarter segment. Substrate was characterized by two separate readers visually estimating the percentage contribution of each substrate class (Wentworth 1922). Substrate composition was measured only in September because no major channel‐altering velocity occurred during the study period. Substrate composition was assessed at the same locations relative to bankfull width and subsequently adjusted for wetted width (using ArcGIS; see below) to quantify the change in available habitat as discharge decreased during the summer. Available temperature was measured by temperature loggers placed at the upstream and downstream ends of the study forks at middepth in the water column of the larger pools, which were unlikely to go completely dry (Model DS1921G‐F5, Maxim Dallas Semiconductor; and StowAway Tidbit, Onset Computer Corporation).
The wetted area of each reference section was mapped in ArcGIS using wetted widths, GPS waypoints, and hip‐chain measurements. Depth and substrate maps were created by the Kriging ordinary interpolation method in ArcGIS Spatial Analyst. The spherical semivariogram model was selected with an output cell size of 0.5 m. The search radius was variable, the number of points being set to 12 and the maximum search distance to 75 m. Brenden et al. (2006) determined that bathymetric maps created by similar methods were accurate to within 0.25 m.
The nonparametric Kruskal–Wallis test with Dunn–Sidak multiple comparisons was used to determine whether the depth or temperature at fish locations differed significantly by month or stream site (P ≤ 0.05 and following Sokal and Rohlf 1995). Stream site was determined by separating the length of each study fork into thirds in ArcGIS. To determine whether the substrate at fish locations differed significantly by month or site, a log‐likelihood ratio test was used (G‐test; Zar 1999). Multiple comparisons were made with pair‐wise G‐tests adjusted for significance by the Bonferroni method (Zar 1999). Only the gravel, cobble, boulder, and bedrock substrate categories were used in this analysis owing to the very low frequency of fish occurrence over sand and silt (2% of total for each). G‐tests were also used to determine whether the depth and substrate composition at smallmouth bass locations differed significantly from that in the available habitat for each month and site. Depth and substrate distributions from map layers created in ArcGIS represented available habitat. Numeric codes were assigned to substrate types to facilitate interpolation for the ArcGIS substrate maps based on categorical data (1 = sand, 2 = gravel, 3 = cobble, 4 = boulder, and 5 = bedrock).
Movement was estimated by plotting the GPS locations in ArcGIS. The track log created in the GPS while searching for transmitter‐bearing fish was used to create a polyline shapefile representing the stream layer for each fork of the Illinois Bayou. Cumulative movement was calculated by summing the absolute differences between successive relocations measured along the aforementioned stream layer (as distance moved in meters). Net movement was described as the distance and direction between the fish's initial (May) and final (October) locations along the stream layer. A Kruskal–Wallis test followed by a Dunn–Sidak analysis was used to determine whether movement differed among months. A G‐test with Yates correction for continuity (Zar 1999) was used to determine whether the proportion of upstream versus downstream fish movements indicated direction away from the greatest losses in wetted area.
Survival was estimated by means of an extension of the Kaplan–Meier procedure to allow for staggered entry (Pollock et al. 1989). Ninety‐five percent confidence intervals (CIs) were calculated for all estimates of survival following the methods of Pollock et al. (1989). SAS version 9.1 was used for all statistical comparisons (SAS Institute 1999).
Results
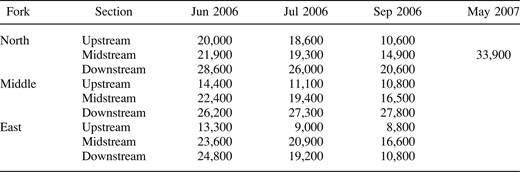
Radio‐tagged fish were located 262 times during this study. At the end of the study in October, 26 fish were alive, 13 were deduced to be dead, and 21 were missing and were censored for the survival analysis. All of the study forks flowed continuously along their lengths while we were implanting transmitters but were interrupted by dry reaches shortly thereafter. Discharge during the summer of 2006 was below average, so losses in wetted area may have been greater than in a year of average discharge. The North Fork had the greatest loss of wetted area (47%) relative to the upstream sections of the other streams. The midstream sections of all three streams had similar losses in wetted area, ranging from 26% in the Middle Fork to 32% in the North Fork. However, the downstream sections ranged widely with respect to changes in wetted area throughout the summer. The downstream section of the North Fork had a 28% loss in wetted area while that of the Middle Fork had an increase of 6%. This increase was mainly the result of a rain event on 17 September. The downstream section of the East Fork had the largest loss in wetted area throughout the summer (over 56%). Reflecting average May flow conditions, the wetted area of the midstream section of the North Fork in May 2007 was greater than that of any stream sections measured in June 2006 (Table 1).
Wetted areas (m2) of all nine 2‐km reference sections in June, July, and September 2006 as well as the midstream section of the North Fork in May 2007 (the latter to represent typical spring discharge on the Illinois Bayou)
Wetted areas (m2) of all nine 2‐km reference sections in June, July, and September 2006 as well as the midstream section of the North Fork in May 2007 (the latter to represent typical spring discharge on the Illinois Bayou)
Smallmouth bass selectively used relatively deep water in each month and site (G = 2,800–3,100, df = 7, and P < 0.01 for each selectivity evaluation; also see Figure 2). However, the depth at fish locations did not differ significantly by month (H = 1.3, df = 2, P = 0.53) or site (H = 1.9, df = 2, P = 0.38). The mean depth at fish locations was 0.87 m (95% CI, 0.82–0.91 m) and the median depth was 0.80 m (interquartile range, 0.65–1.04 m). Smallmouth bass were found in water with depths ranging from 0.50 to 1.00 m 60% of the time. For comparison, only 29, 28, and 25% of the stream area was 0.50–1.00 m deep in June, July, and September, respectively. A much greater portion of the stream area was shallower than 0.50 m (June, 62%; July, 66%; and September, 68% of the total stream area), but fish were rarely found at these depths (13% of fish locations). The shallowest depth of any smallmouth bass location throughout the study was 0.09 m. The mean area with depths exceeding 0.09 m within the reference sections ranged from 2,600 to 13,800 m2 between June and September 2006, compared with 18,100 m2 for one reference section at normal May discharge (Table 2).
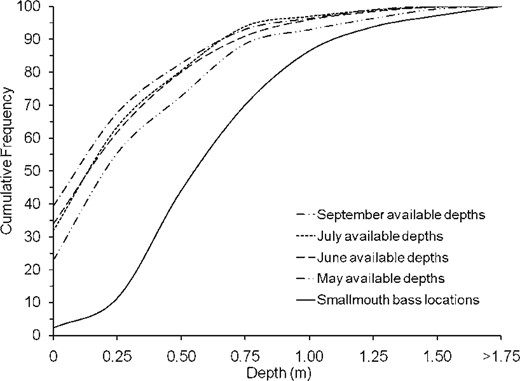
Cumulative frequency curves for water depth at smallmouth bass locations (n = 177) from 1 June to 6 October 2006 and measured available depths within study sections in the Illinois Bayou in June, July, and September 2006 as well as the midstream section of the North Fork in May 2007 (the latter to represent typical spring discharge).
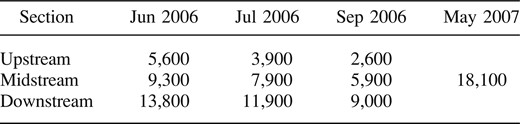
Average area of depth exceeding 0.09 m in the upstream, midstream, and downstream reference sections in June, July, and September 2006 as well as the midstream section of the North Fork in May 2007
Average area of depth exceeding 0.09 m in the upstream, midstream, and downstream reference sections in June, July, and September 2006 as well as the midstream section of the North Fork in May 2007
There was no detectable velocity at radio‐tagged smallmouth bass locations between 28 June and 26 September. Fewer than 15% of the velocity measurements at these locations were greater than 0 (26 of 179). Where the velocity was measurable, it averaged 0.02 m/s. In June, 93% of the measured available velocities were less than 0.1 m/s, and in July 98% were less than 0.1 m/s. There was no measurable velocity anywhere within the study sections at the time of habitat mapping in September, and measurable velocities did not return until a rain event on 23 September 2006. On 11 May 2007, the discharge in the Illinois Bayou matched the median discharge for that date based on 60 years of data (USGS 2007); therefore, the velocity measurements from the middle section of the North Fork are considered representative of the Illinois Bayou in May, when measurable velocities are more common. At that time, only 54% of the measured available velocities were less than 0.1 m/s within the midstream section of the North Fork.
The temperatures at radio‐tagged smallmouth bass locations did not differ significantly by site (H = 0.44, df = 2, P = 0.80). However, they did differ significantly by month (H = 93, df = 2, P < 0.01), and all multiple comparisons were significant at α = 0.05 (with August > June > September; Dunn–Sidak test). The majority of the temperatures at fish locations were within the range of reference temperatures recorded by the temperature loggers. An exception occurred in late July and early August (Figure 3), when the temperatures at the locations at which radio‐tagged fish were found were higher on average than those that were available. Seven of the 182 temperatures measured at fish locations exceeded 30°C.
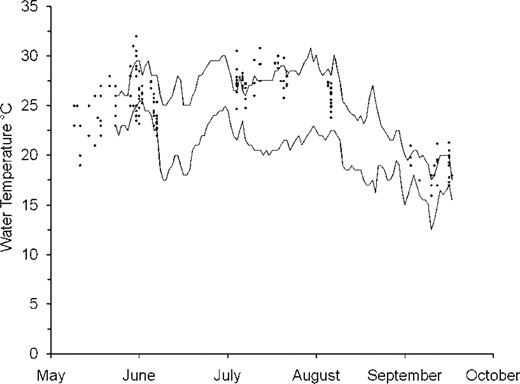
Scatterplot of water temperatures at smallmouth bass locations (diamonds; n = 182) compared with the maximum and minimum water temperatures (solid lines) recorded by temperature loggers at the upstream and downstream ends of the study forks.
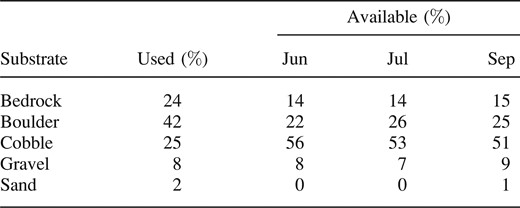
There was 86% agreement on the primary substrate designations at the 648 locations at which independent observers estimated substrate composition. The percentages of the various types of substrate at radio‐tagged smallmouth bass locations (n = 238) did not differ significantly by month (G = 1.6, df = 6, P = 0.95) or site (G = 4.3, df = 6, P = 0.63), so they were pooled for further analysis. Relative to the proportions available in the environment, smallmouth bass showed significant selectivity for bedrock and boulder rather than cobble for most site × month combinations (June upstream: G = 55, df = 3, P < 0.01; June midstream: G = 47, df = 3, P < 0.01; June downstream: G = 8.1, df = 3, P = 0.04; July upstream: G = 51, df = 3, P < 0.01; July midstream: G = 44, df = 3, P < 0.01; September upstream: G = 70, df = 3, P < 0.01; and September midstream: G = 47, df = 3, P < 0.01). At the downstream sites the proportion of stream area with cobble substrate decreased from 42% in June to 33% in September as stream dryness increased, resulting in a larger proportion of boulder habitat. Consequently, the substrate compositions at smallmouth bass locations were not significantly different from those of the available habitat in July and September within the downstream sites (July downstream: G = 5.2, df = 3, P = 0.16; September downstream: G = 2.1, df = 3, P = 0.55). Smallmouth bass were located over boulder, cobble, bedrock, and gravel 42, 25, 24, and 8% of the time, respectively (Table 3). The available substrate was dominated by cobble, ranging from 51% of the area in September to 56% in June. The proportion of boulder substrate ranged from 22% of the area in June to 26% in July. Bedrock comprised approximately 14% of the available substrate across all months.
Predominant substrates at smallmouth bass locations (n = 238) relative to available substrate within study sections on the North, Middle, and East forks
Predominant substrates at smallmouth bass locations (n = 238) relative to available substrate within study sections on the North, Middle, and East forks
The average cumulative movement was 270 m in May (95% CI, 88–452 m), decreasing to 54 m (23–86 m) by July (Figure 4). Cumulative movement was significantly different among months (H = 22, df = 4, P < 0.05). However, a Dunn–Sidak analysis (α = 0.05) indicated that only the May (greatest) and July (least) cumulative movements were significantly different from the others. Seven of 58 (12%) smallmouth bass had cumulative movements exceeding 1,000 m throughout the study, and 6 of 58 (10%) had net movements exceeding 1,000 m. A fish from the North Fork showed the greatest cumulative and net movements—5,480 and 3,860 m, respectively. Most fish (44 of 58) had net movements totaling less than 500 m. The average cumulative movements of fish in the North, Middle, and East forks were 645 (109–1,180), 298 (158–437), and 480 m (119–841 m), respectively (Figure 5). The mean net movements of fish in the North, Middle, and East forks were 458 (59–857), 212 (76–347), and 429 m (60–797 m), respectively (Figure 5). In the North and Middle forks, fewer than one‐half of the cumulative movements were upstream (39% and 40%, respectively), whereas smallmouth bass in the East Fork tended to move upstream more often (55% of cumulative movements). The results for the direction of net movements were similar, only 35% and 36% of those in the North and Middle forks being upstream, versus 56% of total net movements in the East Fork. In the Middle and North forks the greatest losses in wetted area were in the upstream sections, whereas in the East Fork the most severe loss was in the downstream section. The proportion of upstream movement was greater in the East Fork than in the Middle and North forks for both net and cumulative movements (G = 8.2, df = 1, P < 0.01; and G = 4.6, df = 1, P = 0.03, respectively). Thus, movements were away from the portions of the stream most prone to drying.

Average movements by smallmouth bass and changes in wetted area within the reference sections of the Illinois Bayou.

Average ± 2 SE cumulative and net movements of radio‐tagged fish within the North, Middle, and East forks from 17 May to 6 October 2006.
The summer survival of smallmouth bass varied among the three forks of the Illinois Bayou. In the North Fork, it was estimated to be 67% (95% CI, 45–67%), which was the lowest among the three streams. The Middle and East forks had relatively similar rates of summer survival at 79% (61–97%) and 84% (68–100%), respectively.
Discussion
The mortality of smallmouth bass in the Middle and East forks was probably dominated by natural mortality factors such as stream dryness and predation since virtually no fishing pressure was witnessed within the majority of the study areas. Bare (2005) estimated the survival of adult smallmouth bass to be approximately 84% in a similar Ozark stream for the September–March period. By combining his estimates with the May–September survival estimates from this study in the East and Middle forks, we estimated annual survival as 66–71%. An annual survival rate of 84% was estimated for an unexploited population of adult smallmouth bass in a perennial Missouri Ozark stream (Reed and Rabeni 1989), and in a review of 15 different studies Reed and Rabeni (1989) found that annual survival ranged from 84% to 89% in streams with light to no fishing pressure. Thus, even though most of the adult smallmouth bass in this study positioned themselves in large pools containing enough water for them to survive the dry period of the summer, it appears that their mortality rates were higher than those reported for systems with continuous flow throughout the summer and limited angling pressure.
Only two of the smallmouth bass tracked in this study were found dead in dry reaches. These fish remained alive into early July in pools that became isolated in June. However, on August 9, the transmitters of the two fish were recovered on the beds of the pools, which had completely dried out. This stream reach was within the upstream section of the North Fork, where numerous primitive campsites were occupied frequently throughout the summer. Three additional fish from this section could not be located in July after pools had become isolated. Fish congregating in shrinking remnant pools are more susceptible to predators (Lowe‐McConnell 1975; Harvey and Stewart 1991; Gagen et al. 1998). The three missing fish were probably either killed by a predator or captured by an angler camping in the vicinity. Further evidence for this conclusion is that the only transmitter returned after harvest by an angler came from a campsite located just downstream of this section of the North Fork. Populations of smallmouth bass subjected to heavy fishing pressure often have annual survival less than 50% (Coble 1975; Reed and Rabeni 1989). By extrapolating Bare's (2005) September–March survival estimates with the May–September North Fork survival estimates from this study, we estimated an annual survival rate of 56%, which is substantially lower than those for the Middle and East forks (66–71%). The low survival in the North Fork is best explained by a combination of stream dryness and angler access. In systems that experience low‐flow periods, limiting angling pressure during those periods may be critical to fishery sustainability.
In addition to increasing the mortality of adult smallmouth bass, the amount and location of stream dryness appeared to influence summer movement patterns. The smallmouth bass in the Middle Fork moved less on average than those in the North and East forks and showed little variation between individual fish. The loss of wetted area was much lower in the Middle Fork than in the other two tributaries of the Illinois Bayou. Several fish in the North and East forks had net movements greater than 2 km and effectively avoided areas that later dried completely, whereas among those in the Middle Fork (which had fewer long reaches of complete stream dryness) the largest net movement was 1.1 km. In these systems, movement appeared to increase immediately before and after flowing reaches became isolated by dry reaches but was essentially precluded during the dry period.
The smallmouth bass within the study forks of the Illinois Bayou were selective with respect to depth throughout the summer in all sites (upstream, midstream, and downstream) even as water levels decreased and interpool movements became precluded by dry reaches. Our estimate of preferred depth was similar to that of published reports from other ecoregions (Todd and Rabeni 1989; Aadland 1993; Walters and Wilson 1996). The advantage of specialization relative to depth in lotic ecosystems has not been well documented, but it probably results from a combination of factors. The smallmouth bass in the forks of the Illinois Bayou frequented the interface between the shallow and deeper habitats near the upstream and downstream shoals of remnant pools. This area appeared to be deep enough to offer cover from predators while providing close proximity to the shallow habitat preferred by many smaller, potential prey species (Aadland 1993).
Several studies have reported that smallmouth bass were found in low velocities (Rankin 1986; Todd and Rabeni 1989; Aadland 1993), but this is the first study to report a preponderance of smallmouth bass in lotic habitats with no measurable velocity. In the absence of flowing water, fish are unable to drift feed, which eliminates an efficient feeding tactic used by smallmouth bass (Paragamian and Wiley 1987). Artificial reduction of stream discharge has contributed to lower production of rainbow trout Oncorhynchus mykiss, a species that also uses drift feeding (Rimmer 1985). A potential compensatory advantage in terms of the concentration of forage fish in drying pools seems to be short‐lived when pools are isolated from the rest of the stream drainage by dry reaches.
The smallmouth bass in this study did not select specific temperatures; instead, they used the range of temperatures available to them within the study area. Because fish were found at temperatures higher than those recorded by the temperature loggers, it might appear that they were seeking warm temperatures during the middle of the study period. However, the placement of temperature loggers in substantial pools that were unlikely to dry up completely probably resulted in reference temperatures that were slightly lower than those available to smallmouth bass trapped by low‐flow conditions. The range of temperatures used in this study (16–32°C) approached the upper thermal tolerance for smallmouth bass at the southern edge of their distribution. Even though growth is possible at 32°C (Wrenn 1980), the habitat suitability index curve developed by Edwards et al. (1983) codes temperatures of 32°C or more as 0 on a scale of 0 to 1 (1 being optimal). Thus, the smallmouth bass in the Illinois Bayou are subjected to suboptimal water temperatures during the summer, and protection of riparian forest canopies to minimize the adverse effects of higher temperatures appears to be particularly critical for these types of systems.
Smallmouth bass are generally associated with substrates consisting of gravel, cobble, and boulder (Coble 1975; Paragamian 1981; McClendon and Rabeni 1987; Walters and Wilson 1996; Bare 2005). Habitat suitability index curves consider gravel, broken rock, and boulder to be optimum substrates for smallmouth bass (Edwards et al. 1983). The results from this study were consistent with those of most previously published reports on smallmouth bass substrate use, but some new subtleties were identified. For example, although cobble was the most prevalent substrate within each of the three streams, it was used at much lower proportions than those measured. Boulder substrate was used in much greater proportions, so it appears that boulder substrate is preferred whenever it is available. Bedrock has a habitat suitability index score of 0.2 and has not typically been identified as a substrate associated with smallmouth bass. In this study, however, fish were frequently found over bedrock substrate, ranging from 10% of the time in the North Fork to 37% in the East Fork. Bedrock substrate was most prevalent in the East and Middle forks, which were the two streams in which smallmouth bass used bedrock most often. As bedrock‐formed pools were often the only places with ample water remaining in late summer, smallmouth bass were apparently compelled to use this suboptimal habitat frequently. The strategic placement of boulders to augment existing cover at preferred depths in these pools may offset this deficiency.
Todd and Rabeni (1989) reported that one‐third of the area within their study sites in the Jacks Fork River, Missouri, had preferred depths (>0.66 m). However, using a conservative depth of 0.09 m or more, we found that less than one‐third of the May stream area within the major forks of the Illinois Bayou is expected to have tolerable depths in September. The habitat quality within the North, Middle, and East forks was further limited by the low prevalence of boulders (on average only 16% of the substrate) and the fact that there was no measurable velocity in September. Todd and Rabeni (1989) suggested that a small amount of quality habitat can support a large biomass of adult fish; however, it seems clear that the amount of quality habitat is sufficiently limited that smallmouth bass are negatively affected during low‐flow conditions in this Boston Mountain stream.
The Illinois Bayou appears to be a typical smallmouth bass stream throughout most of the year, but this study documented a major loss of habitat quantity and quality during the summer. The majority of adult smallmouth bass in this study remained in home pools that did not dry during the summer. Thus, these home pools constituted seasonal refuges from potentially fatal environmental conditions. The loss of favorable habitat forced smallmouth bass to survive for months in suboptimal habitat in the Illinois Bayou and perhaps many other streams with similar hydrologic patterns. Adverse effects are expected to be exacerbated in drier than normal years. Management actions need to ensure that the limited water volume and depth are protected, along with favorable substrate composition. Water temperatures near the upper thermal tolerance of smallmouth bass indicate the need to protect riparian vegetation as a source of shade. Thus, anthropogenic activities such as instream gravel and rock mining, the withdrawal of water for fracturing oil shales, recreational ATV use, and agriculture must be monitored closely to avoid further reductions in habitat quantity or quality, and harvest regulations should consider the elevated morality associated with stream drying.
Acknowledgments
We thank Joseph Stoeckel and Ronald Rambo for technical guidance; John Hollabaugh, Charlie Ford, Jessica Wakefield, Scott Smith, Matt Wilberding, Jason Thornberry, Brandon Peoples, and Chris McKee for assistance with field work; and Tom Nupp for help with GIS. We also appreciate the thoughtful and constructive comments from the editor, Michael Hansen, and the anonymous reviewers. This was a cooperative project funded by the U.S. Forest Service, Ozark–St. Francis National Forest, and Arkansas Tech University.
References
USGS (U.S. Geological Survey). 2007 USGS surface water daily data for the nation Available: http://waterdata.usgs.gov/nwis/dv. (September 2007.)
