


Abstract
Commercial producers raising centrarchids in Arkansas routinely report winter mortality. Juvenile centrarchids are susceptible to harsh winter conditions. The Coppernose Bluegill Lepomis macrochirus purpurescens is a popular sport fish for recreational fishing, and there are no recommended best management practices for winter feeding of this species. An outdoor trial was conducted to investigate the effect of different feeding regimens on performance of Coppernose Bluegill in the winter of 2014–2015. Four feeding regimens were implemented that included feeding twice per week (2×/week), once per week (1×/week), twice per month (2×/month), or once per month (1×/month). Twenty‐five Coppernose Bluegill (initial weight = 2.59 ± 0.19 g) were stocked per tank (16 tanks, 4 replicates). Temperatures ranged from 0°C to 16°C during the trial. After 95 d, there were no differences (P > 0.05) in final weight or weight loss. Fish that were fed 2×/week or 1×/week had higher survival (P < 0.05) than those fed 2×/month or 1×/month. Fatty acid profiles of initial fish were distinctly different from the postwinter profiles of fed fish, although winter feeding frequency did not appear to influence fatty acid profiles in Coppernose Bluegill. Levels of saturates were higher in initial fish than in postwinter fish. The monounsaturated fatty acids 16:1 and 18:1(n‐9) were higher in initial fish than in postwinter fish. Initial fish contained lower levels of 18:2(n‐6), 20:4, and 22:6(n‐3) than postwinter fish. Total polyunsaturated fatty acids (PUFAs) and n‐3 and n‐6 levels were also lower in initial fish than in postwinter fish, while the ratio of n‐6/n‐3 fatty acids did not differ significantly among initial and postwinter fed fish. Data indicate that (1) overwintering and infrequently fed Coppernose Bluegill preferentially conserve PUFAs and (2) feeding 1 × /week or 2 × /week may be a beneficial strategy for sport fish producers to increase survival of Coppernose Bluegill during the winter in temperate regions of the USA.
For outdoor aquaculture enterprises located in temperate regions of the world, declining water temperatures during the fall and winter months cause a reduction in feeding activity. The lower feed consumption and decreased metabolic activity in fish lead to minimal or negligible growth, while physiological functions (such as the immune system) can be adversely affected to the extent that fish become susceptible to disease infections and “winterkill.” Winter fish mortality is a problem for sport fish farmers raising commercially important centrarchid species. Commercial farms and state/federal hatcheries often produce sunfish species, such as Bluegill Lepomis macrochirus, Black Crappie Pomoxis nigromaculatus, hybrid crappie (Black Crappie × White Crappie Pomoxis annularis), Redear Sunfish Lepomis microlophus, hybrid Bluegill (Bluegill × Green Sunfish Lepomis cyanellus), and Coppernose Bluegill Lepomis macrochirus purpurescens (also known as Lepomis macrochirus mystacalis), in temperate geographical regions that are susceptible to cold and fluctuating temperatures during the winter months. These cold temperatures can negatively impact the winter survival of fish and the profitability of fish farming operations (Roy et al. 2013, 2017, 2019a). In the winter of 2012–2013, Arkansas farmers reported centrarchid losses in nearly 487 ha (1,200 acres) of commercial ponds (Roy et al. 2013). Likewise, the success of state recreational fish stocking programs is often dependent on the survival of late‐spawned fingerlings over the winter months.
The Coppernose Bluegill is a subspecies of Bluegill that is native to northern Florida and is also found in southern Georgia (Hubbs and Allen 1944; Avise and Smith 1974). Reddish fins and a greater number of soft rays in the anal fin distinguish the Coppernose Bluegill from the Bluegill (Hubbs and Allen 1944). Because of their large maximum size (can exceed 0.45 kg in weight), ability to adapt to small impoundments, and overall aesthetic appeal as a game fish, Coppernose Bluegill are very popular for stocking in recreational ponds and lakes (Prentice and Schlechte 2000). Perhaps due to their native range in the extreme southern United States, juvenile Coppernose Bluegill are among the farm‐raised centrarchid species that are most negatively affected by cold winter pond temperatures in Arkansas.
Winter losses of fish, particularly juvenile fish, have been routinely reported in the spring by Arkansas sport fish producers (Roy et al. 2013, 2017, 2019a, 2019b). Winter mortality on commercial farms appears to be more prevalent in smaller fish, particularly those measuring less than 7.6 cm (3 in) TL (Roy et al. 2013). Smaller juvenile fish do not possess the energy reserves of larger, more mature fish. Juvenile centrarchids appear to be quite susceptible to harsh winter conditions. Although some of these winter fish losses are due to predation by fish‐eating birds and water quality (Roy et al. 2013), water temperature is also a significant contributing factor. Size‐dependent winter mortality is a widely studied phenomenon in natural systems but has been much less studied in commercial aquaculture production. In natural systems, many studies indicate that survival rates of small fish can be lower than those for larger fish (Johnson and Evans 1990; Hurst 2007; Shoup and Wahl 2011), although there are notable exceptions (see Kohler et al. 1993; Wright et al. 1999). Moffett and Hunt (1945) reported that Bluegill consumed very little food during the winter.
Various feeding strategies have been reported to enhance the nutritional status of cultured fish before, during, and after the winter months. Some researchers have fed enhanced diets supplemented with higher levels of vitamins and lipids during winter months to improve physiological condition before the cessation of feeding activity during winter (Tort et al. 2004; Richard et al. 2016). Others have focused on different feeding regimens that vary widely among sport fish farms (McNulty et al. 2000; Roy et al. 2017, 2019). For example, some farms feed the fish routinely (weekly) in winter as weather permits, while others feed less frequently during winter. Current production strategies for sport fish typically utilize natural spawning in the pond for species such as Bluegill and Redear Sunfish. After the hatching of fry in appropriately fertilized ponds, farmers will attempt to grow juveniles to a larger, more robust size (>7.6 cm) before the arrival of winter so that the fish can withstand harsher winter conditions. Hence, in the summer and fall, producers will transfer juvenile fish to indoor rearing vats for several weeks in order to feed‐habituate them before returning them to ponds for overwintering. This strategy facilitates both feed training and additional weight gain before winter.
Seasonal fluctuations in depots of polyunsaturated fatty acids (PUFAs) in fish, which may be related to variations in intake, are also evident in the literature. Gokce et al. (2004) reported, for example, that eicosapentaenoic acid (EPA; 20:5[n‐3], where the number to the left of the colon is the number of carbon atoms, the number immediately to the right of the colon is the number of double bonds, and the number after the hyphen indicates the position of the first double bond from the methyl end) varied between 3.36% (February) to 4.26% (April) during the year in Common Sole Solea solea, while docosahexaenoic acid (DHA; 22:6[n‐3]) varied from a low of 16.8% (February) to a high of 20.2% (August). Other fatty acids (FAs), such as arachidonic acid (ARA; 20:4[n‐6]), varied more broadly—from 12.3% in February to a low of 4.7% in August. On the other hand, some FAs changed little in Common Sole fillets throughout the year. Similarly, Nile Tilapia Oreochromis niloticus that were fed purified diets containing either menhaden oil or coconut oil had minimal differences in whole‐body FA compositions when subjected to low temperatures (Atwood et al. 2003). It has been reported that levels of EPA and DHA in wild‐caught Rohu Labeo rohita decrease in the summer compared to winter (Memon et al. 2010). Although this change might be related to physiological aspects associated with the lower water temperatures in winter, the decrease may also be due to the redistribution of essential FAs to gametes used during spring spawning. However, that mechanism would not be expected to influence immature juveniles.
Thus, it appears that FA compositions during the winter tend to reflect preferential use of some FAs for energy and the preferential retention of other FAs for their critical functional properties in disease resistance, ionic balance, immunity, membrane fluidity, and inflammatory response (Castell et al. 1972; Tacon 1996; Glencross 2009). It has been reported that decreases in saturates and monoenes occur in winter (Roy et al. 2017, 2019a, 2019b). Oleic acid (OA; 18:1[n‐9]) is reportedly used as an energy source during winter (Henderson and Sargent 1985; Roy et al. 2017), but Tocher et al. (1998) suggested that 18:1(n‐9) can be utilized as a substrate for PUFA synthesis. Since all linoleic acid (LA; 18:2[n‐6]) and alpha‐linolenic acid (18:3[n‐3]) originate in plants and must be diet‐derived in fish, dietary intake (however minimal) and initial body depots of LA and alpha‐linolenic acid in overwintered fish might effectively set the upper limit of total availability. Linoleic acid is used to synthesize longer‐chain n‐6 FAs that are required to conserve cellular eicosanoid signaling and membrane integrity, which are essential during winter. Further, conservation of n‐3 long‐chain PUFAs (LC‐PUFAs) is a recognized strategy in freshwater fish for coping with LC‐PUFA‐restricted dietary intake (Turchini et al. 2011; Codabaccus et al. 2012), as fish will induce synthesis of n‐3 LC‐PUFAs in order to preserve cellular fluidity and integrity and thus will reduce depots of n‐3 LC‐PUFA precursors relative to initial values. Additionally, a large demand for 22:6(n‐3) exists in small juvenile fish for brain and eye development (Bell et al. 2001).
To investigate the effect of different feeding regimens on winter fish survival, weight loss, and FA composition, an outdoor trial in which Coppernose Bluegill were subjected to ambient outdoor water temperatures was conducted.
METHODS
Feed‐trained Coppernose Bluegill fingerlings were obtained from J. M. Malone and Son, Inc. (Lonoke, Arkansas) and transported to the Aquaculture Research Station at the University of Arkansas at Pine Bluff. An experimental static system consisting of 16 individual tanks (~0.378 m3 [~100 gal]) was utilized. Culture water for each tank was pumped from a production pond before initiating the trial. The stocking density used in the trial was 25 fish/tank, and the average individual body weight (±SE) of fish was 2.59 ± 0.19 g.
Four feeding regimens (twice per week [2 × /week]; once per week [1 × /week]; twice per month [2 × /month], and once per month [1 × /month]) were evaluated using four replicate tanks per treatment in a random block design. These feeding regimens reflect those used by different farmers on commercial farms in Arkansas. Aeration was supplied via air stones connected to a regenerative blower, which prevented culture water from freezing. Fish were fed at 1% of body weight with a 36% protein, 6% lipid, commercially formulated floating diet (see Table 1 in Roy et al. 2017). The first feeding for each treatment took place on the day after the fish were stocked. On days during which feed was provided, the fish were fed in the morning.
Initial weight, final weight, survival, weight loss, and specific growth rate (SGR) of Coppernose Bluegill reared for 95 d in outdoor tanks and subjected to four different feeding regimes. Values represent mean ± SD (PSE = pooled SE). Within the survival column, values without a letter in common are significantly different (P < 0.05).
| Feeding regime or statistic | Initial weight (g) | Final weight (g) | Survival (%) | Weight loss (%) | SGR (%/d) |
| 2×/week | 2.60 ± 0.22 | 2.47 ± 0.15 | 63.0 ± 10.0 zy | 4.71 ± 4.33 | −0.054 ± 0.050 |
| 1×/week | 2.62 ± 0.19 | 2.40 ± 0.11 | 78.0 ± 12.0 z | 8.30 ± 6.29 | −0.098 ± 0.078 |
| 2×/month | 2.54 ± 0.16 | 2.29 ± 0.14 | 38.7 ± 18.0 y | 9.75 ± 11.28 | −0.197 ± 0.020 |
| 1×/month | 2.59 ± 0.19 | 2.30 ± 0.17 | 50.7 ± 8.3 y | 10.74 ± 12.01 | −0.133 ± 0.149 |
| P‐value | 0.989 | 0.164 | 0.021 | 0.356 | 0.344 |
| PSE | 0.022 | 0.11 | 14.15 | 4.59 | 0.057 |
Water temperature, dissolved oxygen concentration, and pH were measured daily in each tank with a YSI 556MPS oxygen meter (Yellow Springs Instruments, Inc., Yellow Springs, Ohio). Water samples for analyzing total ammonia nitrogen (TAN) and nitrite nitrogen (NO2−‐N) were taken weekly from one replicate tank per treatment. We analyzed TAN and NO2−‐N with a HACH DR 960 multi‐parameter colorimeter (HACH Co., Loveland, Colorado) using the salicylate method for TAN and the azo‐dye method for NO2−‐N. During the study, average water quality parameters (±SD) were as follows: water temperature was 5.60 ± 4.35°C, dissolved oxygen concentration was 13.0 ± 1.97 mg/L, TAN was 0.37 ± 0.18 mg/L, NO2−‐N was 0.011 ± 0.011 mg/L, and pH was 8.14 ± 0.65.
After 95 d, fish were harvested and the total population in each tank was sampled for individual weights and lengths. Response measures were calculated as follows:
where Wf is the final average individual weight (g) and Wi is the initial individual weight (g).
Lipid analysis
Whole fish from the end of the study were euthanized with tricaine methanesulfonate (MS‐222) at 350 mg/L, frozen, and stored at −20°C before sample preparation for FA analysis. Fish were weighed, lyophilized, and ground, and the ground homogenates were stored at −20°C until lipid extraction according to the method of Folch et al. (1957). Analyses using gas chromatography were carried out according to Roy et al. (2017, 2019b). Briefly, to each extracted lipid tube, 100 μL of a C‐13 solution (Nu‐Chek Prep N‐13A‐A7‐N) in hexane were added and evaporated to dryness under nitrogen using a nitrogen evaporator. Next, 1 mL of 0.5‐N KOH in methanol was added, and tubes were flushed with nitrogen, capped, and placed in a 70°C water bath. After 10 min, the tubes were removed and allowed to cool. Once the sample had cooled to room temperature, 1 mL of 14% boron trifluoride in methanol was added, and tubes were flushed with nitrogen, capped, and placed in a 70°C water bath for 30 min. After cooling, 2 mL of hexane and 2 mL of saturated NaCl solution were added, and the supernatant was pipetted into gas chromatography vials for analysis. A flame ionization gas chromatograph (Varian Model CP3800; Varian, Walnut Creek, California) equipped with a capillary column (100 m, 0.25 mm; Varian CP for FAME CP7420) was used to analyze FA methyl esters (FAMEs), with helium serving as the carrier gas according to Roy et al. (2017). A temperature of 250°C was maintained at the injector port and detector. Identification and quantification of sample FAMEs were accomplished according to established techniques (Roy et al. 2017, 2019a). Peak retention times and area counts were compared to those of serially diluted mixtures of FAME reference standards.
Statistical analysis
Growth and survival data from the outdoor winter trial were analyzed using one‐way ANOVA and the Student–Newman–Keuls multiple range test to determine whether significant differences (P < 0.05) existed among the four winter feeding treatments (Steel and Torrie 1980). All statistical analyses in this experiment were carried out using SAS version 9.4 (SAS Institute, Cary, North Carolina).
Fatty acid profiles from initial (prewinter) fish and postwinter fish fed at four different frequencies were analyzed via stepwise discriminant analysis using the STEPDISC procedure in SAS. Stepwise discriminant analysis was used to optimize the number of FAs in the profile required to discriminate among the following classes: initial fish and fed fish belonging to the 1 × /month, 2 × /month, 2 × /week, and 1 × /week treatments. After the selection of FAs and their abundances by stepwise discriminant analysis, canonical discriminant analysis was used to analyze FAs and their abundances by using the CANDISC procedure in SAS to determine differences among classes (i.e., initial fish and fish from the four feeding regimes) based on FA profiles. It can also be used to ascertain the relative contribution of each FA to class discrimination (Johnson and Wichern 2002). Briefly, n canonical discriminant functions (CDFs) were calculated as linear combinations of the FA abundances within each feeding regime, where n is the number of classes being separated. The numerical results of each CDF (e.g., Can1, Can2, … Cann) defined the central location, or centroid, of that class in n space based on the FAs included in the profile. The CDFs were also calculated in such a way as to maximize the distances between class centroids so that their separation in canonical space indicated the similarity of the FA profiles among classes. To simplify interpretation of the results, we used only the first CDFs for which the eigenvalue was greater than 1 and for which more than 80% of the cumulative variance was explained. The pooled within‐treatment standardized canonical coefficients for each CDF indicated the correlation between FAs and CDFs. The canonical coefficients for each class of FA included in the model were then ordered and used in combination with a univariate ANOVA of those FAs to determine trends in FA composition among initial fish and fish from the four feeding regimes (Hair et al. 2005). All FA abundances were log‐transformed prior to discriminant analyses, and a P‐value of less than 0.05 was considered significant in statistical comparisons.
RESULTS
Growth, Survival, and Body Composition
Since this study was conducted in outdoor tanks, there were large fluctuations in environmental temperatures (Figure 1). Water temperature ranged from 0.10°C to 16.3°C, with substantial warming of the culture water in the last 2 weeks of the experiment. Water quality remained acceptable throughout the trial period. There were no significant differences in final weight, weight loss, and SGR of Coppernose Bluegill (Table 1). Weight loss ranged from 4.71% (2 × /week) to 10.74% (1 × /month), and SGR ranged from −0.054%/d (2 × /week) to −0.133%/d (1 × /month). There were significant differences in survival (P < 0.05) such that fish in the 1 × /week treatment had the highest survival (78%), which was significantly greater (P < 0.05) than the survival of fish that were fed 1 × /month (50.7%) or 2 × /month (38.7%; Table 1). Survival of fish that were fed 2 × /week (63%) was not different from the survival of fish in any other feeding regimen.
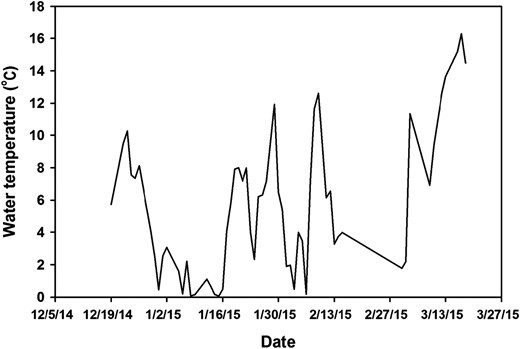
Daily temperatures (°C) recorded during the outdoor feeding trial with Coppernose Bluegill.
Fatty Acid Analysis
Univariate ANOVA revealed that some FAs in initial fish differed (P < 0.05) from those of fish fed at different frequencies at cold temperatures (0–16°C) in outdoor tanks for 95 d (Table 2). Except for the saturate 17:0, however, there were no significant differences in individual FAs among fed fish (Table 3). Levels of 12:0, 14:0, 15:0, or 17:0 fatty acids were higher in initial fish than in postwinter fed fish, whereas the sum of all measured saturates did not differ significantly (P = 0.449) among treatments and ranged from 32.2% to 36.5%. Similarly, the monounsaturated FAs (MUFAs) 16:1 and 18:1(n‐9) were higher in initial fish than in postwinter fed fish but did not differ significantly among fed fish; the sum of all MUFAs also did not differ among fish of any treatment, although there was an indication (P = 0.059) that fish in the 1 × /month treatment contained lower total saturates (23.6%) than initial fish (32.6%; Table 2). In contrast to saturates and monoenes, initial fish contained lower levels of 18:2(n‐6), 20:4, and 22:6(n‐3) than fish fed at different frequencies at cold temperatures, while total PUFAs, n‐3 levels, and n‐6 levels were also lower in initial fish than in postwinter fed fish (Table 2). However, the n‐6/n‐3 FA ratio did not differ significantly (P = 0.710) among initial fish and fed fish.
Mean whole‐body fatty acid composition (%) of initial and fed Coppernose Bluegill reared in outdoor tanks at 0–16°C for 95 d. Treatment designations are as follows: initial (i) = fish acclimated to trial conditions but collected prior to the onset of feeding; 2×/week (8) = fish fed twice per week (i.e., 8×/month); 1×/week (4) = fish fed once per week (i.e., 4×/month); 2×/month (2) = fish fed twice per month; and 1×/month (1) = fish fed once per month. Values are least‐squares means (±SE) of 3–4 replicates/treatment. Within a given row, fatty acid means without a letter in common are significantly different (P ≤ 0.05).
| Fatty acida | Initial (i) | 2×/week (8) | 1×/week (4) | 2×/month (2) | 1×/month (1) | Pr > F |
| 12:0 | 0.31 ± 0.03 z | 0.05 ± 0.04 y | 0.05 ± 0.04 y | 0.10 ± 0.04 y | 0.00 ± 0.05 y | <0.001 |
| 14:0 | 2.78 ± 0.25 z | 1.52 ± 0.31 zy | 1.41 ± 0.31 y | 1.94 ± 0.31 zy | 1.15 ± 0.36 y | 0.011 |
| 15:0 | 1.41 ± 0.12 z | 0.67 ± 0.14 y | 0.63 ± 0.15 y | 0.84 ± 0.15 zy | 0.64 ± 0.17 y | 0.002 |
| 16:0 | 17.68 ± 1.12 | 17.88 ± 1.37 | 17.08 ± 1.37 | 19.83 ± 1.37 | 16.42 ± 1.58 | 0.574 |
| 17:0 | 1.75 ± 0.07 z | 1.44 ± 0.08 y | 1.43 ± 0.08 y | 1.75 ± 0.08 z | 1.60 ± 0.10 zy | 0.021 |
| 18:0 | 6.46 ± 0.22 | 6.90 ± 0.26 | 6.98 ± 0.26 | 6.59 ± 0.26 | 7.39 ± 0.31 | 0.174 |
| 19:0 | 1.01 ± 0.13 | 1.07 ± 0.16 | 1.14 ± 0.16 | 1.09 ± 0.16 | 1.19 ± 0.19 | 0.954 |
| 20:0 | 0.51 ± 0.05 | 0.54 ± 0.06 | 0.56 ± 0.06 | 0.63 ± 0.06 | 0.54 ± 0.07 | 0.714 |
| 21:0 | 2.91 ± 0.49 | 3.03 ± 0.60 | 3.26 ± 0.60 | 3.71 ± 0.60 | 3.26 ± 0.70 | 0.969 |
| Sum of saturates | 34.84 ± 1.48 | 33.10 ± 1.82 | 32.54 ± 1.82 | 36.49 ± 1.82 | 32.18 ± 2.10 | 0.449 |
| 14:1 | 1.33 ± 0.18 | 0.83 ± 0.22 | 0.80 ± 0.22 | 1.14 ± 0.22 | 0.66 ± 0.25 | 0.188 |
| 16:1 | 8.73 ± 0.74 z | 4.94 ± 0.90 zy | 4.81 ± 0.90 y | 5.90 ± 0.90 zy | 3.88 ± 0.90 y | 0.012 |
| 18:1(n‐7) (VAC) | 11.30 ± 0.98 | 10.24 ± 1.20 | 10.49 ± 1.20 | 11.62 ± 1.20 | 8.63 ± 1.38 | 0.492 |
| 18:1(n‐9) | 5.59 ± 0.28 z | 4.34 ± 0.34 zy | 4.16 ± 0.34 y | 4.81 ± 0.34 zy | 4.25 ± 0.39 zy | 0.027 |
| 20:1 | 1.43 ± 0.15 | 1.51 ± 0.19 | 1.59 ± 0.19 | 1.76 ± 0.19 | 1.58 ± 0.22 | 0.825 |
| 22:1 | 1.54 ± 0.30 | 1.65 ± 0.37 | 0.37 ± 0.37 | 0.85 ± 0.37 | 1.07 ± 0.42 | 0.166 |
| 24:1 | 2.63 ± 0.42 | 3.14 ± 0.52 | 2.52 ± 0.52 | 3.22 ± 0.52 | 3.54 ± 0.60 | 0.777 |
| Sum of monoenes | 32.56 ± 1.79 | 26.64 ± 2.19 | 24.74 ± 2.19 | 29.30 ± 2.19 | 23.62 ± 2.53 | 0.059 |
| 18:2(n‐6) (LA) | 5.11 ± 0.42 y | 7.22 ± 0.52 z | 5.89 ± 0.52 zy | 5.59 ± 0.52 zy | 5.23 ± 0.60 zy | 0.044 |
| 18:3(n‐3) (ALA) | 1.47 ± 0.22 | 1.58 ± 0.27 | 1.69 ± 0.27 | 1.26 ± 0.27 | 1.73 ± 0.32 | 0.613 |
| 18:3(n‐6) (GLA) | 2.84 ± 0.18 | 2.25 ± 0.23 | 2.19 ± 0.23 | 2.68 ± 0.23 | 1.99 ± 0.26 | 0.062 |
| 20:2 | 1.31 ± 0.17 | 1.50 ± 0.21 | 1.59 ± 0.21 | 1.68 ± 0.21 | 1.55 ± 0.24 | 0.762 |
| 20:3 (all) | 2.25 ± 0.38 | 2.22 ± 0.47 | 2.23 ± 0.47 | 2.26 ± 0.47 | 3.01 ± 0.54 | 0.750 |
| 20:4 (ARA) | 3.66 ± 0.60 y | 6.26 ± 0.73 z | 7.14 ± 0.73 z | 5.54 ± 0.73 zy | 8.47 ± 0.85 z | <0.001 |
| 20:5(n‐3) (EPA) | 2.56 ± 0.21 | 2.65 ± 0.26 | 2.90 ± 0.26 | 2.70 ± 0.26 | 3.15 ± 0.30 | 0.594 |
| 22:2 | 0.83 ± 0.40 | 0.71 ± 0.49 | 1.13 ± 0.49 | 0.30 ± 0.49 | 1.26 ± 0.57 | 0.718 |
| 22:4 | 2.28 ± 0.35 | 1.85 ± 0.43 | 2.38 ± 0.43 | 0.92 ± 0.43 | 1.49 ± 0.49 | 0.108 |
| 22:5(n‐3) (DPA) | 3.15 ± 0.29 | 3.62 ± 0.37 | 3.75 ± 0.37 | 3.63 ± 0.37 | 4.00 ± 0.41 | 0.523 |
| 22:6(n‐3) (DHA) | 6.36 ± 1.17 y | 9.36 ± 1.43 zy | 10.61 ± 1.43 z | 7.34 ± 1.43 zy | 11.01 ± 1.65 z | 0.018 |
| PUFAs | 31.81 ± 2.30 y | 39.21 ± 2.81 z | 41.50 ± 2.81 z | 33.90 ± 2.81 zy | 42.86 ± 3.25 z | 0.032 |
| Σn‐3 | 13.53 ± 1.57 y | 17.20 ± 1.92 zy | 18.95 ± 1.92 z | 14.92 ± 1.92 zy | 19.88 ± 2.21 z | 0.023 |
| Σn‐6 | 18.28 ± 1.03 y | 22.01 ± 1.26 z | 22.55 ± 1.26 z | 18.98 ± 1.26 zy | 22.99 ± 1.46 z | 0.036 |
| n‐6/n‐3 | 1.35 ± 0.10 | 1.38 ± 0.12 | 1.23 ± 0.12 | 1.31 ± 0.12 | 1.15 ± 0.14 | 0.710 |
Fatty acid classes and abbreviations are as follows: VAC = cis‐vaccenic acid; LA = linoleic acid; ALA = alpha‐linolenic acid; GLA = gamma‐linolenic acid; ARA = arachidonic acid; EPA = eicosapentaenoic acid; DPA = docosapentaenoic acid; DHA = docosahexaenoic acid; PUFAs = polyunsaturated fatty acids; Σn‐3 = sum of n‐3 fatty acids; Σn‐6 = sum of n‐6 fatty acids; and n‐6/n‐3 = ratio of Σn‐6 to Σn‐3.
Class means and fatty acid loading scores of the first two canonical variates (Can1, Can2) for initial versus fed Coppernose Bluegill reared in outdoor tanks at 0–16°C for 95 d. Treatment designations are defined in Table 2.
| Treatment, fatty acid, or statistic | Can1 | Can2 |
| Class means a | ||
| Initial (i) | −6.90 | 0.18 |
| 2×/week (8) | 2.13 | −0.49 |
| 1×/week (4) | 2.04 | −1.11 |
| 2×/month (2) | 2.97 | −0.57 |
| 1×/month (1) | 3.73 | 1.78 |
| Loading scores a | ||
| Fatty acid | ||
| 12:0 | −2.83 | 0.54 |
| 15:0 | −3.10 | −0.12 |
| 18:0 | −2.63 | −0.18 |
| 18:1(n‐7) (VAC)b | 6.74 | −2.67 |
| 18:2 | 1.06 | 2.72 |
| Eigenvalue | 25.41 | 1.24 |
| Variance | 0.93 | 0.05 |
| Cumulative variance | 0.93 | 0.98 |
| R 2 | 0.962 | 0.553 |
Class means locate the center of each group of fatty acid profiles in Figure 1. Loading scores are pooled within‐class standardized canonical coefficients; scores with the largest absolute values correspond to fatty acids with the greatest discriminatory ability.
VAC = cis‐vaccenic acid.
Univariate results were corroborated by multivariate analysis in that FA profiles among fed Coppernose Bluegill could not be distinguished based on feeding frequency. In contrast, FA profiles of initial fish were distinctly different (P < 0.001) from the postwinter FA profiles of fed Coppernose Bluegill according to Wilk’s lambda, Pillai’s trace, the Hotelling–Lawley trace, and Roy’s greatest root. Moreover, canonical discriminant analysis indicated that initial fish could be distinguished from fed fish (Figure 2) by the combination of only five FAs (12:0, 15:0, 18:0, 18:1[n‐7], and 18:2) in two canonical variates (Can1, Can2) that accounted for 98% of the variance (Table 3). In terms of FA loading on the canonical variates, higher levels of 12:0 and 15:0 in initial fish, lower levels of 18:1(n‐7) in fed fish, slightly higher levels of 18:2 in fish fed most frequently (1 × /week or 2 × /week), and slightly higher levels of 18:0 in fish fed least often (1 × /month) were most discriminatory (Table 3).
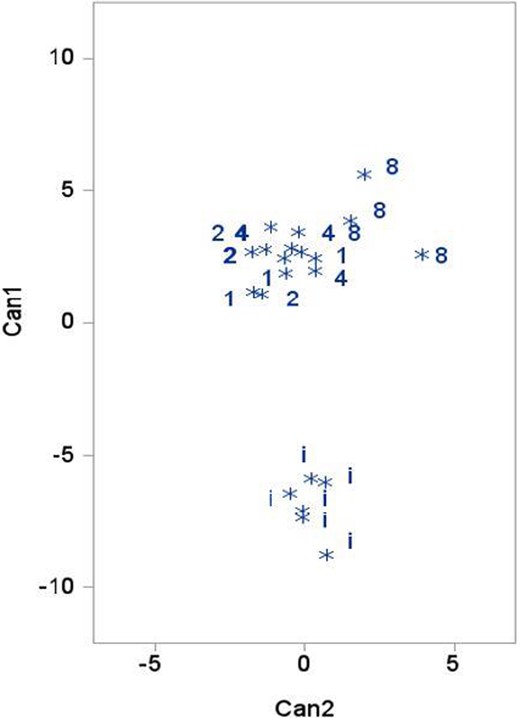
Scatter plot of the first two canonical variates (Can1, Can2) from the analysis of fatty acid profiles in initial and fed Coppernose Bluegill. Treatment designations are defined in Table 2.
DISCUSSION
In temperate climates, fish are subjected to environmental fluctuations, such as changes in water temperature and variation in food availability, as well as physiological changes, such as preparation for spawning, that can result in periods during which the organism consumes little or no nutrients (food). For cultured fish, management strategies can also result in no feeding (starvation) for a period of time or restricted feeding (Shoemaker et al. 2003; Krogdahl and Bakke‐McKellep 2005). This is the first published report on the effects of different feeding regimens on winter growth and FA composition of Coppernose Bluegill. Data from the present study indicated that all feeding regimes evaluated for winter‐fed Coppernose Bluegill resulted in weight loss during the culture period, which is in agreement with previous reports on centrarchids and other fish species cultured in Arkansas (Roy et al. 2017, 2019a, 2019b). However, unlike those reports, in which a constant low water temperature was maintained throughout the study, the present study was conducted in an outdoor setting with fluctuating ambient water temperatures.
Previously, it was postulated that winter mortality in some cultured species of fish might be due to reduced feeding of fish (i.e., a lower amount of feed administered by the producer, a lower feed intake by the fish, or both) and the concomitant adverse changes due to cold, reduced disease resistance and immunity, and changes in essential FAs (Roy et al. 2017). With several published reports on winter feeding regimens for various species of sport fish and baitfish (Roy et al. 2017, 2019a, 2019b), it appears highly likely that for most fish species investigated, this may not be an accurate hypothesis. Despite the weight loss exhibited by the fish, survival percentages were generally high in those studies. However, the studies by Roy et al. (2017, 2019a, 2019b) were carried out in the laboratory under controlled conditions; hence, in the real world (i.e., commercial ponds), there are other factors that could contribute to winter mortality.
In contrast to previous reports, however, fish survival in the present study was adversely affected by some feeding regimens. Coppernose Bluegill that were fed 1 × /week had higher survival percentages than fish that were fed 1 × /month or 2 × /month. Thus, to maintain optimal survival, feeding Coppernose Bluegill at least 1 × /week may be warranted.
Roy et al. (2017) reported no differences in survival (>88.9%) of Bluegill and hybrid Bluegill when cultured at low (7.0–9.2°C) water temperatures, despite fish losing a higher percentage of body weight (12–20%) compared to the data from the present study. This agrees with the findings of Roy et al. (2019a, 2019b) and seems to indicate that the observed winter mortality in some baitfish and sport fish species is not associated with reduced feeding during winter months. In Siberian Sturgeon Acipenser baeri that were grown at 18°C and subjected to one of three feeding regimens (satiation daily, 1% of body weight daily, or starved), fish that were not offered feed lost 21.6% of their body weight and had a reduced condition factor, but their survival rate was similar to that of their fed counterparts (Shirvan et al. 2020).
The FA composition of fish is influenced by numerous factors, including diet, initial body FA levels, water temperature, and duration or frequency of feeding. As all fish lost weight during the present study, it may be presumed that lipids were mobilized to meet the organisms’ energy requirements. Some FAs are utilized more as energy reserves, while others are selectively sequestered for their functionality, especially in critical roles of maintaining membrane fluidity, disease resistance, and immunity (Tacon 1996; Glencross 2009). In the present study, Coppernose Bluegill appeared to have several predominant FAs, including 16:0, 18:0, 16:1, 18:1(n‐7), 18:1(n‐9), 18:2(n‐6), 20:4(n‐6), and 22:6(n‐3).
During periods of starvation or reduced nutrient intake, fish utilize endogenous energy sources from body tissue reserves to obtain the energy required to maintain essential physiological functions. The highest levels of lipid in fish are found during maximum food consumption, while the lowest levels are found during food deprivation or starvation. Furthermore, sexual maturation has been reported to reduce lipid stores as lipids are utilized for gonadal development and/or for energy. Lastly, environmental factors, such as low water temperature, reduce lipid levels in temperate fish species. If temperatures are cold enough, some fish species may enter into a state of low‐temperature dormancy in which their metabolism slows down considerably (Crawshaw 1984).
Numerous physiological and morphological changes can occur in fish during periods of starvation or reduced food intake. It has been reported that a decrease in the hepatosomatic index is associated with starvation in fish (Ali et al. 2003; Peterson and Small 2004; Liu et al. 2011), most likely reflecting the vital role of the liver as a source of energy reserves during periods of reduced nutrient intake. During the winter (cold water temperatures), as feed consumption in fish decreases, hepatic glycogen stores and abdominal fat reserves are mobilized to initially meet the organism's energy requirements.
During periods of reduced winter feeding, whole‐body moisture content often increases due to hydration of the organism’s tissues (Ali et al. 2003; Shirvan et al. 2020), while muscle lipids and proteins are utilized if initial stores do not satisfy energy needs. However, in fish that are either starved or fed restricted rations, the whole‐body protein composition changes less than whole‐body lipid composition (Shearer 1994). This is understandable, as organisms use lipid stores during times of no or reduced food availability to provide energy for maintaining essential physiological processes and to mobilize n‐3 highly unsaturated FAs (HUFAs) for critical functions of cell membranes. Canepa et al. (2016) reported little biological change in the fillet protein of cultured Yellowtail Jack Seriola lalandi from summer to winter; however, there was a reduction in fillet lipid composition between the two seasons, with fish having higher lipid levels in summer compared to winter. Likewise, fillet EPA and DHA levels in Yellowtail Jack were significantly higher in summer than in winter. However, those authors reported that the proportions of saturated FAs, MUFAs, and PUFAs remained similar between seasons.
In the present study, levels of saturated FAs remained similar in all treatments from initial levels; however, MUFA levels decreased. This could be due to the selective β‐oxidation of MUFAs for energy. The MUFA largely responsible for the decrease in this group of FAs was 16:1, while all other MUFAs generally remained at stable levels relative to initial values. It has been reported that OA can serve as a substrate for PUFA synthesis, as well as being utilized for energy (Tocher et al. 1998; Roy et al. 2017); however, OA did not appear to be utilized for these purposes in the present study, as the percentage of OA remained similar among all treatment groups and in the initial fish.
Generally, the FAs in Coppernose Bluegill from all feeding regimens remained stable throughout the study compared to initial values. However, there were three notable exceptions: LA in fish that were fed 2 × /week increased from initial values, and ARA and DHA increased in all treatment groups from initial levels. These results suggest that Coppernose Bluegill sequester PUFAs while maintaining or decreasing saturated FAs and MUFAs during suboptimal (low) water temperatures. This is in agreement with other published reports (Webster et al. 1994; Correa et al. 2015; Ng et al. 2015; Roy et al. 2017, 2019a, 2019b; Liu et al. 2018). Phospholipids are an integral component of cell membranes and can adapt to differences in environmental temperature by altering their FA composition. This modification in FA composition changes the physical nature of cell membranes and their functions, which include maintaining membrane fluidity, permeability, and enzymatic transport and functioning (Bell et al. 2008). Fatty acids in cell membranes regulate protein activity through the carbon atoms in the acyl chain and changes in membrane phase. Because HUFAs allow for greater fluidity, it is important for HUFAs to be available to maintain membrane activity and function during low temperatures. Since fish are poikilothermic organisms, reduced water temperature affects physiological function, and it has been reported that EPA and DHA levels are increased at low temperatures in numerous fish species, including Bluegill and their hybrids (Roy et al. 2017), hybrid crappie (Roy et al. 2019a), and Redear Sunfish (Roy et al. 2019b). Additionally, LA is used to synthesize longer‐chain n‐6 FAs that are utilized to maintain membrane integrity and eicosanoid signaling in cells—both of which are essential functions during periods of coldwater conditions. In some fish species, LA appears to be conserved (Bell et al. 2003; Regost et al. 2003; Ng and Chong 2004); however, in the present study, Coppernose Bluegill that were fed 2 × /week had increased levels of LA compared to initial levels. This may imply that administering feed to this species 2 × /week satisfied basal requirements for LA and that the fish were able to increase stores. Interestingly, a concomitant increase in ARA was observed in fish regardless of dietary regimen. Arachidonic acid is the primary precursor for eicosanoids that function as autocrine hormones, which regulate immune response (Castell et al. 1994; Schmitz and Ecker 2008). However, we did not detect an increase in the n‐6/n‐3 ratio, which is often associated with autoimmune/inflammatory disorders in fish.
Alterations in FA composition in response to environmental conditions do not occur in all tissues or in all fish species. There was no reported correlation between water temperature and n‐3 HUFA content of fillets (Cordier et al. 2002; Yildiz et al. 2006) when the same diet was fed to fish throughout the year. However, while the fillet n‐3 level remained similar among seasons, MUFA levels increased during winter months, when water temperatures were suboptimal (Caballero et al. 2002; Grigorakis et al. 2002; Hamre et al. 2003; Yildiz et al. 2006). Fatty acid composition in gill phospholipids of European Bass Dicentrarchus labrax was unchanged by temperature (Skalli et al. 2006). However, changes were observed in Alewife Alosa pseudoharengus (Schregel 2013). Phospholipids in the liver of Atlantic Salmon Salmo salar had increased HUFA levels when water temperature declined to 5°C, and HUFA levels decreased thereafter. In contrast, HUFAs in the liver phospholipids of steelhead Oncorhynchus mykiss increased as water temperatures decreased to 1°C (Liu et al. 2018). Takeuchi et al. (1987) reported that Common Carp Cyprinus carpio had little change in FA composition of muscle tissue caused by low water temperature, but starvation altered the FA composition. However, since fish are poikilothermic, low water temperature causes temperate fish to reduce feeding activity, so cessation of feeding (starvation) may be inexorably linked to environmental factors. Statistically significant seasonal changes in individual body composition and FA levels in wild female Common Sole were reported, but the changes were not large in magnitude, indicating that wild Common Sole tended to maintain homeostasis with FA composition throughout the year (Gokce et al. 2004).
In conclusion, Coppernose Bluegill lost weight when subjected to winter low water temperatures, and their survival (%) was negatively impacted by lower feeding frequency. Thus, Coppernose Bluegill should be fed more frequently during the winter months to maximize survival. Furthermore, growth and FA composition results from the present study, which utilized fluctuating (ambient) water temperatures during the winter, were similar to the results of studies that used nonfluctuating (set) water temperatures, but generally the overwintering and infrequently fed Coppernose Bluegill preferentially conserved PUFAs. This indicates and validates that the fish species investigated responded similarly to either set or ambient water temperatures; however, there were some species‐specific differences in survival and tissue FA composition. Under the culture conditions that existed for this and other studies carried out with commercially produced centrarchids in Arkansas, it appears that periods of low to no food intake did not increase mortality during winter (cold) water temperatures.
ACKNOWLEDGMENTS
The Arkansas Department of Agriculture and the U.S. Department of Agriculture’s Agricultural Research Service (Project Number 6028‐31630‐008‐00D) provided funds to support this research. We thank Nathan Stone for providing helpful comments on an early version of this manuscript and Sonya Lockett for assistance in finding articles referenced in this paper. Rebecca Roberts assisted with FA analyses. Paxton Harper and Chris Scheiderer provided technical support in sample preparation. The mention of trade names or commercial products in this article is solely for the purpose of providing specific information and does not imply recommendation or endorsement by the U.S. Department of Agriculture. The U.S. Department of Agriculture is an equal opportunity provider and employer. There is no conflict of interest declared in this article.
