


ABSTRACT
We evaluate the socioeconomic impact of treatment with biological and targeted synthetic disease–modifying antirheumatic drugs in Japanese patients with rheumatoid arthritis.
We analysed data retrospectively from the prospective observational CorEvitas RA Japan Registry (March 2016–February 2020). Patients were categorised into paid workers (PWs) and home workers (HWs) and further based on drug classes. We assessed medication persistence, treatment outcomes, health care resource utilisation, and socioeconomic impact over 12 months, including direct (drugs and health care resource utilisation) and indirect (loss of productivity) costs.
Overall, 187 PWs and 114 HWs were identified. Over 12 months, medication persistence was high, treatment outcomes improved, and outpatient visits reduced in both groups. Following treatment initiation, direct costs increased, whereas indirect (loss of productivity) costs decreased in both groups. The unadjusted socioeconomic impact [Japanese yen (JPY)] increased across all drug classes in PWs (range: 29,700–151,700) and HWs (range: −28,700 to 83,000). Adjusted change in monthly socioeconomic impact was JPY 29,700–138,900 for PWs and JPY −28,000 to 92,800 for HWs.
In this study of Japanese patients with rheumatoid arthritis, the socioeconomic burden increased across patient groups and drug classes. The decrease in indirect (loss of productivity) costs partially offset the increase in direct costs.
Introduction
Rheumatoid arthritis (RA) is an autoimmune disorder that poses a substantial disease burden affecting physical function [1], employment, and quality of life [2] of patients. In Japan, the disease-modifying antirheumatic drug (DMARD) methotrexate is recommended as first-line therapy for RA [1, 3]. Patients who are unresponsive to methotrexate may be prescribed conventional synthetic DMARDs (csDMARDs) [3]; biological DMARDS (bDMARDs) such as tocilizumab (TCZ), tumour necrosis factor (TNF) inhibitors (TNFis), and abatacept (ABT); or targeted synthetic DMARDs (tsDMARDs) such as Janus kinase inhibitors (JAKis) [1, 3].
High costs associated with bDMARDs have been previously documented [4, 5]. Direct costs associated with RA also depend on health care resource utilisation (HCRU), which has been demonstrated to increase with disease burden [6, 7]. Although biologic therapy increases medication costs, the total medical costs may potentially be offset by a reduction in certain components of HCRU [8]. Based on data from the Institute of Rheumatology, Rheumatoid Arthritis study, a large observational study involving Japanese patients with RA conducted in 2007 and 2008, the estimated annual direct medical cost (hospitals, pharmacies, or alternative therapies) was Japanese yen (JPY) 262,136 (approximately USD 2050), while the estimated annual non-medical cost (caregiving, transportation, self-help device use, and house modifications) was JPY 61,441 (approximately USD 480) [9]. HCRU also increases with comorbidities such as depression [10]. Since advanced treatment with medications such as bDMARDs and tsDMARDs may improve long-term outcomes and the quality of life of patients [11, 12], it is important to investigate the cost-effectiveness of these treatments. A pharmacoeconomic analysis using data from the Institute of Rheumatology, Rheumatoid Arthritis study in Japan demonstrated the cost-effectiveness of bDMARDs compared with methotrexate in a real-world setting; the incremental cost-effectiveness ratio for bDMARDs, in sequence with TCZ, was USD 38,179, which is below the cost-effective threshold of USD 50,000 [13]. While evaluating the total socioeconomic burden imposed by advanced RA therapy, it is critical to consider the indirect costs incurred by patients as a consequence of loss of productivity. The cost associated with loss of productivity can be calculated using measures such as work productivity and activity impairment (WPAI) combined with wage information [14]. An indirect monthly cost of USD 281 (annual cost of approximately USD 3370) due to the loss of productive days has been reported in the USA [15], and an annual total cost for loss of productivity due to RA ranging from Euro (EUR) 2322 to EUR 6479 (approximately USD 2490–6940) per patient has been reported in the Netherlands [16]. Treatment with bDMARDs, however, has been demonstrated to improve productivity. Specifically, two studies from Japan, the Adalimumab Non-interventional Trial for Up-verified Effects and Utility (ANOUVEAU) study [14] and the FIRST ACT-SC study [17], demonstrated improved measures of work productivity following treatment initiation with adalimumab and subcutaneous TCZ, respectively, among individuals with different employment types such as paid workers (PWs) and homemakers.
RA poses a notable socioeconomic burden on patients. While several treatment options exist, which have improved patient outcomes and quality of life [11, 12], a substantial component of the cost incurred is due to expensive treatment medications. Few studies have demonstrated the overall socioeconomic impact of treatment with bDMARDs or tsDMARDs in patients with RA, including both direct and indirect costs, in a real-world setting in Japan.
In this study, using data from the CorEvitas RA Japan Registry (formerly, the Corrona RA Japan Registry) [18], we evaluated the socioeconomic impact, both direct and indirect (loss of productivity) costs, in patients with RA initiating treatment with bDMARDs and tsDMARDs in a real-world setting.
Materials and methods
Study design
This was a retrospective observational study (UMIN Clinical Trials Registry; UMIN000044713) that utilised the prospective CorEvitas RA Japan Registry to evaluate the socioeconomic impact, HCRU, work productivity, and treatment outcomes in Japanese patients with RA. De-identified data for the initiators of bDMARDs and tsDMARDs from the registry between March 2016 and February 2020 were analysed.
Data source
The CorEvitas RA Japan Registry is a prospective, multicentre, observational disease-based registry launched in 2015 containing systematically collected real-world data. A total of 176 investigators from 47 sites across 26 prefectures in Japan had been involved in the registry as of February 2020. The registry does not impose strict eligibility criteria, unlike for randomised controlled trials. The data include clinician- and patient-reported outcomes (PROs) and comprehensive information on drug history and current treatments from a cohort of patients enrolled by participating rheumatologists [18]. Additionally, the data contain enrolment and 6-month follow-up information from patients with RA and their treating rheumatologists collected via the CorEvitas RA Japan questionnaires. Captured data fields include patient demographics, medical history, disease characteristics, laboratory results, comorbidities, hospitalisations, and safety events [18].
Study ethics
All participating investigators were required to obtain full board approval by their governing ethics committee for conducting research involving human subjects. Documentation of approval was submitted to the sponsor prior to initiating any study procedure. All registry subjects were required to provide written informed consent prior to participating.
Patients
The inclusion criteria for the CorEvitas RA Japan Registry are as follows: (1) patients must have been diagnosed with RA per the 1987 American College of Rheumatology (ACR) or the 2010 ACR/European League Against Rheumatism classification criteria; (2) patients must have been ≥18 years of age at enrolment; (3) patients must have been able to provide written informed consent; and (4) patients must have been prescribed or switching to an eligible medication for the first time ever at the enrolment visit. A history of concomitant treatment with other eligible medications does not exclude a patient from enrolment. From the patients registered in the CorEvitas RA Japan Registry, we included those who had data from a baseline (index) visit, defined as the visit linked to treatment initiation, and 6- and 12-month follow-up visits between March 2016 and February 2020. Patients were categorised as biologic-naïve initiators of TCZ; TNFi, including infliximab, etanercept, adalimumab, certolizumab pegol, and golimumab; the cytotoxic T-lymphocyte-associated protein 4, ABT; and JAKis, including tofacitinib and baricitinib. We developed an analysis plan that included JAKi as a study group; however, because the number of patients initiating JAKi was low, we excluded this group from further analysis. Biosimilars approved in Japan, although available during the study period, were excluded since the number of patients using biosimilars before the start of the study was small. Individuals paid by a company or family business were classified as PWs, whereas those performing a central role in the household were classified as home workers (HWs) [17].
Outcomes
Patient demographics and clinical characteristics at baseline included demographics and socioeconomic characteristics [age, gender, body mass index (BMI), and educational qualifications]; disease activity characteristics {RA duration, seropositivity, Clinical Disease Activity Index [CDAI], tender joint count-28, swollen joint count-28, physician global assessment [visual analogue scale (VAS), 0–100], Disease Activity Score-28 erythrocyte sedimentation rate [DAS28-ESR]}; treatment characteristics (concomitant therapy); PROs [patient global assessment (VAS, 0–100), fatigue (VAS, 0–100), pain (VAS, 0–100), and Japanese version of the Health Assessment Questionnaire Disability Index (J-HAQ-DI)]; history of comorbidities; and WPAI outcomes [presenteeism, absenteeism, overall work impairment (OWI) and activity impairment (AI) for the PW group, and only AI for the HW group]. HCRU outcomes included the number of outpatient visits, emergency room (ER) visits, hospitalisations, outpatient surgeries/procedures, and non-Western medical encounters and were computed based on data accrued from 6 months prior up to the baseline visit.
Outcomes at follow-up visits included medication persistence, treatment effectiveness, and the total socioeconomic impact. Medication persistence was computed as the percentage of patients remaining on index medication at the 6- and 12-month follow-up visits. Treatment effectiveness was evaluated in terms of the change in CDAI, DAS28-ESR, WPAI, J-HAQ-DI, pain and fatigue scores, and HCRU from baseline to the 6- and 12-month follow-up visits. Total monthly socioeconomic impact, reported in JPY, was computed as the sum of direct (drug and HCRU-related costs) and indirect (loss of productivity) costs.
Changes in the total socioeconomic impact from baseline to 12 months for all drug classes were evaluated. All comparisons in this study were made using the TNFi group as a whole and not individual TNFi. Total monthly drug costs for RA-related therapies were calculated based on single-dose drug costs [19], prescribed dosage, and frequency of administration. The drug prices listed are as of March 2022. For patients taking concomitant therapy with csDMARDs, the total drug cost included the cost of concomitant therapy. In Japan, the proportion of generic and branded csDMARDs prescribed is 78 and 22% (rounded to the nearest integer), respectively [20]. Thus, the cost associated with csDMARDs was computed as follows:
HCRU costs were estimated based on the previous literature as follows: HCRU costs at each visit are calculated for the preceding month based on data from 6 months prior to the visit multiplied by the estimated cost per visit and divided by 6. The average outpatient cost per visit was computed as the total outpatient cost (excluding RA-related medication and surgery/procedure costs) divided by the average number of outpatient visits [7], resulting in USD 53.5 per visit. The average daily hospitalisation cost was computed as the total hospitalisation cost divided by the number of hospitalisations plus re-hospitalisations and the length of hospital stay, resulting in a daily cost of USD 178 [21]. For this study, USD was converted to JPY at the exchange rate as on the study cut-off date (28 February 2020) and was set to 1 USD = 106.76 JPY. Unit cost for each resource (outpatient visits and hospitalisations) was multiplied by the number of resource utilisations observed in this study. Costs associated with ER visits and outpatient surgeries/procedures were not calculated as the recorded numbers were negligible (Supplementary Table S1). In addition, costs associated with non-Western medical encounters were not calculated due to difficulties in calculating unit costs. Monthly indirect costs included costs associated with the loss of productivity. For the PW group, the indirect (loss of productivity) cost was computed as OWI multiplied by the estimated monthly wage (including monthly bonus) [22]. For the HW group, the indirect (loss of productivity) cost was computed as AI multiplied by the estimated monthly wage, calculated as the hypothetical value of unpaid work by an unemployed married individual based on gender and marital status [23].
Statistical analysis
All analyses were stratified by drug class (TCZ, TNFi, and ABT) and work status (PW and HW). Categorical variables under patient demographics and clinical characteristics are reported as counts (n) and frequencies (%), and continuous variables are reported using mean and standard deviation (SD). Unadjusted change in outcomes (including socioeconomic impact/costs) from baseline was computed by subtracting the outcome measurement at baseline from that at each follow-up visit and is reported using mean and 95% confidence interval (CI). Covariate-adjusted change in outcomes was computed using the unadjusted change as a dependent variable and age, gender, BMI, duration of RA, physician global assessment scores, patient global assessment scores, and baseline value of the outcome measurements as covariates in a multiple linear regression model. All costs are reported using mean and 95% CI. Regression modelling was conducted after excluding patients with missing data. All analyses were performed using R software, version 4.1.1.
Results
Patient disposition
Of the 1803 patients with RA identified in the registry, 1478 had initiated a treatment with the drugs of interest; of these, 30 patients had missing baseline visit information, and 498 had been previously treated with biologics, resulting in 950 patients being eligible for the study (Figure 1). Of the eligible patients, 537 had data for the baseline and 6- and 12-month follow-up visits. Excluding patients who were neither PWs nor HWs and those who switched work status, 301 patients were assigned to the study cohort. Of these, 187 patients were PWs and 114 were HWs, including initiators of JAKi (Figure 1).
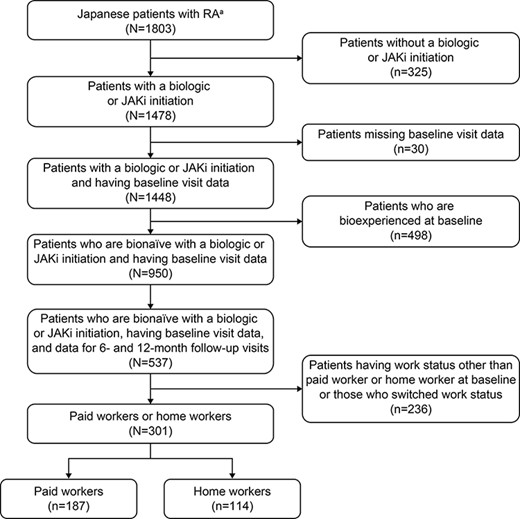
Patient disposition.
Patient demographics and clinical characteristics at baseline
In the total population, 55.0% of the initiators of TCZ, 68.5% of TNFi, and 47.2% of ABT belonged to the PW group. HWs were, on average, older than PWs (mean age range: PWs, 50.4–57.0 years and HWs, 64.0–71.3 years; Table 1). In the PW group, a majority of patients were female (range: 51.5–80.0%), with most patients having obtained a college degree (Table 1). All patients in the HW group were female. The most common comorbidity among patients across all drug classes was hypertension (Table 1). The mean duration of RA before treatment initiation was between 4.6 and 7.7 years in PWs and between 7.5 and 14.9 years in HWs; all patients had moderate to high mean CDAI (range: 19.2–25.2). For concomitant therapy, a majority of patients received methotrexate (range: PW, 68.0–90.1% and HW, 44.4–84.3%); fewer patients received prednisone (range: PW, 24.0–36.4% and HW, 27.5–37.0%) and other csDMARDs (PW, 25.2–51.5% and HW, 33.3–50.0%). In terms of WPAI at baseline, in the PW group, the mean (SD) OWI at baseline was the highest for patients receiving TCZ [TCZ, 15.9 (23.6); TNFi, 7.9 (16.1); and ABT, 10.2 (18.5)]. AI at the time of treatment initiation was generally higher in the HW group than in the PW group. In terms of HCRU at baseline, in both groups, the numbers of ER visits and outpatient surgeries/procedures were very low (Table 1). Among the initiators of TNFi, adalimumab and golimumab were the most common in the PW and HW groups, respectively (Table 2).
Patient demographics and clinical characteristics at baseline among PWs and HWs.
| PW | HW | |||||
|---|---|---|---|---|---|---|
| TCZ (n = 33) | TNFi (n = 111) | ABT (n = 25) | TCZ (n = 27) | TNFi (n = 51) | ABT (n = 28) | |
| Demographics and socioeconomic characteristics | ||||||
| Age, years, mean (SD) | 53.7 (8.5) | 50.4 (12.9) | 57.0 (11.0) | 65.3 (6.8) | 64.0 (13.1) | 71.3 (9.2) |
| Gender,a female, n (%) | 17 (51.5) | 86 (77.5) | 20 (80.0) | – | – | – |
| College graduate,a n (%) | 99 (89.2) | 24 (96.0) | 26 (96.3) | – | – | |
| BMI, kg/m2, mean (SD) | 24.7 (5.6) | 21.8 (3.3) | 22.4 (3.0) | 21.9 (4.1) | 22.0 (2.9) | 21.6 (4.4) |
| Comorbidities | ||||||
| Cancer, n (%) | 2 (6.1) | 2 (1.8) | 1 (4.0) | 5 (18.5) | 5 (9.8) | 5 (17.9) |
| Serious infection, n (%) | 2 (6.1) | 5 (4.5) | 3 (12.0) | 4 (14.8) | 4 (7.8) | 6 (21.4) |
| Herpes zoster, n (%) | 4 (12.1) | 11 (9.9) | 1 (4.0) | 2 (7.4) | 5 (9.8) | 5 (17.9) |
| Cardio/cerebrovascular disease, n (%) | 1 (3.0) | 4 (3.6) | 2 (8.0) | 2 (7.4) | 9 (17.6) | 3 (10.7) |
| Hypertension, n (%) | 5 (15.2) | 16 (14.4) | 8 (32.0) | 12 (44.4) | 16 (31.4) | 16 (57.1) |
| Hyperlipidaemia, n (%) | 3 (9.1) | 10 (9.0) | 6 (24.0) | 6 (22.2) | 12 (23.5) | 8 (28.6) |
| Diabetes mellitus, n (%) | 5 (15.2) | 1 (0.9) | 5 (20.0) | 1 (3.7) | 5 (9.8) | 5 (17.9) |
| Disease activity characteristics | ||||||
| RA duration, years, mean (SD) | 7.7 (8.8) | 4.7 (5.7) | 4.6 (5.0) | 10.4 (10.3) | 7.5 (8.5) | 14.9 (13.7) |
| Seropositive, n (%) | 27 (87.1) | 81 (78.6) | 19 (79.2) | 25 (92.6) | 36 (76.6) | 23 (85.2) |
| CDAI, mean (SD) | 19.2 (13.3) | 21.3 (11.5) | 19.9 (10.7) | 22.2 (9.7) | 25.2 (12.5) | 19.8 (8.7) |
| DAS28-ESR, mean (SD) | 4.5 (1.3) | 4.5 (1.3) | 4.8 (1.5) | 5.3 (1.0) | 5.3 (1.1) | 4.8 (1.2) |
| Tender joint count-28, mean (SD) | 4.9 (6.3) | 6.1 (5.3) | 5.9 (4.3) | 6.0 (3.9) | 8.5 (7.5) | 5.7 (5.6) |
| Swollen joint count-28, mean (SD) | 5.5 (5.3) | 5.8 (4.6) | 5.4 (4.0) | 6.3 (4.7) | 6.4 (4.4) | 5.2 (3.1) |
| Physician global assessment, VAS range 0–100, mean (SD) | 45.1 (22.4) | 47.5 (23.0) | 39.0 (19.4) | 50.3 (21.4) | 50.7 (25.0) | 43.4 (17.5) |
| Treatment characteristics | ||||||
| Concomitant therapy, n (%) | ||||||
| Methotrexate | 23 (69.7) | 100 (90.1) | 17 (68.0) | 12 (44.4) | 43 (84.3) | 15 (53.6) |
| Prednisone | 12 (36.4) | 29 (26.1) | 6 (24.0) | 10 (37.0) | 14 (27.5) | 9 (32.1) |
| Other csDMARDs | 17 (51.5) | 28 (25.2) | 8 (32.0) | 9 (33.3) | 20 (39.2) | 14 (50.0) |
| Patient-reported measures | ||||||
| Patient global assessment, VAS range 0–100, mean (SD) | 43.5 (25.0) | 44.2 (24.8) | 47.2 (25.8) | 52.8 (25.1) | 49.4 (25.0) | 40.3 (21.4) |
| Patient fatigue, VAS range 0–100, mean (SD) | 39.0 (25.2) | 38.9 (27.1) | 52.2 (26.9) | 47.7 (26.2) | 43.3 (27.8) | 40.7 (27.6) |
| Patient pain, VAS range 0–100, mean (SD) | 43.1 (25.0) | 47.7 (26.1) | 49.6 (25.3) | 53.2 (29.7) | 48.8 (24.4) | 43.3 (25.3) |
| J-HAQ-DI, mean (SD) | 0.9 (0.6) | 0.6 (0.6) | 0.8 (0.8) | 1.1 (0.7) | 1.1 (0.7) | 1.3 (0.8) |
| WPAI | ||||||
| Absenteeism,b %, mean (SD) | 15.6 (28.7) | 4.6 (16.2) | 11.5 (28.1) | – | – | – |
| Absenteeism,b 0%, n (%) | 19 (65.5) | 83 (86.5) | 15 (78.9) | – | – | – |
| Absenteeism,b >0%, n (%) | 10 (34.5) | 13 (13.5) | 4 (21.1) | – | – | – |
| Presenteeism,b %, mean (SD) | 38.3 (30.1) | 35.1 (27.8) | 42.1 (29.8) | – | – | – |
| OWI,b %, mean (SD) | 15.9 (23.6) | 7.9 (16.1) | 10.2 (18.5) | – | – | – |
| AI, %, mean (SD) | 46.5 (33.0) | 39.3 (27.2) | 42.1 (29.5) | 55.4 (29.0) | 47.4 (27.6) | 53.5 (31.0) |
| HCRU | ||||||
| Outpatient visits, mean (SD) | 5.1 (4.0) | 5.2 (3.6) | 7.1 (4.3) | 9.1 (14.6) | 5.6 (4.2) | 5.5 (3.7) |
| ER visits, mean (SD) | 0.0 (0.2) | 0.0 (0.1) | 0.0 (0.0) | 0.1 (0.6) | 0.1 (0.3) | 0.0 (0.2) |
| Hospitalisations, mean (SD) | 0.3 (0.5) | 0.1 (0.4) | 0.3 (0.5) | 0.9 (3.5) | 0.4 (0.7) | 0.3 (0.4) |
| Outpatient surgeries or procedures, mean (SD) | 0.2 (0.4) | 0.1 (0.4) | 0.0 (0.0) | 0.0 (0.2) | 0.1 (0.5) | 0.0 (0.0) |
| Non-Western medical encounters, mean (SD) | 1.6 (3.3) | 0.5 (2.0) | 0.2 (0.6) | 3.7 (9.3) | 4.2 (13.1) | 1.6 (5.2) |
To reduce the risk of patient identification, identifiable characteristics with less than five patients assigned are not provided in the CorEvitas RA Japan Registry.
Since HWs do not work outside of the home, values for this field for HWs are not available.
n: number of patients.
TNFi initiated in the PW and HW groups.
| TNFi, n (%) | PW (n = 111) | HW (n = 51) |
|---|---|---|
| Certolizumab pegol | 27 (24.3) | 11 (21.6) |
| Etanercept | 13 (11.7) | 9 (17.6) |
| Adalimumab | 37 (33.3) | 10 (19.6) |
| Infliximab | 10 (9.0) | 7 (13.7) |
| Golimumab | 24 (21.6) | 14 (27.5) |
| TNFi, n (%) | PW (n = 111) | HW (n = 51) |
|---|---|---|
| Certolizumab pegol | 27 (24.3) | 11 (21.6) |
| Etanercept | 13 (11.7) | 9 (17.6) |
| Adalimumab | 37 (33.3) | 10 (19.6) |
| Infliximab | 10 (9.0) | 7 (13.7) |
| Golimumab | 24 (21.6) | 14 (27.5) |
n: number of patients.
Medication persistence
In both PWs and HWs, the proportion of patients with medication persistence over 6 and 12 months was high across all drug classes. At 12 months, medication persistence ranged from 82.9% to 93.5% in the PW group and from 84.1% to 89.3% in the HW group (Table 3).
Medication persistence among PWs and HWs 12 months after treatment initiation.
| PW | HW | |||||
|---|---|---|---|---|---|---|
| Persistence, n (%) | TCZ | TNFi | ABT | TCZ | TNFi | ABT |
| 6 months | 32 (97.0) | 100 (90.1) | 24 (96.0) | 25 (92.6) | 44 (86.3) | 27 (96.4) |
| 12 months | 29 (93.5) | 92 (82.9) | 23 (85.2) | 25 (89.3) | 37 (84.1) | 20 (87.0) |
| PW | HW | |||||
|---|---|---|---|---|---|---|
| Persistence, n (%) | TCZ | TNFi | ABT | TCZ | TNFi | ABT |
| 6 months | 32 (97.0) | 100 (90.1) | 24 (96.0) | 25 (92.6) | 44 (86.3) | 27 (96.4) |
| 12 months | 29 (93.5) | 92 (82.9) | 23 (85.2) | 25 (89.3) | 37 (84.1) | 20 (87.0) |
n: number of patients.
Improvements in outcomes upon treatment initiation
Using a multiple linear regression model, the change in treatment outcomes was adjusted for the covariates age, gender, BMI, duration of RA, physician and patient global assessment scores, and baseline value of the outcome measurements. Over 12 months, adjusted mean (95% CI) CDAI improved across all drug classes in both the PW [TCZ, −16.0 (−18.7 to −13.2); TNFi, −15.9 (−17.4 to −14.4); and ABT, −12.8 (−15.8 to −9.8)] and HW [TCZ, −15.1 (−18.2 to −12.0); TNFi, −14.7 (−17.0 to −12.3); and ABT, −12.0 (−15.1 to −8.9)] groups (Table 4). In the PW group, 12 months after treatment initiation, all patients across all drug classes demonstrated overall work improvement [adjusted mean (95% CI) OWI: TCZ, −4.6 (−8.3 to −0.8); TNFi, −4.6 (−6.5 to −2.7); and ABT, −7.2 (−12.0 to −2.3); Table 4]. Similarly, patients in the HW group across all drug classes demonstrated activity improvement [adjusted mean (95% CI): TCZ, −17.5 (−29.6 to −5.3); TNFi, −20.5 (−29.8 to −11.2); and ABT, −24.2 (−37.8 to −10.7); Table 4]. Other adjusted mean outcomes, such as changes in the DAS28-ESR scores, J-HAQ-DI scores, and PROs (pain and fatigue), improved across all drug classes in the PW and HW groups (Table 4). Similar trends were observed in all outcomes measured at the 6-month follow-up visit (Supplementary Table S2).
Change in treatment outcomes from baseline to 12 months after treatment initiation among PWs and HWs.
| TCZ | TNFi | ABT | |||||||
|---|---|---|---|---|---|---|---|---|---|
| n | Unadjusted | Adjusted | n | Unadjusted | Adjusted | n | Unadjusted | Adjusted | |
| Mean (95% CI) | Mean (95% CI) | Mean (95% CI) | |||||||
| PW | |||||||||
| CDAI | 30 | −14.1 (−18.5, −9.8) | −16.0 (−18.7, −13.2) | 91 | −16.5 (−18.9, −14.0) | −15.9 (−17.4, −14.4) | 24 | −12.4 (−17.2, −7.6) | −12.8 (−15.8, −9.8) |
| DAS28-ESR | 25 | −2.5 (−3.0, −1.9) | −2.6 (−3.1, −2.1) | 78 | −2.2 (−2.6, −1.9) | −2.3 (−2.5, −2. 0) | 20 | −1.8 (−2.4, −1.2) | −1.5 (−2.1, −1. 0) |
| J-HAQ-DI | 32 | −0.4 (−0.6, −0.2) | −0.4 (−0.6, −0.3) | 96 | −0.4 (−0.5, −0.3) | −0.4 (−0.5, −0.3) | 25 | −0.3 (−0.5, −0. 1) | −0.3 (−0.4, −0.1) |
| Pain | 31 | −19.4 (−29.9, −8.9) | −23.8 (−31.4, −16.1) | 95 | −31.2 (−37.1, −25.2) | −31.2 (−35.4, −27.1) | 25 | −28.1 (−39.8, −16.4) | −28.3 (−36.4, −20.1) |
| Fatigue | 32 | −12.5 (−22.1, −2.8) | −16.2 (−25.4, −7.0) | 94 | −12.8 (−18.4, −7.2) | −13.3 (−18.5, −8. 1) | 24 | −19.3 (−30.5, −8.2) | −14.7 (−25.3, −4.1) |
| WPAIa | |||||||||
| Absenteeism | 23 | −12.9 (−20.8, −5.1) | −4.5 (−8.0, −0.9) | 76 | −1.2 (−5.5, 3.1) | −4.1 (−6.0, −2.2) | 13 | −11.0 (−21.5, −0.6) | −6.7 (−11.2, −2.1) |
| Presenteeism | 25 | −18.0 (−29.4, −6.6) | −18.3 (−26.6, −9.9) | 84 | −18.3 (−24.6, −12.1) | −20.7 (−25.1, −16.3) | 22 | −25.9 (−38.1, −13.7) | −22.6 (−31.3, −13.9) |
| OWI | 22 | −10.3 (−16.7, −3.9) | −4.6 (−8.3, −0.8) | 75 | −2.9 (−6.4, 0.6) | −4.6 (−6.5, −2.7) | 12 | −6.8 (−15.4, 1.9) | −7.2 (−12.0, −2.3) |
| AI | 29 | −23.5 (−34.6, −12.3) | −20.2 (−28.1, −12.3) | 91 | −23.2 (−29.5, −16.9) | −26.1 (−30.4, −21.7) | 23 | −24.4 (−36.9, −11.8) | −25.9 (−34.5, −17.2) |
| HW | |||||||||
| CDAI | 24 | −15.6 (−19.7, −11.5) | −15.1 (−18.2, −12.0) | 42 | −16.4 (−19.5, −13.3) | −14.7 (−17.0, −12.3) | 26 | −9.3 (−13.3, −5.4) | −12.0 (−15.1, −8.9) |
| DAS28-ESR | 22 | −3.0 (−3.6, −2.4) | −2.8 (−3.3, −2.3) | 36 | −2.4 (−2.8, −1.9) | −2.2 (−2.6, −1.9) | 18 | −1.0 (−1.7, −0.4) | −1.5 (−2.0, −0.9) |
| J-HAQ-DI | 25 | −0.5 (−0.7, −0.2) | −0.5 (−0.7, −0.3) | 44 | −0.5 (−0.7, −0.3) | −0.5 (−0.6, −0.3) | 26 | −0.1 (−0.4, 0.1) | −0.1 (−0.3, 0.1) |
| Pain | 25 | −31.6 (−42.6, −20.6) | −29.2 (−38.4, −19.9) | 44 | −24.6 (−32.9, −16.4) | −22.5 (−29.5, −15.4) | 26 | −10.8 (−21.5, 0.0) | −15.3 (−24.9, −5.7) |
| Fatigue | 25 | −16.6 (−28.3, −4.9) | −14.6 (−23.3, −5.9) | 42 | −19.8 (−28.8, −10.7) | −16.8 (−23.6, −10.0) | 26 | −7.1 (−18.6, 4.4) | −13.9 (−22.9, −4.9) |
| WPAIa | |||||||||
| AI | 23 | −20.9 (−36.5, −5.2) | −17.5 (−29.6, −5.3) | 41 | −20.0 (−31.7, −8.3) | −20.5 (−29.8, −11.2) | 21 | −22.4 (−38.7, −6.0) | −24.2 (−37.8, −10.7) |
WPAI absenteeism, presenteeism, and OWI are not applicable to HWs and, therefore, not available.
n: number of patients.
HCRU improvement after treatment initiation
Over 12 months, the adjusted number of mean outpatient visits reduced across most drug classes in the PW and HW groups (Supplementary Table S1). At the 12-month follow-up visit, the average number of hospitalisations decreased marginally from baseline; the change in the adjusted average number of hospitalisations ranged from −0.19 to −0.09 in the PW group and from −0.46 to −0.42 in the HW group. The numbers of ER visits and outpatient surgeries/procedures at the 12-month follow-up visit were low and comparable with those observed at the baseline visit (Supplementary Table S1). The number of non-Western medical encounters demonstrated a decreasing trend in both the PW and HW groups (Supplementary Table S1).
Socioeconomic impact of RA
Across all drug classes, the greatest unadjusted total socioeconomic impact at baseline was observed for patients who were to initiate treatment with TCZ [mean (95% CI): PW, JPY 92,200 (65,300–119,100) and HW, JPY 153,400 (121,300–185,500)]. Over the 12 months after treatment initiation, the total unadjusted socioeconomic impact increased for both groups (Figure 2). Unadjusted drug costs increased and HCRU-related costs decreased marginally for both groups and across all drug classes (Figure 2). The mean unadjusted cost associated with the loss of productivity decreased for patients in the HW (mean range, magnitude of decrease: JPY 81,600–105,800) and PW (mean range, magnitude of decrease: JPY 11,200–50,400) groups.
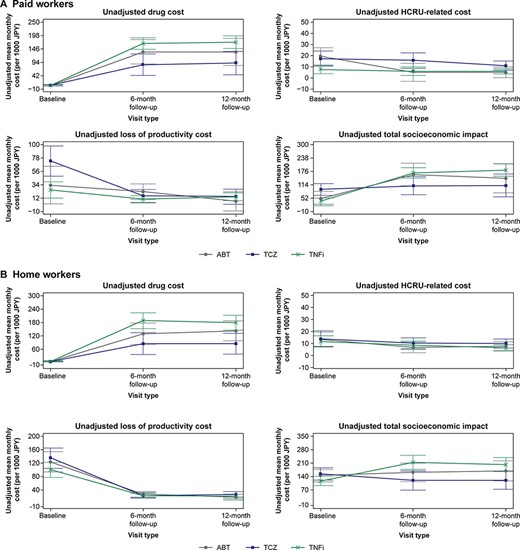
Unadjusted costs associated with RA in (A) paid workers and (B) home workers.
Upon adjusting for covariates (age, gender, BMI, duration of RA, physician and patient global assessment scores, and baseline value of outcome measurements), a net increase in the monthly socioeconomic burden was observed across all drug classes in both the PW and HW groups. In the PW group, the adjusted mean (95% CI) monthly increase in the total cost ranged from JPY 29,700 (−33,800 to 93,100) in patients receiving TCZ to JPY 138,900 (99,700–178,200) in patients receiving TNFi (Figure 3A). In the HW group, the adjusted mean (95% CI) monthly socioeconomic burden decreased by JPY 28,000 (−86,600 to 30,600) in patients receiving TCZ; however, an adjusted overall mean (95% CI) increase in the socioeconomic burden ranging from JPY 22,400 (−47,600 to 92,400] to JPY 92,800 (45,000–140,600) was observed across other drug classes (Figure 3B).
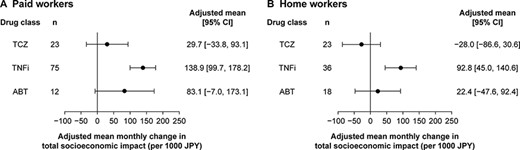
Adjusted mean total socioeconomic impact associated with RA in (A) paid workers and (B) home workers.
In a post hoc analysis, the percentage of patients for whom the socioeconomic burden decreased from baseline to 12 months after treatment initiation (<JPY 0) was calculated. In the HW group, 30.0–60.0% of the patients experienced a decrease in the total socioeconomic burden across all drug classes (TCZ, 60.0%; TNFi, 38.1%; and ABT, 30.0%). In the PW group, only 16.7 and 19.8% of patients initiating TCZ and TNFi, respectively, experienced a decrease in the total socioeconomic burden (Supplementary Table S3).
Discussion
This study evaluated both direct and indirect (loss of productivity) costs from a socioeconomic perspective in Japanese patients with RA (categorised into PWs and HWs) initiating advanced therapy with bDMARDs and tsDMARDs, especially in a real-world setting. Across both PWs and HWs, medication persistence over 12 months was high and in the range of 82.9–93.5%. Patients in both groups and across all drug classes demonstrated decreased disease activity and improved PROs and work productivity 12 months after treatment initiation compared with those at baseline. For HCRU, outpatient visits reduced over 12 months, while the numbers of ER visits and outpatient surgeries/procedures remained largely unchanged. During the 12 months after the initiation of advanced therapy for RA, there was a net increase in the total socioeconomic cost burden. Specifically, for direct costs, there was an increase in drug costs, whereas HCRU costs decreased marginally. On the other hand, indirect costs associated with the loss of productivity decreased in both PWs and HWs during the 12 months after the initiation of advanced therapy.
The medication persistence with bDMARDs observed in this study is consistent with that reported in previous real-world studies from Japan [7, 24]. Disease activity and associated outcomes such as CDAI improved from baseline to 12 months after treatment initiation with both bDMARDs and tsDMARDs, which is consistent with findings from other studies [25, 26].
Compared with HCRU-related costs, drug costs were higher in this study population. The increase in drug costs from baseline is expected since these patients newly initiated their advanced therapy for RA. Costs associated with RA medications, especially for bDMARDs and tsDMARDs, have been shown to be high. For example, a retrospective claims database analysis in the USA showed that the mean 1-year RA-related total cost per effectively treated patient for bDMARDs as either first- or second-line treatment ranged between USD 93,333 and 236,743 [27]. While the cost for bDMARDs and tsDMARDs was high, our results suggest that their use may have been associated with a marginal decrease in HCRU. Particularly, 12 months after treatment initiation, the number of outpatient visits reduced and the number of hospitalisations decreased marginally, whereas the numbers of ER visits and outpatient surgeries/procedures were low and remained unchanged across PWs and HWs. Consistent with this, HCRU-related costs decreased marginally. A study using a national health plan database in the USA showed that compared with patients who did not receive DMARDs (including csDMARDs, bDMARDs, and tsDMARDs) for the treatment of RA, those who received DMARDs reported 14.5% lesser hospitalisations and 18.0% lesser emergency visits [28]. Similarly, a study from Taiwan demonstrated increased RA-related outpatient visits and reduced length of hospitalisation after 1 year of initiating treatment with bDMARD TNF-α antagonists [8].
Our results indicate that at baseline, prior to treatment initiation, the monthly cost associated with loss of productivity ranged from JPY 25,700 (approximately USD 200) to JPY 135,100 (approximately USD 1050) in both the PW and HW groups and across all drug classes. This is consistent with the findings of a study conducted in the USA demonstrating a monthly indirect cost of USD 281 resulting from ∼4 days’ worth of activity loss due to RA [15]. In our study, the cost associated with loss of productivity decreased during the 12 months from baseline following treatment initiation in both PWs and HWs and across all drug classes. This decrease was possibly a direct consequence of the improvement in WPAI, OWI, and AI scores. The FIRST ACT-SC study in Japan explored the effects of treatment with TCZ for RA on work productivity in PWs and HWs and showed significant improvements in OWI and AI at 104 weeks of treatment [17]. The ANOUVEAU study, a multicentre, prospective, observational study from Japan, demonstrated that administering adalimumab for 48 weeks (∼12 months) significantly improved work productivity scores such as presenteeism, absenteeism, OWI, and AI in PWs, part-time workers, and homemakers. Moreover, the estimated cost associated with loss of productivity due to RA in Japan was USD 9.8 billion, and treatment with adalimumab reduced this cost by approximately USD 3.8 billion [14].
In the present study, over the 12-month follow-up period, we observed an overall increase from baseline in the total socioeconomic cost of RA in both PWs and HWs and across all drug classes. In both PWs and HWs, a substantial contribution to the increase in costs could be attributed to the drug costs as HCRU costs remained relatively low and stable. On the other hand, the cost associated with loss of productivity decreased from baseline and was more pronounced for HWs. This difference was partly due to the different methods used to calculate costs associated with loss of productivity for PWs and HWs, an effect that can be attributed to the greater decrease in AI observed for HWs compared with that in OWI observed for PWs. As such, a direct comparison of the total socioeconomic burden between the PW and HW groups cannot be made. Nevertheless, we observed a similar pattern in the changes in socioeconomic impact for both PWs and HWs. In the present study, we observed that the adjusted monthly socioeconomic burden was the smallest for patients receiving TCZ, for both HWs and PWs. This burden decreased for HWs by JPY 28,000 monthly. The cost-effectiveness of TCZ for treating RA has been demonstrated previously. In a real-world study from the USA, it was demonstrated that across most bDMARDs and tsDMARDs prescribed, patients receiving TCZ as either first- or second-line treatment incurred the lowest mean 1-year treatment cost [27]. Combination therapy using TCZ and methotrexate has also been demonstrated to be cost-effective for the treatment of RA in Europe (60–93% probability) [29] and the UK [30]. A recent study conducted in the Netherlands demonstrated that in patients with RA, treatment with TCZ enabled savings in indirect costs; however, these savings were limited and did not compensate for the higher drug costs [31].
The data used in this study come from a prospective, multicentre registry that collects information from patients with RA and treating rheumatologists in a real-world setting across Japan. This study examined both direct and indirect (loss of productivity) costs to estimate the total socioeconomic impact of advanced treatment for RA. The analyses provide a more comprehensive insight into treatment effectiveness, considering both clinical outcomes and the total socioeconomic impact. However, the study has several limitations. First, the drug costs evaluated indicate the respective list prices and do not reflect the out-of-pocket expenses incurred by patients. Second, some drug classes assessed in this study, such as ABT, were associated with a small sample size. Thus, results pertaining to this group must be interpreted with caution. Last, the registry does not collect information on health care costs. In the present study, HCRU costs have been calculated based on HCRU in the study and average cost estimates for the RA population in Japan reported in the literature and may not be precise.
Conclusions
Advanced therapies, including bDMARDs and tsDMARDs, have been successful in improving clinical outcomes and work productivity in biologic-naïve patients with RA. In this study, during the course of 12 months after treatment initiation, the socioeconomic burden increased across patient groups and drug classes, albeit to varying degrees. The increase in direct costs associated with drug costs was partially offset by the decrease in costs associated with loss of productivity. Our findings indicate that it is important to consider personal and medical burden as well as the overall socioeconomic impact when deciding a treatment plan for patients with RA. The results of our study may be useful in providing insights on the real-world socioeconomic burden of RA treatment in Japan.
Acknowledgements
The authors would like to thank all CorEvitas RA Japan investigators, their clinical staff, and patients who participated in the CorEvitas RA Japan Registry and Samantha J. Kerti for her substantial contribution to the study design and conception. Medical writing and editorial support were provided by Varsha Sreenivasan, PhD, of Cactus Life Sciences (part of Cactus Communications) and funded by Chugai Pharmaceutical Co., Ltd.
Supplementary data
Supplementary data are available at Modern Rheumatology online.
Conflict of interest
HY has received speaker or consultant fees from Astellas, Bristol-Meyers-Squibb, CorEvitas LLC, Eisai, Pfizer, Tanabe-Mitsubishi, Teijin Pharma, Chugai Pharmaceutical Co., Ltd. and YLBio. MK has received consulting fees and/or honoraria from CorEvitas LLC, AbbVie, Asahi-Kasei Pharma, Astellas, Ayumi Pharma, Bristol-Meyers-Squibb, Chugai, Daiichi-Sankyo, Eisai, Eli Lilly, Gilead, Janssen, Novartis, Ono Pharma, Pfizer, Tanabe-Mitsubishi and UCB Pharma. YT has received speaker or consultant fees from CorEvitas LLC; grants or contracts from Asahi-Kasei Pharma, AbbVie, Chugai, Eisai, Takeda, Daiichi-Sankyo and Behringer-Ingelheim and payment or honoraria for lectures, presentations, speaker bureaus and manuscript writing or educational events from Behringer-Ingelheim, Eli Lilly, AbbVie, Gilead, AstraZeneca, Bristol Myers, Chugai, Daiichi-Sankyo, Eisai, Pfizer, Mitsubishi-Tanabe and GlaxoSmithKline. JO, ME, ZM and SSD are employees of CorEvitas, LLC. NN, KY and JM are employees of Chugai Pharmaceutical Co., Ltd. TB was a full-time employee of CorEvitas LLC during the study period.
Funding
This study was conducted using the CorEvitas RA Japan Registry sponsored by CorEvitas, LLC, and the analysis was funded by Chugai Pharmaceutical Co., Ltd. CorEvitas has been supported through contracted subscriptions in the last 2 years by AbbVie, Amgen, Inc., Arena, Boehringer Ingelheim, Bristol Myers Squibb, Celgene, Chugai, Eli Lilly and Company, Genentech, Gilead Sciences, Inc., GlaxoSmithKline, Janssen Pharmaceuticals, Inc., LEO Pharma, Novartis, Ortho Dermatologics, Pfizer, Inc., Regeneron Pharmaceuticals, Inc., Sanofi, Sun Pharmaceutical Industries Ltd, and UCB S.A.
Data availability
Data are available from CorEvitas, LLC, through a commercial subscription agreement and are not publicly available. No additional data are available from the authors.
Author contributions
All authors contributed to the conception and design of the study, the development of the statistical analysis plan, the interpretation of the results, and the drafting of the manuscript. Access to study data was limited to CorEvitas, and hence CorEvitas statisticians completed all analyses; all authors contributed to the interpretation of the results. All authors revised the manuscript critically for important intellectual content and gave final approval for the manuscript to be submitted. All authors agreed to be accountable for all aspects of the work in ensuring that questions related to the accuracy or integrity of any part of the work are appropriately investigated and resolved.
