


ABSTRACT
Some of the Intermediate Mass Black Hole candidates observed at the centre of galaxies or in globular clusters and some of the Supermassive Black Holes seen at the centre of many galaxies might be of primordial origin. Indeed, Primordial Black Holes (PBHs) of such mass could have formed when the Universe was ∼1–103 s old, due to the collapse of density fluctuations. In particular, when the Universe was ∼1 s in age, Electron–Positron Annihilation (EPA) took place. We explore the formation of intermediate mass and supermassive PBHs, taking into account the effect of the EPA when the fluctuations have a running tilt power-law spectrum: when these cross the 10−0.5–103.0 s Universe horizon they could produce 5 × 10³–5 × 10⁸ M⊙ PBHs with a density as high as ∼1010/Gpc3. On average, this implies a population of about one thousand PBHs in the Local Group of Galaxies, with the nearest one at about 250 kpc, just under half the distance to the Andromeda galaxy (M31).
1 INTRODUCTION
Primordial Black Holes (PBHs) may have formed in the early Universe due to the gravitational collapse of density fluctuations (with amplitude δ larger than a threshold δc) with their masses, typically, given by the horizon mass, MH, at the epoch tk of collapse (the horizon crossing time) when that fluctuation, which was disconnected from physical processes due to inflation, reentres the cosmological horizon (see Sobrinho, Augusto & Gonçalves 2016, and references therein). For a radiation-dominated Universe, in which the background sound speed is given by |$c_{\mathrm{ s},0}=1/\sqrt{3}$|, the value of δc is a constant such that 0.4 ≤ δc ≤ 0.6, with the true value being a function of the shape of the energy density perturbation. Here we consider δc ≈ 0.50, which corresponds to the typical Mexican-Hat perturbation profile (Musco et al. 2021; Musco, Jedamzik & Young 2023).
In special circumstances, such as the QCD phase transition, the value of δc may drop to as low as δc ≈ 0.1, due to the decrease on the background sound speed (Sobrinho et al. 2016) which, in turn, could lead to an important population of PBHs (Sobrinho & Augusto 2020). Less dramatic reductions on the value of δc may also occur during cosmic annihilation epochs such as the e+e− annihilation (EPA; e.g. Jedamzik & Niemeyer 1999; Carr & Kühnel 2020; Carr et al. 2021a; Musco et al. 2023). Although Jedamzik (1997) pointed to a decrease of ∼10–20 per cent on the background sound speed value for a few Hubble times, more recently Carr et al. (2021a) mention a value around 5–10 per cent with Musco et al. (2023) and Abe & Tada (2023) reducing this to |${\approx} 5{{\ \rm per\ cent}}$|–6 per cent. We consider the e+e− annihilation epoch the period during which the sound speed stays below its background value.
Assuming that during the EPA the entropy is conserved (Universe evolving close to thermal equilibrium) the sound speed can be written as (Schmid, Schwarz & Widerin 1999)
Here s(T) is the entropy density (e.g. Kolb & Turner 1990; Husdal 2016), given by
where gs(T) accounts for the number of entropic degrees of freedom (Kolb & Turner 1990),
The factor 7/8 takes into account the difference between Fermi and Bose statistics and Ti represents the possibility that the particle species i may have an equilibrium distribution different from that of photons when the temperature is T (Kolb & Turner 1990).
When the temperature was ≈5 MeV the Universe was mainly populated by relativistic photons, electrons, positrons, and neutrinos, all of them in thermal equilibrium at the same temperature (Ti/T = 1) giving gs = 10.75 (Weinberg 2008). When the temperature drops below ≈0.8 MeV neutrinos decouple from the rest of the Universe since their (weak) interaction rate becomes lower than the expansion rate of the Universe (Perkins 2000; Padmanabhan 2002).
When the temperature becomes lower than 0.511 MeV (corresponding to the electron rest mass me) the production of new e+e− pairs is severely suppressed, with the remaining ones annihilating. The energy released in this process reheats the photons but not the neutrinos since they are already decoupled. Thus, from this point on, photons and neutrinos evolve with different temperatures. At the end of the EPA epoch the temperature of the neutrinos Tν relates to the temperature of the photons Tγ according to (e.g. Schwarz 2003; Weinberg 2008),
which holds until the present time, with gs ≈ 3.91 (e.g. Kolb & Turner 1990; Schwarz 2003; Husdal 2016). During the EPA epoch the value of Tν evolves according to (Weinberg 2008)
where S is a non-trivial function (see Weinberg 2008, for details).
An Intermediate Mass Black Hole (IMBH) is, by convention, a black hole with a larger mass than a Stellar mass Black Hole (SBH) but with a smaller mass when compared to a Supermassive Black Hole (SMBH): from ∼100 to 106 M⊙ (e.g. see Greene, Strader & Ho 2020). Given its location in cosmological time, it has been mentioned by others that the EPA epoch might have enhanced the formation of IMBHs and/or SMBHs (e.g. Jedamzik 1997; Carr et al. 2021a, 2024).
It is now well established that SMBHs reside in the centres of many galaxies (e.g. Kormendy & Ho 2013; van den Bosch 2016) including our own Galaxy with a 4.297 × 10⁶ M⊙ SMBH (Gravity Collaboration 2023). Still in the Local Group of Galaxies (LG) we have SMBHs at the core of M31 (1.4 × 10⁸ M⊙; Bender et al. 2005) and M32 (2.4 × 10⁶ M⊙; van den Bosch & de Zeeuw 2010).
So far, it has not yet been possible to demonstrate beyond reasonable doubt the existence of a single IMBH. Nevertheless, a few strongest IMBH candidates have been identified (Greene et al. 2020). Out of these, we picked the eleven with a small mass uncertainty and show them in Table 1. Their masses go from 2 × 10³ to 9 × 10⁵ M⊙ and their distances from just 5 kpc to almost 1 Gpc. Although several mechanisms concerning the formation of IMBHs have been extensively explored (e.g. Rose et al. 2022), we cannot rule out that some of them are primordial in origin.
IMBH candidates with a ‘known’ mass (the error is less than one order of magnitude and there are no conflicting results in the literature), ordered by distance. For each candidate we show (1) the host name, (2) distance in Mpc, and (3) its mass. The data were retrieved from Greene et al. (2020).
| (1) | (2) | (3) |
|---|---|---|
| Host | Distance | Mass |
| (Mpc) | (×105 M⊙) | |
| 47 Tuc | 0.005 | 0.02 |
| NGC 1904 | 0.013 | 0.03 |
| NGC 5102 | 3.2 | 9 |
| NGC 5206 | 3.5 | 6 |
| UGC 6728 | 27 | 5 |
| iPTF16fnl | 67 | 3 |
| ASASSN−14ae | 200 | 3 |
| WINGS J1348 | 265 | 5 |
| PTF−09axc | 536 | 5 |
| PS1−10jh | 822 | 7 |
| PTF−09djl | 900 | 7 |
The aim of this letter is to explore the effect of the EPA epoch on PBH formation and how this could contribute to the population of IMBHs and SMBHs. The letter is organized as follows: in Section 2 we evaluate the behaviour of the threshold δc during the EPA epoch and determine the number density of PBHs formed in a few specific situations. In Section 3 we discuss the results.
2 PBH FORMATION DURING THE EPA EPOCH
Using equations (1), (2), (3), and (5) we determined the behaviour of the sound speed during the EPA epoch (Fig. 1): |$c_{\mathrm{ s}}^{2}(t)$| stays below its background value (|$c_{\mathrm{ s},0}=1/\sqrt{3}$|) between the instants t1 ≈ 0.1 s and t2 ≈ 650 s with the minimum value |$c_{\mathrm{ s},\mathrm{ min}}^{2}\approx 0.292$| (which corresponds to a reduction of |${\approx} 6{{\ \rm per\ cent}}$|) reached when t ≈ 50 s.
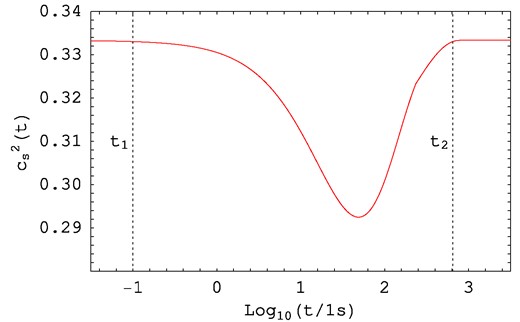
The sound speed |$c_{\mathrm{ s}}^{2}(t)$| during the EPA epoch. Between the instants t1 ≈ 0.1 s and t2 ≈ 650 s the sound speed stays below |$c_{\mathrm{ s},0}^{2}=1/3$|, reaching a minimum of |$c_{\mathrm{ s},\mathrm{ min}}^{2}\approx 0.292$| at t ≈ 50 s.
The value of the threshold δc ≈ 0.50 changes slightly during the EPA when the horizon crossing time tk gets close enough to reach a new PBH formation threshold δc1 < δc. In particular when tk = tc1 ≈ 25 s we have δc1 ≈ 0.471 (see Sobrinho et al. 2016 for details on the method used to evaluate δc1) which corresponds to the smallest value attained by δc1 (Fig. 2).
![The [log10(tk/1s), δk] plane wherein the shadowed region there is collapse to a PBH. The curve gives the limits for the EPA epoch model when δc = 0.50, with the vertical lines t1 ≈ 0.1 s and t2 ≈ 650 s defining the EPA epoch (cf. Fig. 1). For a given horizon crossing time, tk, the dashed region represents our newly found window for PBH formation. The minimum of δc1 is 0.471 at tk = tc1 ≈ 25 s.](https://oup.silverchair-cdn.com/oup/backfile/Content_public/Journal/mnrasl/531/1/10.1093_mnrasl_slae028/1/m_slae028fig2.jpeg?Expires=1750508395&Signature=2CluzLodTwjAXR-IiAs9O86ino2LpFXGC2sJonEH35TSL2cvlOdWAXFrf-mL1gFdV2U~2xqhXFFg3eQ-18yvR2I5PQcJX~B88tecADTVVvYe6oPKXNB74HT22HowfnSWGv6Ree5OX70o0zxUHy0QmGdaajcWqHg24WezKVdsfkCO2-bd-AiNxk14gjXEEbKWSi8EB2QZPHgl8kon9vkT2s0vW7y3FVjywS1GYXQ2iraizH~Zvs0dYWbvLt8vNmns6fx5LADscPaPwTcr-xxr3ZZc4E4E5eEWyx6MSyFo0iXAczVUS8MmkTPO-D6jhvu8PmqISnYGxEvDU4ZGznp-LA__&Key-Pair-Id=APKAIE5G5CRDK6RD3PGA)
The [log10(tk/1s), δk] plane wherein the shadowed region there is collapse to a PBH. The curve gives the limits for the EPA epoch model when δc = 0.50, with the vertical lines t1 ≈ 0.1 s and t2 ≈ 650 s defining the EPA epoch (cf. Fig. 1). For a given horizon crossing time, tk, the dashed region represents our newly found window for PBH formation. The minimum of δc1 is 0.471 at tk = tc1 ≈ 25 s.
For the density fluctuations we considered a running tilt power-law spectrum (cf. equation 4 of Sobrinho & Augusto 2020). In order to compute the corresponding spectral index, n(k), we take the observational values of the parameters n0, n1, and n2 measured at some pivot scale kc (Table 2). In order to explore different scenarios we attribute values to the still unknown parameters n3 and n4 and assume that ni = 0 when i ≥ 5 (see Section 3 of Sobrinho & Augusto 2020). We then relate (n3, n4) to the more meaningful quantities (|$n_{\mathrm{ max}},t_{k_{\mathrm{ max}}}$|), nmax being the maximum value attained by the spectral index n(k) and |$t_{k_{\mathrm{ max}}}$| the instant when nmax takes place (cf. equations 18 and 19 of Sobrinho & Augusto 2020).
| Parameter | Description | Value | Reference |
|---|---|---|---|
| n0 | Spectral index at the pivot scale (kc) | 0.9647 | (1) |
| n1 | Running of the spectral index | 0.0011 | (1) |
| n2 | Running of the running of the spectral index | 0.009 | (1) |
| kc | Pivot scale | 0.05 Mpc−1 | (1, 2) |
| |$\delta _{\mathrm{ H}}^{2}(k_{\mathrm{ c}})$| | Amplitude of the density perturbation spectrum at the pivot scale (kc) | 2.0989 × 10⁻⁹ | (2) |
| ρc(t0) | Critical density of the Universe at the current epoch (t0) | 8.531 × 10⁻²⁷ kgm−3 | (2) |
| ΩCDM | Cold Dark Matter density parameter | 0.265 | (2) |
We found, numerically (with Wolfram Research Inc. 2005), that the EPA epoch is well covered by considering 1.920 ≤ nmax ≤ 2.500 and |$10^{-1.0}\mathrm{~s}\le t_{k_{\mathrm{ max}}}\le 10^{3.0}$| s. In Fig. 3 we show the region on the |$[n_{\mathrm{ max}},\log (t_{k_{\mathrm{ max}}}/1\mathrm{~s})]$| plane where PBH formation is possible, sitting between (i) the ‘Forbidden region’, where the amount of PBHs would violate the observational constraints (cf. Carr et al. 2021b); and (ii) ‘no PBH formation’, actually meaning that their numbers are negligible (less than one PBH within the entire observable Universe). For a given value of |$t_{k_{\mathrm{ max}}}$| the fraction of the Universe going into PBHs, β(tk) (see Sobrinho & Augusto 2020), will be maximum if the corresponding value of nmax is the one located over the solid curve in Fig. 3.
![The curves in the $[n_{\mathrm{ max}},\log (t_{k_{\mathrm{ max}}}/1\mathrm{~s})]$ plane indicating which parameter values lead to PBH formation during the EPA epoch. Below the solid curve, PBH formation is not allowed since it would violate the observational constraints (cf. Carr et al. 2021b). Above the dashed curve, PBH formation is allowed although in negligible numbers (less than one PBH within the observable Universe). The region of interest, as regards PBH formation, is the one located between the two curves, with the most favourable situations on the solid curve: the number density of PBHs decreases as one moves from the solid curve towards the dashed one. See Fig. 4.](https://oup.silverchair-cdn.com/oup/backfile/Content_public/Journal/mnrasl/531/1/10.1093_mnrasl_slae028/1/m_slae028fig3.jpeg?Expires=1750508395&Signature=SpmRXPcAMaHZoY1jU8B0lgKYXXsVWeGapRiDQsq7iX3jEqbeQioLOG8SL8jR2fevrpeTgmwPf-IiWhh~HWPuT4jcPgxctWbgSBI7kFQxKtQDDgCeeSkAoUiT~NrtKgBR5pSTuV8SdPMBqyA4USq3~RQrhpHZKiUWdbx9~XcXGtZSJsimDat7f4kYOWsxFDMuYCaI7fjF0NKXlDXh-bsfHK~6ft0yBikgG3Xp0fFZHphaBdYAzRv-KGpmVnvmTvlZAHlEhhNryFg~0ACsIqyJrMy2l~rWcr0SXQWaX2vbXoa0E0ZUfPs-Zt7VHOw8p9fNHK13yp3yahmExQvEEQoyLw__&Key-Pair-Id=APKAIE5G5CRDK6RD3PGA)
The curves in the |$[n_{\mathrm{ max}},\log (t_{k_{\mathrm{ max}}}/1\mathrm{~s})]$| plane indicating which parameter values lead to PBH formation during the EPA epoch. Below the solid curve, PBH formation is not allowed since it would violate the observational constraints (cf. Carr et al. 2021b). Above the dashed curve, PBH formation is allowed although in negligible numbers (less than one PBH within the observable Universe). The region of interest, as regards PBH formation, is the one located between the two curves, with the most favourable situations on the solid curve: the number density of PBHs decreases as one moves from the solid curve towards the dashed one. See Fig. 4.
In Fig. 4 we show the β(tk) curves for the case when |$t_{k_{\mathrm{ max}}}=10^{1.3}\mathrm{~s}$| (nmax = 2.180) and when one neglects the EPA contribution, which corresponds to the maximum difference between the two curves.
![The fraction of the Universe going into PBHs [β(tk)] during the EPA epoch when $t_{k_{\mathrm{ max}}}=10^{1.3}\mathrm{~s}$ and nmax = 2.180 (solid line labelled β). The dashed line represents the curve β(tk) when the EPA effect is neglected. The curve labelled ‘oc’ close to the top represents the observational constraints. This graph is the situation when the two β(tk) curves are farther from each other.](https://oup.silverchair-cdn.com/oup/backfile/Content_public/Journal/mnrasl/531/1/10.1093_mnrasl_slae028/1/m_slae028fig4.jpeg?Expires=1750508395&Signature=qISyL~Tq9MopVe82537IEp2kIq1RNDNyAWv2SsGPXS4oSA0rL70L-ZJi8MBYXBncMRR1bMDgEmToqkNmhtF1rar8QGAkR7aPxOQBxfMvz13pn8~yfBbNDLxhyEg8LuFWKTULcsXo~Ssys1w55RpMIIR3HDm44h-SkTE2lXmVvn6jEf16DJicBlN5-uv~jAx2L5D21gt1UP4TgmyF6WhYXBDIgCREVAeIh9dtPMbglt8EHslbyDdGPGmE7W6bNAGkxBhiOfprkYoHPHQwmv5bom8ic13OIpSggC~p4mDYso92KRuvIW2S0whS87yTseljkNhR0nKBGt3OB9daslcctw__&Key-Pair-Id=APKAIE5G5CRDK6RD3PGA)
The fraction of the Universe going into PBHs [β(tk)] during the EPA epoch when |$t_{k_{\mathrm{ max}}}=10^{1.3}\mathrm{~s}$| and nmax = 2.180 (solid line labelled β). The dashed line represents the curve β(tk) when the EPA effect is neglected. The curve labelled ‘oc’ close to the top represents the observational constraints. This graph is the situation when the two β(tk) curves are farther from each other.
In Table 3 we show the PBH mass spectrum for a selection of cases (we pick up from the results of Sobrinho & Augusto (2020) who cover up to ∼5 × 10² M⊙) all of them located over the solid curve in Fig. 3.
The mass spectrum for a selection of specific situations which imply maximum PBH formation during the EPA epoch (on the solid line of Fig. 3). (1): |$t_{k_{\mathrm{ max}}}$|, the instant when the spectral index attains its maximum value; (2): nmax, the maximum value attained by the spectral index; (3–8): the number density of PBHs for each representative mass.
| (1) | (2) | (3) | (4) | (5) | (6) | (7) | (8) |
|---|---|---|---|---|---|---|---|
| |$\log (t_{k_{\mathrm{ max}}}/1\mathrm{~s})$| | nmax | N/Gpc3 | |||||
| 5 × 10³ M⊙ | 5 × 10⁴ M⊙ | 5 × 10⁵ M⊙ | 5 × 10⁶ M⊙ | 5 × 10⁷ M⊙ | 5 × 10⁸ M⊙ | ||
| −0.5 | 1.970 | 8.9 × 10⁷ | 2.6 × 10⁷ | 0 | 0 | 0 | 0 |
| 0 | 2.036 | 1.6 × 10⁷ | 1.8 × 10¹⁰ | 3.0 × 10⁶ | 0 | 0 | 0 |
| 0.5 | 2.087 | 0 | 1.9 × 10⁹ | 2.0 × 10⁹ | 0 | 0 | 0 |
| 1.0 | 2.143 | 0 | 7.2 × 10³ | 1.4 × 10⁹ | 6.5 × 10⁵ | 0 | 0 |
| 1.5 | 2.207 | 0 | 0 | 1.4 × 10⁸ | 1.9 × 10⁸ | 0 | 0 |
| 2.0 | 2.288 | 0 | 0 | 1.4 × 10² | 1.2 × 10⁸ | 4.4 × 10⁴ | 0 |
| 2.5 | 2.376 | 0 | 0 | 0 | 6.3 × 10⁶ | 2.7 × 10⁷ | 0 |
| 3.0 | 2.475 | 0 | 0 | 0 | 0 | 9.1 × 10⁶ | 4.7 × 10⁴ |
In Fig. 5 we show the curves giving the maximum number of PBHs that could form as a function of |$t_{k_{\mathrm{ max}}}$| when the EPA effect is taken into account and when it is not. Moving from left to right we have a region for which the two curves coincide (up to |$t_{k_{\mathrm{ max}}}\simeq 1$| s) followed by a section where the contribution of the EPA clearly dominates, with the largest contribution from the EPA occurring for |$t_{k_{\mathrm{ max}}}\simeq 20$| s (cf. Fig. 4). When |$t_{k_{\mathrm{ max}}}\simeq 10^3$| s the two curves converge again.
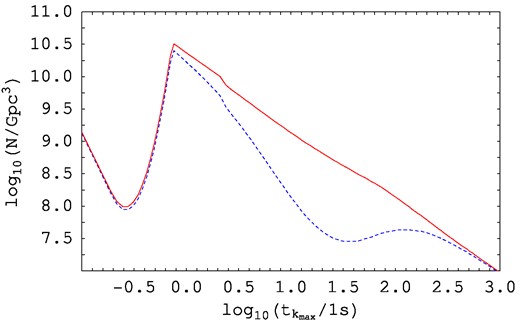
The maximum number of PBHs per Gpc3 that could form as a function of |$t_{k_{\mathrm{ max}}}$| when the EPA is taken into account (solid curve) and when the effect of the EPA is neglected (dashed curve). Note that the largest EPA contribution occurs for |$t_{k_{\mathrm{ max}}}\simeq 20$| s (this corresponds to the case represented in Fig. 4).
3 DISCUSSION
Although no IMBH has been securely confirmed as of today, there is every reason to anticipate their existence, since many well-studied mechanisms might form them, including the primordial Universe (≤10 s old), which includes the EPA epoch. PBHs can form in the early Universe due to the collapse of overdense regions provided that the amplitude δ of the density fluctuations is greater than some threshold δc. Although during the radiation-dominated Universe δc remains constant (δc ≈ 0.50) it might decrease if the Universe goes through a cosmological phase transition or an annihilation epoch such as the EPA, favouring PBH formation. Indeed, during the EPA epoch, we get a result as low as δc = 0.471 (|${\approx} 6{{\ \rm per\ cent}}$| less than its background value). As a consequence, we have discovered that, in the case of a running tilt power-law spectrum, the EPA increases the number density of PBHs when |$t_{k_{\mathrm{ max}}}$| (the instant when the maximum spectral index of the fluctuations takes place) occurs close to the EPA epoch (see Fig. 5).
Carr et al. (2021a) explored the effect of the EPA contribution to the number density of PBHs by considering different cases that always peak at SMBH masses (∼106 M⊙). Our results cover a much broader range, from IMBH to SMBH masses (∼103–108 M⊙).
Indeed, as regards SMBHs we have obtained number densities of ∼108/Gpc3 (for |$t_{k_{\mathrm{ max}}}\simeq 30$|–100 s and ∼5 × 10⁶ M⊙), giving two-to-three PBHs within the LG which is consistent with what we know, so far. It is plausible to consider that PBHs within this mass range would grow up due to accretion (e.g. Carr et al. 2021a). As for IMBH, their number density could reach ∼1010/Gpc3 (for |$t_{k_{\mathrm{ max}}}\simeq 1~\mathrm{ s}$| and ∼5 × 10⁴ M⊙), giving ∼250 PBHs within the LG with the nearest one at an average distance of ∼0.25 Mpc (assuming an homogeneous distribution), ∼109/Gpc3 (for |$t_{k_{\mathrm{ max}}}\simeq 3~\mathrm{ s}$| and ∼5 × 10⁴–5 × 10⁵ M⊙), giving ≈60 PBHs within the LG, with the nearest one at an average distance of ∼0.5 Mpc, or ∼109/Gpc3 (for |$t_{k_{\mathrm{ max}}}\simeq 10~\mathrm{ s}$| and ∼5 × 10⁵ M⊙), giving ≈20 PBHs within the LG, with the nearest one at an average distance of ∼0.6 Mpc. In all the three mentioned cases the nearest IMBH is closer than the Andromeda galaxy (M31).
Up to now we are aware of 11 IMBH candidates with a known mass (cf. Table 1). Considering a region with radius ≈900 Mpc (the distance to the farthest IMBH in Table 1) we get an IMBH number density of ≈4/Gpc 3 which is a value that falls far too short of those presented in Table 3. However if we consider only the four IMBH candidates which are closest to us (≤3.5 Mpc; roughly the size of the LG) then we come up with a number density of ∼107/Gpc3 which is more in accordance to our results.
The vast majority of known IMBH candidate masses lying on the ∼105–106 M⊙ mass range might reflect the difficulty on the detection of lighter IMBHs. In fact, at the present time, it is not easy to distinguish between an IMBH candidate and other types of sources when one considers masses below ∼104 M⊙ although dynamical and accretion signatures point to a fraction of at least |$50{{\ \rm per\ cent}}$| of galaxies with masses of 109–1010 M⊙ to host a 104–106 M⊙ IMBH (e.g. Greene et al. 2020). We believe there are, at least, two types of observational bias at play here: (i) the most obvious one is related to the weakness of the sources that lie much beyond the LG; (ii) we are still looking for the best IMBH confirmation technique, since the current ones have results that are often in conflict with each other (e.g. Greene et al. 2020).
DATA AVAILABILITY
All data used in this letter are available upon request from the authors.
