


ABSTRACT
Recent observations of the fields surrounding a few Milky Way-like galaxies in the local Universe have become deep enough to enable investigations of the predictions of the standard lambda cold dark matter (ΛCDM) cosmological model down to small scales outside the Local Group (LG). Motivated by an observed correlation between the number of dwarf satellites (Nsat) and the bulge-to-total baryonic mass ratios (B/T) of the three main galaxies in the LG, i.e. the Milky Way, Andromeda, and Triangulum (M33), we use published data of three well-studied galaxies outside the LG, namely M81, Centaurus A, and M101, and their confirmed satellites, and we find a strong and significant correlation between Nsat and B/T. This presents itself in contradiction with the hitherto published results from cosmological simulations reporting an absence of a correlation between Nsat and B/T in the ΛCDM model. We conclude that, based on the current data, the Nsat versus B/T correlation is no longer a property confined to only the LG.
1 INTRODUCTION
Until recently, the haloes of only the Milky Way (MW) and Andromeda (M31) galaxies have been observed deep enough to enable studying different properties of their dwarf satellites (e.g. Grebel 1997; McConnachie 2012; Collins et al. 2015) and to test the expectations of galaxy formation and evolution scenarios down to small scales. The observations of these two galaxies, and the Local Group (LG) in general, have led to some of the long-lasting challenges for the standard lambda cold dark matter (ΛCDM) cosmological model, viz. the missing satellites (Klypin et al. 1999), the too-big-to-fail (Boylan-Kolchin, Bullock & Kaplinghat 2011), and the disc-of-satellites (Kroupa, Theis & Boily 2005; Pawlowski & Kroupa 2013) problems. The numerous observational, theoretical, and computational studies aiming at solving these issues have not reached a consensus so far (see e.g. Bullock & Boylan-Kolchin 2017, for a review). These problems required systematic and deep surveys for finding more dwarf satellites outside the LG. In the recent years, and thanks to various dedicated deep observations (e.g. Geha et al. 2017; Greco et al. 2018), other galaxy groups are also turning into very useful laboratories for investigating the small-scale predictions1 of the ΛCDM model, and for learning about galaxy formation and evolution in general.
Another interesting feature of the LG that motivated dedicated studies (such as Javanmardi et al. 2016; López-Corredoira & Kroupa 2016; Henkel et al. 2017) is an observed correlation between the number of dwarf satellites, Nsat, and bulge mass (Mbulge) of M33, MW, and M31 (Kroupa et al. 2010). This correlation appeared to be a puzzling one due to the following two reasons: (i) in the ΛCDM model, Nsat is expected to correlate with only the mass of the dark matter halo, hence with the rotation velocity, of the disc galaxy, and (ii) galaxies with similar rotation velocities (e.g. M31 and M101; Faber & Gallagher 1979) but with very different Mbulge are observed in the Universe. Therefore, unlike the expected correlation between Nsat and rotation velocity, a correlation between Nsat and Mbulge was not expected.
To quantify the expectations from the ΛCDM model for this correlation, Javanmardi et al. (2019) used data from the Millennium-II simulation (Boylan-Kolchin et al. 2009) with the semi-analytic galaxy formation model of Guo et al. (2011) and reported three main results: (i) for a sample of disc galaxies with a wide mass range, a weak correlation (with a large scatter) between Nsat and Mbulge emerges, which reflects the seemingly independent correlations between these two quantities and the mass of the disc galaxy, (ii) for disc galaxies with similar masses or rotation velocities, no correlation between Nsat and Mbulge is found, and (iii) when normalizing Mbulge with the mass of the disc galaxy, i.e. when considering B/T ratios, no correlation is found between Nsat and B/T of disc galaxies with a stellar mass M⋆ ≈ 1010–1011 M⊙ in the ΛCDM model.
Recently, the observations of the galaxies M81, Centaurus A (Cen A), M94, and M101 (at distances of about 3.7, 3.8, 4.2, and 7 Mpc, respectively) have become deep enough to enable studying their satellite properties and their relation to their hosts (Chiboucas et al. 2013; Smercina et al. 2018; Bennet et al. 2019; Carlsten et al. 2019b; Crnojević et al. 2019; Müller et al. 2019). In this contribution, we use the published data from these galaxy groups, together with the available data from M33, MW, and M31, to investigate the Nsat versus B/T correlation.
2 DATA AND ANALYSIS
In this section, we first introduce the data we use in our analysis from different studies published in the literature. See Table 1 for a summary. We then apply a simple correlation analysis and present the results.
The data used in this study and their references. See Section 2.
| Galaxy | M ⋆(1010 M⊙) | B/T | |$N^{200}_{\mathrm{ sat}}$| | |$N^{250}_{\mathrm{ sat}}$| |
|---|---|---|---|---|
| MW | 6.1a | 0.2 ± 0.075a | 10b | 12b |
| M31 | 10.3a | 0.32 ± 0.11a | 17c | 18c |
| M33 | 1d | 0.01 ± 0.001d,e | 0 | 0 |
| M81 | 5.6a | 0.46 ± 0.15a | 16f | 19f |
| Cen A | 11.2a | |$1.0^{+0.0}_{-0.1}$| a | 27g,h | 29g,h |
| M94(†) | 4i | 0.1 ± 0.02j,k | 2i (†) | 2i (†) |
| M101 | 5.9a | 0.05 ± 0.03a | 8l,m | 8l,m |
aBell et al. (2017).
bMcConnachie (2012).
cMcConnachie et al. (2018).
dCorbelli (2003).
eSeigar (2011).
fChiboucas et al. (2013).
gCrnojević et al. (2019).
hMüller et al. (2019).
iSmercina et al. (2018).
jMoellenhoff et al. (1995).
kJałocha et al. (2010).
lCarlsten et al. (2019b).
mBennet et al. (2019).
(†)Note that the field of M94 is surveyed only out to 150 kpc projected distance, and while we show it in Fig. 1, we do not include it in our correlation analysis.
2.1 Number of dwarf satellites
The information about the satellite populations of the galaxies in our study is as follows:
The LG galaxies: we refer to McConnachie (2012) and McConnachie et al. (2018) for the information about MW and M31 satellites, respectively.2
M81: using the Canada–France–Hawaii Telescope (CFHT) and Hubble Space Telescope (HST) observations, Chiboucas, Karachentsev & Tully (2009) and Chiboucas et al. (2013) have discovered and confirmed 14 new dwarf galaxies in the M81 group. Their survey covers at least ≈300 kpc projected distance around M81 (and in some directions, more than twice that; see fig. 27 of Chiboucas et al. 2013). They increased the number of known members of this group to 36 with its faintest dwarf having an r-band absolute magnitude of Mr = −6.8 (MV ≈ −8, Chiboucas et al. 2013). See their table 4 for a full list of information. It is worth noting that we do not include two tidal dwarf galaxy candidates of M81 (namely A0952 and Garlnd; Karachentsev et al. 2002; Makarova et al. 2002) in our analysis due to the uncertainties on their nature. We also note that we treat M82 as a satellite galaxy of M81 (rather than considering it separately) because M82 (being less than 100 kpc in projection away from M81) shows clear signs of disturbance and is undergoing a starburst, indicating strong interactions between the two galaxies.3
Cen A: Crnojević et al. (2019) and Müller et al. (2019) have used the Panoramic Imaging Survey of Centaurus and Sculptor (PISCeS), the HST, and the ESO Very Large Telescope (VLT) to confirm the dwarf satellite candidates of Cen A, most of which were identified by Crnojević et al. (2014), Crnojević et al. (2016), Müller, Jerjen & Binggeli (2015), and Müller, Jerjen & Binggeli (2017a). Together, Crnojević et al. (2019) and Müller et al. (2019) report in total 31 confirmed dwarf satellites for Cen A with the faintest having a V-band absolute magnitude of MV = −7.8 mag. According to Müller et al. (2019), the satellite population of Cen A is complete within its 200 kpc projected distance, while two of its already confirmed satellites, namely KK 211 and ESO 325-011, are at projected distances of 240 and 246 kpc, respectively (Crnojević et al. 2019).
M94: using deep Hyper Suprime-Cam (HSC) observations, Smercina et al. (2018) performed a survey of the field of M94 down to MV = −9.1 mag, finding only two satellites for this galaxy. Regrettably, their survey covers only out to 150 kpc projected distance, and while we discuss this galaxy in our study, we do not include it in our correlation analysis.
M101: Danieli et al. (2017) and Bennet et al. (2019) used deep HST observations and measured the tip of the red giant branch (TRGB) distances, and Carlsten et al. (2019b) have used the CFHT data and measured surface brightness fluctuation distances to satellite candidates around M101. These studies confirmed in total eight satellites for this galaxy with the faintest having a V-band absolute magnitude of MV = −8.2 mag. Most of these candidates have been found in a wide survey using also the CFHT by Bennet et al. (2017) and some of them by Merritt, van Dokkum & Abraham (2014), Javanmardi et al. (2016), and Müller et al. (2017b). These surveys cover almost isotropically the 260 kpc virial radius of M101 (see fig. 1 in Carlsten et al. 2019b).
The latter galaxy group imposes a magnitude limit on our analysis, and to be able to compare the satellite populations of all galaxies, we only count the satellites with MV ≤ −8.2 mag. In addition, we will perform our correlation analysis (Section 2.3) with two projected distance limits: first, considering only the satellites within 200 kpc projected distance to their hosts, and secondly, increasing the projected distance limit to 250 kpc by assuming that the satellite population of Cen A is complete enough out to that distance; see the last columns of Table 1 where |$N^{200}_{\mathrm{ sat}}$| and |$N^{250}_{\mathrm{ sat}}$| represent the number of satellites within 200 and 250 kpc of each galaxy, respectively.
2.2 Bulge-to-total mass ratios
The information about the B/T ratios of the galaxies in our study is as follows:
For MW, M31, M81, Cen A, and M101, stellar mass and B/T values are directly adopted from Bell et al. (2017). See their table 1 for a list of references and other measurements.
For M33, using Mbulge = 1.14(±0.14) × 108 M⊙ reported by Seigar (2011), and adopting a total mass of ≈1010 M⊙ reported by Corbelli (2003), we obtain B/T = 0.01 ± 0.001.
For M94, we adopt the mean (and its standard error) of the Mbulge values reported in Moellenhoff, Matthias & Gerhard (1995) and Jałocha, Bratek & Kutschera (2010); Mbulge = 4.54(±0.86) × 109 M⊙. Considering a stellar mass of 4 × 10¹⁰ M⊙ (Smercina et al. 2018), we obtain a B/T = 0.1 ± 0.002 for M94.
2.3 The correlation
The data listed in Table 1 are visualized in Fig. 1 by plotting Nsat versus B/T. Each galaxy is labelled on this figure and the colour code represents the M⋆. The uncertainties on B/T are the values from Table 1, and we consider an uncertainty of |$\pm \sqrt{N_{\rm sat}}$| for the number of satellites. The left- and right-hand panels correspond to considering satellites within 200 and 250 kpc of their host galaxies, respectively. The solid grey lines are the result of linear least-squared fits to the data: |$N^{200}_{\mathrm{ sat}}=30.2(\pm 6.2)B/T + 1.7(\pm 1.3)$| and |$N^{250}_{\mathrm{ sat}}=33.6(\pm 6.5)B/T + 1.7(\pm 1.3)$|. In the fitting procedure, we take both Nsat and B/T uncertainties into account. The shaded regions reflect the 1σ uncertainty of the fitting results. However, we note that we do not aim to present a formula for Nsat versus B/T and the purpose of the fitting is to better see the trend presented by these data.
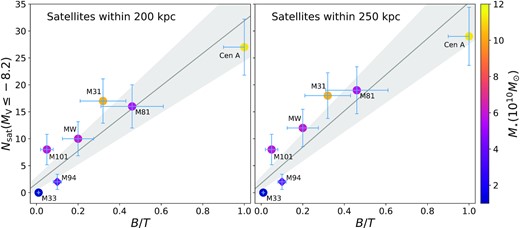
Number of satellites, Nsat (with MV ≤ −8.2) versus bulge-to-total baryonic mass ratio, B/T. The left- and right-hand panels correspond to considering satellites within 200 and 250 kpc of their host galaxies, respectively. The colour code is M⋆, the solid grey lines are the results of linear fits taking into account uncertainties on both the axes, and the shaded regions are the 1σ uncertainty of the fitted results. For both of the analyses, the probability that the correlation arises by chance is only 0.5 per cent. Since the current surveys cover only 150 kpc projected distance of M94 (shown by a diamond in this figure), this galaxy is excluded from both the fitting and the correlation analyses. Adding M94 would increase the significance of the correlation.
Our main finding is that, using these data, we measure the linear correlation coefficient for Nsat versus B/T to be r = 0.94 and the probability that this correlation arises by chance to have a p-value = 0.005, for both of the projected distance conditions.4 In other words, the data yield a 99.5 per cent (around 3σ) significant correlation between Nsat and B/T. We note that M94 is excluded from both the linear fitting and the correlation measurement.
3 DISCUSSION AND CONCLUDING REMARKS
Fig. 1 can be compared with the right-hand panel of fig. 4 in Javanmardi et al. (2019) that shows Nsat versus B/T for a sample of more than 6000 disc galaxies with stellar masses between 1.2 and 26.3 × 10¹⁰ M⊙ from the Millennium-II simulation (Boylan-Kolchin et al. 2009). This mass range almost encompasses that of the spiral galaxies in our study. Javanmardi et al. (2019) measure a linear correlation coefficient of only r = 0.13 for Nsat versus B/T, being consistent with no correlation between these two quantities in the ΛCDM model.
This can also be understood qualitatively by noting that in the ΛCDM model, Nsat is directly related to dark matter halo mass; the heavier the halo, the larger the number of accreted subhaloes (top left-hand panel of fig. 3 in Javanmardi et al. 2019), and heavier haloes also accrete more baryonic mass, forming galaxies with statistically larger stellar masses. In addition, in this model, galaxies with larger stellar masses are found to be more likely to grow heavier bulges (fig. 2 in Javanmardi et al. 2019). Therefore, in the ΛCDM model, Nsat is weakly correlated with Mbulge, but not with B/T. This certainly requires further detailed studies of bulge formation and its possible connection with large-scale environment in this model (Romano-Díaz et al. 2017; Tavasoli et al. in prep.).
An interesting point in the current data is that while M81, M101, and the MW have very similar stellar masses, they have different Nsat and very different B/T ratios, implying a lack of correlation between these two quantities and stellar mass.
We note that Cen A has a few features that make it distinct with respect to the other galaxies in our analysis. It is not a disc galaxy (with B/T = 1.0); it has an active nucleus, and it has a perturbed structure. Assuming that these have a significant impact on its satellite population, remeasuring the Nsat versus B/T correlation without Cen A gives r = 0.93 and p-value = 0.02, not changing our main result.
In addition, it should be emphasized that as mentioned earlier, M94 is not included in our correlation analysis because its field is surveyed out to only 150 kpc projected distance. Assuming that future surveys do not change the number of satellites of M94 significantly, adding it to the analysis would increase the significance of the correlation to well above the 3σ confidence level. Actually, even if future surveys increase the number of confirmed satellites of M94 by a factor of 3 or 4, the significance of the Nsat versus B/T correlation would increase even further. It is therefore very important to conduct deeper and wider surveys in the field of this particular galaxy.
In a very recent study, Carlsten et al. (2019a) have reported the detection of satellite galaxy candidates around 10 galaxies including M104 (a.k.a. the Sombrero galaxy, at a distance of around 9.5 Mpc). They report in total 27 satellite candidates within 150 kpc projected distance of this galaxy.5 With B/T > 0.7 (Gadotti & Sánchez-Janssen 2012), this galaxy can add another point to the large B/T values of the Nsat versus B/T relation. Carlsten et al. (2019a) also report in total 21 satellite candidates for NGC 4565 that has B/T = 0.25 (Bell et al. 2017). However, follow-up distance measurements for their satellite candidates are essential before including these two galaxies in the analysis.
As a final remark, it is also worth noting other reported interesting properties of the non-LG galaxies in our study. Chiboucas et al. (2013) found that M81 has a disc of satellites similar to those of MW (Kroupa et al. 2005; Pawlowski & Kroupa 2013) and M31 (Metz, Kroupa & Jerjen 2007; Hammer et al. 2013; Ibata et al. 2014). In addition, Müller et al. (2018) reported a similar structure around the Cen A galaxy. Smercina et al. (2018) and Bennet et al. (2019) conclude that M94 and M101 have sparse satellite populations, not fulfilling the expectations from the ΛCDM model. Bennet et al. (2019) suggest a link between the properties of these galaxy groups and their environments, reporting that galaxies in more tidally active environments tend to have a larger Nsat (see their fig. 8).
The latter point is in line with an alternative scenario by Kroupa (2015) arguing that if most of the observed satellites are ancient tidal dwarf galaxies, then a correlation between Nsat and B/T can emerge because bulge growth is enhanced significantly in galaxy–galaxy encounters. This would also explain the observed preferred distribution of satellites in rotating discs (Kroupa 2012; Pawlowski, Kroupa & Jerjen 2013). This scenario also requires further detailed and quantitative studies (see e.g. Combes 2016; Banik, O’Ryan & Zhao 2018; Bílek et al. 2018).
Whatever the correct underlying theory will turn out to be, and while further observational studies of these and other galaxy groups are necessary, the main finding of our study is that the current data show a strong and significant correlation between Nsat and B/T in the most well-studied galaxy groups in the Local Volume.
ACKNOWLEDGEMENTS
We thank the anonymous referee for the constructive comments. The research leading to these results has received funding from the European Research Council (ERC) under the European Union’s Horizon 2020 research and innovation programme (grant agreement number 695099).
Footnotes
We note though that the disc-of-satellites problem is not a small-scale problem as it refers to the distribution of baryonic matter on scales of hundreds of kpc about major host galaxies.
Note that a possible, but not confirmed, satellite of M33 is reported by Martin et al. (2009) with MV = −6.5.
We note that M33 shows no signs of interaction, i.e. it is close to being nearly isolated, and therefore, we consider it as a separate galaxy and not as a satellite of Andromeda.
The r and p values for the two projected distance conditions differ only after the third decimal places, not reported here.
Also confirming the low surface brightness galaxies found by the Dwarf Galaxy Survey with Amateur Telescopes (DGSAT; Javanmardi et al. 2016) within 80 kpc projected distance of M104.
REFERENCES
