


Abstract
High-precision time series photometry with the Kepler satellite has been crucial to our understanding both of exoplanets, and via asteroseismology, of stellar physics. After the failure of two reaction wheels, the Kepler satellite has been repurposed as Kepler-2 (K2), observing fields close to the ecliptic plane. As these fields contain many more bright stars than the original Kepler field, K2 provides an unprecedented opportunity to study nearby objects amenable to detailed follow-up with ground-based instruments. Due to bandwidth constraints, only a small fraction of pixels can be downloaded, with the result that most bright stars which saturate the detector are not observed. We show that engineering data acquired for photometric calibration, consisting of collateral ‘smear’ measurements, can be used to reconstruct light curves for bright targets not otherwise observable with Kepler/K2. Here we present some examples from Kepler Quarter 6 and K2 Campaign 3, including the δ Scuti variables HD 178875 and 70 Aqr, and the red giant HR 8500 displaying solar-like oscillations. We compare aperture and smear photometry where possible, and also study targets not previously observed. These encouraging results suggest this new method can be applied to most Kepler and K2 fields.
INTRODUCTION
The results of the Kepler Mission, launched in 2009, have revolutionized both exoplanetary science (Winn & Fabrycky 2015) and asteroseismology (Chaplin & Miglio 2013). The original Kepler Mission ended after four years, following the failure of two reaction wheels required to stabilize the spacecraft pointing. The K2 Mission is now underway, using the two remaining wheels to control two axes while the third, the overall roll angle, sits at an equilibrium balanced by solar radiation pressure (Howell et al. 2014). This requires that the telescope be pointed approximately orthogonal to the direction of the Sun, so that fields are limited to ∼80 d ‘Campaigns’ (hereafter C) centred close to the ecliptic plane. The first results from asteroseismology with K2 are very promising, detecting solar-like oscillations with observations of red giants subgiants and classical pulsators (Stello et al. 2015; Chaplin et al. 2015; Lund et al. 2015).
Because of limitations on communications bandwidth, not all targets ‘on silicon’ (i.e. in the spacecraft field of view) are downloaded. Instead, ‘postage stamps’ of active pixels are downloaded around pre-determined targets of interest, and data from other pixels are discarded. The situation is particularly difficult for the brightest stars: when these sources saturate the detector, electrons bleed along the saturated columns, with the result that very large apertures are required to capture all of the stellar flux. Therefore these brightest stars are very expensive in terms of the limited number of pixels that can be downloaded, and many were omitted from the target lists. The situation is even more difficult in K2 because the ‘postage stamps’ must be larger in order to account for the apparent motion of the sources as the roll angle varies, and also because the ecliptic target fields contain a much higher density of nearby bright stars.
Beginning with the K2 Campaign 3 data release, engineering data were made publicly available on the Mikulski Archive for Space Telescopes (MAST). These included collateral data for both long and short cadence (SC), which consist of measurements of photometric ‘smear’ for each column in the CCD. Since the Kepler camera lacks a shutter, light falling on the detector during the read-out stage causes photometric smear that must be calibrated. The SC consist of the sum of nine 6.02 s exposures for a total integration of 54.2 s, and the long cadences (LC) are the sum of 30 times these, for a total of 1626 s. The light landing during read-out is added column-by-column and stored as ‘collateral’ smear data at each cadence of both the Kepler and K2 Missions. Kolodziejczak & Caldwell (2011) suggested using these smear pixels data to obtain photometry of otherwise unobserved Kepler stars. They outlined a method for extracting light curves from these data and presented several examples, but to our knowledge this has not been followed up in subsequent work. The goal of this Letter is to demonstrate that smear pixels can be used to extract scientifically useful photometry for very bright stars in both Kepler and K2 fields.
The upcoming Transiting Exoplanet Survey Satellite (TESS) (Ricker et al. 2015) Mission aims to study such nearby, bright stars to identify promising candidates for further study, but many K2 targets will be out of its reach. TESS will observe polar regions most frequently and devote significantly less time to equatorial fields, with the result that the ecliptic objects studied by K2 are excluded from most of the nominal TESS Mission. Therefore, for these targets, K2 smear data provide the only space-based photometry likely to be available in the near future.
METHOD
The smear data consist of Flexible Image Transport System (FITS) tables containing ‘virtual’ and ‘masked’ smear flux. These contain, respectively, smear information from 12 masked rows at the start of each read-out and 12 over-clocked rows after each frame is read-out. The 12 smear rows are co-added for each region and stored as 1D arrays listing the sum for each column of the CCD. An example for the case of HR 8500 is shown in Fig. 1. For 70 Aqr and HD 178875, we took the sum of the virtual and masked flux as our raw smear observable. For a target star that falls near the upper or lower edge of the detector, one of these smear arrays can be affected by saturated flux bleeding along the column. As a result, for HR 8500, only the masked flux was suitable, as discussed in Section 3.3.
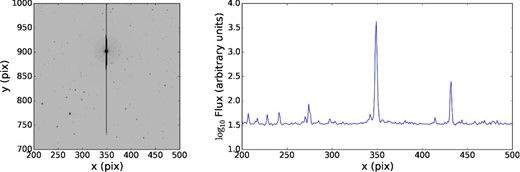
Smear data from K2 Campaign 3 for the bright star HR 8500. Left: part of the full-frame image, including HR 8500 as the saturated star with a long bleed column extending above and below. Right: 1D masked smear profile, with HR 8500 clearly visible as the highest peak.
Two factors restrict the usefulness of the smear data to the brightest stars. One is the fact that the data are summed across all 1024 rows of the detector, so that targets in the same column are confused. The other is that, as noted by Kolodziejczak & Caldwell (2011), the effective exposure time for smear data is much less than for ordinary target pixels. This is because we have 12 rows each of masked and virtual smear, which measure the incident flux during the 0.52 second read-out, so that the effective exposure time is only 12/1070 * 0.52/6.02 ∼ 1/1034 of the true pixel exposures for each of the virtual and masked smear, or ∼1/517 if both can be used. Hence, the photometric precision for bright stars is expected to be equivalent to that of a star ∼6.7 mag fainter observed in the standard way, but for stars fainter than a Kepler magnitude (Kp) of ∼9 (as defined in Koch et al. 2010), read noise dominates and the smear precision falls off faster than the square root of the number of photons.
For a more detailed description of the smear data we recommend to the reader Caldwell et al. (2010), Quintana et al. (2010), the Kepler Data Processing Handbook (KSCI-19081-001) (Fanelli et al. 2011), and the Kepler Instrument Handbook (KSCI-19033) (Van Cleve & Caldwell 2009).
For each target star, we visually inspected the full-frame images (FFIs) taken at the beginning of each Quarter (Kepler; hereafter Q) or Campaign (K2) and located the relevant columns in the corresponding smear data. An example for K2 C3 is shown in Fig. 1. We see that the columns containing the bright saturated star HR 8500 (Section 3.3) correspond to a very strong peak in the smear data. Having identified the target in the smear data, we selected an appropriate range of columns, taking care to avoid confusion with nearby sources, and extracted a time series for each column. In the case of HD 178875 (Section 3.1) in the original Kepler field, we took the sum of these time series as the light curve for the star.
For stars observed in K2, pointing corrections introduce potentially large systematics. The photometric precision of K2 is lower than in the nominal Mission because the roll-axis equilibrium is unstable and must be corrected by thruster firings every ∼6 h, with momentum dumps on the other two axes every 2 d. We corrected for these by tracking the 1D centroid of the smear peak, and extracting photometry using an aperture with a 3-pixel flat top and 2-pixel cosine bell (Hanning) taper on either side of this. We then applied the method of Aigrain et al. (2015), using a Gaussian process (GP) systematic model, using a 1D squared exponential kernel for continuum variations as a function of time. We model the pointing variations with a 2D squared exponential kernel taking as inputs the predicted x and y position of a nearby star: for HR 8500, this was EPIC 206249807, and for 70 Aqr it was EPIC 206164235.
While in Sections 3.3 and 3.2 we present an analysis of systematics-corrected light curves, the corrections are minor and the raw light curves support the same qualitative conclusions. Other detrending methods such as those of Vanderburg & Johnson (2014), Lund et al. (2015) and Foreman-Mackey et al. (2015) may also achieve similar results.
RESULTS
Hd 178875
HD 178875 (KIC 3429637) is one of the brightest δ Scuti stars in the original Kepler field, with a Kp mag of 7.711. Over the first 2 yr of the Kepler Mission it showed a growth in pulsation amplitude that was attributed to its advanced evolutionary state, near the terminal-age main sequence (Murphy et al. 2012).
We have extracted the six strongest oscillation frequencies present in the smear data of this star, and they agree with those published by Murphy et al. (2012) to within the 1σ uncertainties. A light-curve segment with a six-frequency fit is shown in Fig. 2. The msMAP (Stumpe et al. 2014) and smear light curves resemble each other closely, although the latter has a higher noise level because of the much lower effective exposure time. The error bars drawn in Fig. 2 are proportional to the per-point residuals after the non-linear least-squares fit.
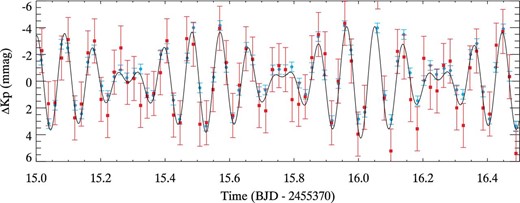
Light-curve segment from Q6 for HD 178875 from the msMAP data (blue circles) and the smear data (red squares). The black line shows a six-frequency fit.
Stellar oscillation frequencies are the fundamental data of asteroseismology. Their recovery to 1σ precision in smear data against published values that used aperture photometry is a good demonstration of the utility of these data.
70 Aqr
Some stars are so bright on the Kepler CCD that it is impractical to assign sufficient pixels to perform aperture photometry. An example in the K2 field for C3 is 70 Aqr (HR 8676; HD 215874), which has a magnitude of V = 6.2. It is in some ways a typical δ Scuti star – its effective temperature (7300 K; Paunzen et al. 2002) puts it in the middle of the δ Scuti instability strip, its rotational velocity (100 km s−1; ibid.) lies at the mode of the distribution for stars of its spectral type (Royer, Zorec & Gómez 2007), and the Fourier transform of its Kepler smear light curve (Fig. 3) is typical in that it contains a few tens of statistically significant peaks. However, its Fourier transform is unusual in other ways – its highest oscillation peak puts it in the top percentile of Kepler δ Scuti stars by peak amplitude (see e.g. Murphy 2014), and the frequency distribution is rather narrow.
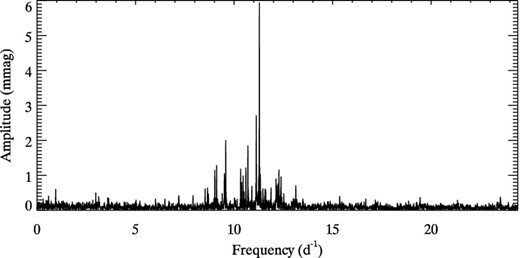
Amplitude spectrum of the K2 C3 smear data for the δ Scuti star 70 Aqr.
The K2 photometry provided here offer another epoch of observations for this star. Literature data suggest 70 Aqr undergoes amplitude variability, as is common in δ Scuti stars (see Bowman & Kurtz 2014 for a recent discussion). For instance, the catalogue of δ Scuti stars by Rodríguez, López-González & López de Coca (2000) lists an amplitude of 20 mmag in V, whereas the Kepler smear data for the two peaks at 11.2859 and 11.1298 d−1 have amplitudes of 6.1 and 2.9 mmag, respectively. The older literature has amplitudes ranging from 8.5 to 25 mmag, each for different oscillation periods (Weiss 1977; Hildebrandt 1992), suggesting the dominant mode is not always the same. In all cases, these ground-based observations cannot match the excellent duty cycle of Kepler.
One of the greatest problems in the study of δ Scuti stars is mode identification. This is usually performed with multicolour photometry or time series spectroscopy. Kepler/K2 observes in white light only, and so ground-based observations are still very valuable for mode identification. Although 70 Aqr is unremarkable as a δ Scuti star, it is bright enough for successful ground-based observing campaigns, and now thanks to the smear data we can produce a high-precision light curve despite the gross saturation on the Kepler CCD.
Hr 8500
Red giants exhibit radial and non-radial oscillations that are stochastically excited and damped by convection (De Ridder et al. 2009). The amplitudes of these oscillations are significantly smaller than those in δ Scuti stars (Kjeldsen & Bedding 1995), so detection of red giant oscillations provides a more stringent test of the precision of smear data photometry.
HR 8500 (EPIC 206246606) is one of the brightest red giants within the K2 C3 field of view, with a visual magnitude of 5.8. As for 70 Aqr, HR 8500 was not targeted due to the large number of pixels that would be required. As HR 8500 lies near the edge of the detector, its bleed column intersects with the virtual smear rows, so that the virtual smear data are affected strongly by the pointing cycle. Where the charge piles up like this, the measured smear flux is not expected to be linear with the incident flux. The associated systematics are, in the case of HR 8500's virtual smear column, of the same order as the raw flux and are not well-corrected with GP systematics models. Under these circumstances, it is preferable to use only the masked smear array. In doing so, we lose a factor of 2 in flux, but have a substantially reduced contribution from pointing systematics.
Using B − V = 1.165 from the EPIC catalogue (Huber & Bryson 2015) with the colour-Teff relations by (Ramírez & Meléndez 2005) we estimate |${T_{\rm eff}}=4570$| K, which combined with the Hipparcos parallax (van Leeuwen 2007) and a bolometric correction BCV = −0.45 (Alonso, Arribas & Martínez-Roger 1999) yields a radius of |${\sim } 13.6{\,\mathrm{R}_{\odot }}$|. Assuming a typical mass range for red giants of |$1{\rm -}2{\,\mathrm{M}_{\odot }}$|, we expect HR 8500 to oscillate with a frequency of maximum power |${\nu _{\rm max}}\sim 20{-}40{\,\mu Hz}$|.
The top panel of Fig. 4 shows the power spectrum of HR 8500 obtained from the smear data. The spectrum shows a power excess around ∼ 30 μHz, consistent with the expected |${\nu _{\rm max}}$| value from colours and the Hipparcos parallax. Using the method of Huber et al. (2009) we measured |${\nu _{\rm max}}=29.2\pm 2.5{\,\mu Hz}$| and an amplitude per radial mode of A = 99 ± 20 ppm. To further test whether the detection is compatible with solar-like oscillations, we compared our measurements to over 1000 red giants observed in the original Kepler Mission, which follow a well-established relation between νmax and oscillation amplitudes (Hekker et al. 2009; Baudin et al. 2011; Stello et al. 2011). As shown in Fig. 5 the amplitude measured in HR 8500 is fully consistent with the Kepler sample.
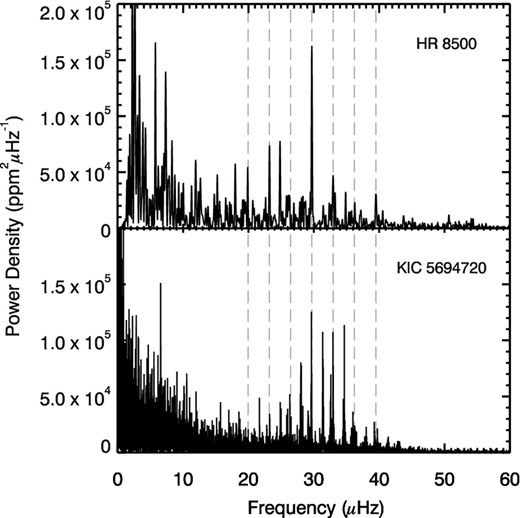
Top panel: power spectrum of HR 8500 K2 C3 smear data after outlier rejection and high-pass filtering with a boxcar width of 10 d. Dashed lines indicate the locations of radial oscillation modes. Bottom panel: power spectrum of the red giant star KIC 5694720, with frequencies scaled to match those measured in HR 8500 (the scaling factor was 0.98).
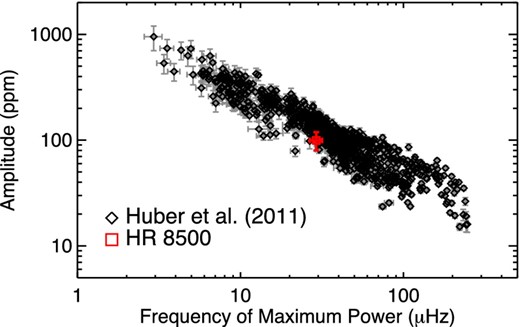
Oscillation amplitude versus frequency of maximum power for over 1000 red giants observed by the Kepler Mission taken from (Huber et al. 2011). The red square shows the measured values for HR 8500 from the K2 C3 smear data.
For comparison, the power spectrum of a similar red giant, observed throughout the Kepler Mission, is shown in the bottom panel of Fig. 4. The frequency axis has been scaled by a factor of 0.98 in order to align peaks in both power spectra. From this we are able to identify the radial oscillation modes in HR 8500, and determine the characteristic frequency spacing, Δν, between modes of consecutive radial orders to be 3.25 ± 0.02 μHz.
Oscillating red giants are plentiful in the Kepler and K2 fields (e.g. Stello et al. 2013). Through the use of asteroseismic scaling relations (Ulrich 1986; Brown et al. 1991; Kjeldsen & Bedding 1995), stellar properties including mass and radius can be determined from Δν and νmax, which is invaluable for population studies of the Milky Way galaxy (Miglio et al. 2013). However, these scaling relations require calibration to avoid systematic biases. Bright stars such as HR 8500 may be well characterized through complementary methods such as long-baseline optical interferometry, providing the means to test and calibrate these relations (e.g. Huber et al. 2012; White et al. 2013).
CONCLUSIONS
As we have shown with the examples above, collateral smear data dramatically expand the possibilities for bright star science with Kepler and K2. These ecliptic targets will not be observed by TESS, or will only be observed briefly, and this is therefore the only opportunity in the immediate future for space-based photometry of these bright stars.
The collateral archive already contains observations of many stars which can now be revisited. There are 29 stars with Kp<7 mag that were not observed by the nominal Kepler Mission, and a further 18 stars that were only observed in a few quarters. There are 17 stars in each of K2 C3 and C4 brighter than Kp =7 mag that were not targeted. Furthermore, collateral data for s 0, 1, and 2 have not yet been made available, but there are 142 unobserved targets with Kp<7 mag. Given the encouraging results of the analysis of C3 targets presented here, we believe they will also present valuable opportunities for advancing stellar astrophysics.
In allocating active pixels for future K2 campaigns, it will be valuable to consider allocating SC pixels to columns containing targets of interest, as the smear data for these columns will then be available at SC time resolution, a less-bandwidth-intensive method to obtain information about these stars on short time-scales. We also note that custom apertures for bright stars, which are expensive in terms of pixels, may be unnecessary in many cases, easing the overall competition for bandwidth and permitting future Campaigns to observe a larger number of faint targets.
This research made use of NASA's Astrophysics Data System; the SIMBAD data base, operated at CDS, Strasbourg, France; the ipython package (Pérez & Granger 2007); SciPy (Jones et al. 2001). Some of the data presented in this paper were obtained from the MAST. STScI is operated by the Association of Universities for Research in Astronomy, Inc., under NASA contract NAS5-26555. Support for MAST for non-HST data is provided by the NASA Office of Space Science via grant NNX13AC07G and by other grants and contracts. We acknowledge the support of the Group of Eight universities and the German Academic Exchange Service through the Go8 Australia-Germany Joint Research Co-operation Scheme. DH acknowledges support by the Australian Research Council's Discovery Projects funding scheme (project number DE140101364) and support by the NASA Grant NNX14AB92G issued through the Kepler Participating Scientist Program.
REFERENCES
