


ABSTRACT
The Muztagh-Ata site, situated in the eastern Pamir Plateau of south-western Xinjiang, China, has been identified as a promising high-altitude location for astronomical observations, with systematic monitoring of atmospheric and observational parameters conducted since 2017. This study analyses 6 yr (2017–2022) of Differential Image Motion Monitor data, revealing exceptional stability in the site’s seeing conditions, with a median value of 0.89 arcsec and a mean value of 0.96 arcsec, following a lognormal distribution. Most seeing values fall between the 25th and 75th percentiles (0.72–1.12 arcsec), indicating minimal anomalies and confirming the site’s potential for high-resolution optical astronomy. Seasonal and monthly variations demonstrate notable stability, with months that have larger sample sizes, such as November, showing more stable conditions, while months with smaller sample sizes exhibit greater variability. Additionally, wind speed characteristics were analysed using 24 yr (2000–2023) data of ERA5, the fifth edition of the European Centre for Medium-Range Weather Forecasts. The wind speed distribution reveals an inverse relationship with atmospheric pressure, with stronger winds observed at higher altitudes and during winter months. Wavelet and autocorrelation analyses of upper level wind data (|$V_{200}$|) indicate periodicities at 0.5-, and 1-yr intervals, corresponding to seasonal and climatic cycles. A moderate positive correlation between seeing and |$V_{200}$| suggests that high-altitude atmospheric dynamics influence turbulence, though ground-layer effects and seasonal variations also contribute. This study offers essential insights for enhancing the observational capabilities of the existing telescopes at the Muztagh-Ata site and for advancing future research in adaptive optics.
1 INTRODUCTION
An exceptional ground-based optical astronomy site is assessed based on key factors such as meteorological conditions, atmospheric turbulence, and environmental influences. Core parameters, including photometric night fraction, sky brightness, atmospheric transparency, extinction coefficient, and seeing, are essential for evaluating site quality, as they directly impact observational accuracy and scientific outcomes. Exceptional sites like the Atacama Desert in Chile (Patat 2003, 2008), Mauna Kea in Hawaii (Erasmus 1986; Krisciunas et al. 1987), and La Palma in the Canary Islands (Lombardi et al. 2006, 2007) are recognized for their outstanding observational conditions. Detailed methodologies for evaluating world-class sites are thoroughly documented in Schöck et al. (2009) and Vernin et al. (2011). In China, early optical telescopes, mostly 2-m-class, are located at the Xinglong Station of the National Astronomical Observatories (Zhang et al. 2015, 2016, 2020) and the Lijiang Station of the Yunnan Observatories (Wang et al. 2019; Xin et al. 2020). Considering the country’s topography, population density, and industrialization patterns, site surveys in western China’s high-altitude regions in recent years have identified promising locations (Cao et al. 2020), including the Muztagh-Ata site at the Pamir Platrau in Xinjiang (Feng et al. 2020).
The Muztagh-Ata site, situated in the Pamir Plateau, south-western China, is located at 38.343|$^{\circ }$|N, 74.890|$^{\circ }$|E, with an elevation of approximately 4500 m. The topographical features of the site, relevant to its evaluation for astronomical observations, are highlighted in the elevation map shown in Fig. 1. Its strategic geographical position offers significant potential for coordinated observations with other observatories worldwide, fostering enhanced global collaboration in astronomical research. The Muztagh-Ata site commenced site-testing activities in spring 2017, and a series of works detailing the monitoring and analysis of its observational conditions have been published over time, including ground meteorological information, astronomical observing time and sky brightness (Xu et al. 2020, 2023; Gu et al. 2024), atmospheric seeing and its variation with height and time (Xu et al. 2020; Wu et al. 2024), characteristics of the atmospheric surface layer (Xu et al. 2020; Gu et al. 2024), and long-term astroclimate parameters, including precipitable water vapour and air temperature (Xu et al. 2022; Zhang et al. 2024). These studies confirm the site’s observational quality, with a median seeing of 0.82 arcsec, underscoring its suitability for high-resolution optical astronomy (Xu et al. 2020). Given the operation of existing and planned facilities, a detailed analysis of atmospheric turbulence and wind speed distributions is crucial for optimizing observational capabilities.
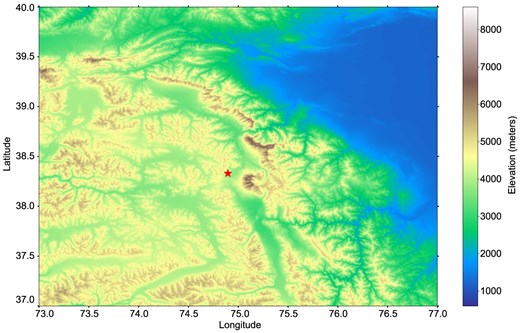
An elevation map of the Muztagh-Ata site (38.343|$^\circ$| N, 74.890|$^\circ$| E) on the Pamir Plateau, marked by a star at an altitude of approximately 4500 m above sea level. An elevation scale bar is provided on the right.
Atmospheric seeing, driven by turbulence in Earth’s atmosphere due to temperature gradients, wind shear, and moisture variations (Fried 1966), distorts starlight and degrades the performance of ground-based optical observations. To quantify seeing conditions, major observatories deploy dedicated instruments, with the Differential Image Motion Monitor (DIMM; Sarazin & Roddier 1990) being the most widely used. DIMM provides reliable measurements of astronomical seeing, making it a fundamental tool for site characterization and long-term monitoring.
Wind speed is a critical factor in optical astronomy, serving as a primary trigger for atmospheric turbulence (Hagelin, Masciadri & Lascaux 2010; Han et al. 2021). The vertical wind profile distribution is crucial for evaluating site quality, with stronger wind gradients increasing the likelihood of turbulence. Additionally, high near-surface winds can induce vibrations in the telescope and dome, degrading image quality. Vernin (1986) demonstrated a strong correlation between low 200 hPa pressure level (|$V_{200}$|) and improved optical turbulence conditions. With the systematic study of this theory, |$V_{200}$| typically represents the fastest winds and serves as a key indicator for evaluating the suitability of a site for astronomical observations (García-Lorenzo et al. 2005, 2009).
Vertical wind speed profiles are typically measured using techniques such as balloon-borne radiosondes (Azouit & Vernin 2005), generalized SCIDAR (scintillation detection and ranging; Masciadri et al. 2010). However, these methods are costly, require specialized technology, and pose significant challenges for long-term observations, particularly at high altitudes. As an alternative, global atmospheric reanalysis data sets, such as ERA5, produced by the European Centre for Medium-Range Weather Forecasts, offer a cost-effective approach for site characterization. ERA5 provides long-term atmospheric parameters, including wind speed, at high spatial and temporal resolution. With a horizontal resolution of 31 km, 137 vertical pressure levels from the surface to 0.01 hPa, and hourly outputs, ERA5 enables accurate characterization of wind speed distributions and turbulence characteristics, making it particularly suitable for astronomical site assessments (Hersbach et al. 2020).
Due to the accuracy and completeness of the ERA5 data base, it has been successfully applied to the analysis of observational conditions at various international astronomical sites, including established locations such as the South Pole and Chajnantor (Atacama), as well as newer sites like Ali (Tibet), Dome A (Antarctica), and Summit Camp (Greenland) (Kuo 2017), the Chajnantor area (northern Chile) (Cortés et al. 2020), the Llano de Chajnantor (Atacama), and the Cerro Paranal (Antofagasta) (Valeria, Martínez-Ledesma & Reeves 2024). The validity of ERA5 data for weather parameters like wind speed has been confirmed through correlation analysis at Kupang (Priyatikanto et al. 2024). Additionally, the correlation between DIMM seeing and ERA5 derived V|$_{200}$| sheds light on turbulence-induced image quality effects, complementing studies like CFHT’s on the impact of wind and thermal conditions on observatory seeing (Salmon et al. 2009). Floyd, Thomas-Osip & Prieto (2010) demonstrate that large telescopes such as Magellan often achieve better image quality than that indicated by DIMM-measured seeing, emphasizing the discrepancies between ground-based measurements and high-altitude atmospheric data.
The structure of this study is as follows: The astronomical conditions at the Muztagh-Ata site are analysed using DIMM seeing data from 2017 to 2022 and ERA5 |$V_{200}$| data spanning 2000 to 2023. The annual and monthly statistical properties of the seeing data are examined in Section 2. Section 3 provides a detailed analysis of the vertical wind speed profiles derived from ERA5 data, covering aspects such as the pressure and wind speed relationship, seasonal variations in wind speed, the correlation between height and wind speed, and the temporal variability of |$V_{200}$| through wavelet and autocorrelation analyses. In Section 4, correlation analyses are conducted to explore potential relationships between seeing and |$V_{200}$| data. Section 5 provides a summary of the main findings and conclusions.
2 SEEING DATA SET AND METHODOLOGY
2.1 DIMM instrument
To maintain data consistency and facilitate long-term comparative analysis, we have standardized the use of DIMM monitoring data from the Nanjing Institute of Astronomical Optics & Technology (NIAOT). This instrument was officially deployed in 2017 November and has since provided a continuous series of observational data. The comparison between the NIAOT DIMM and the internationally recognized French DIMM was conducted from 2018 September 21 to November 20. The validation results confirmed the reliability of the NIAOT DIMM data (Xu et al. 2020).
Fig. 2 illustrates the DIMM system installed at the Muztagh-Ata astronomical site. The left panel provides a panoramic view of the DIMM on a 6-m-high observation tower, highlighting its strategic placement for minimizing ground-layer turbulence and maximizing atmospheric stability. The right panel presents a close-up image of the DIMM instrument, showcasing its compact and robust design, which is optimized for long-term high-precision astronomical seeing measurements under challenging environmental conditions.
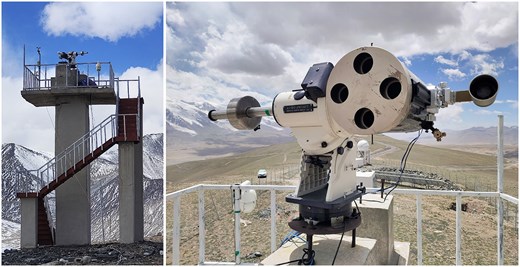
Left: a panoramic view of the NIAOT DIMM installed on the 6-m observation tower at the Muztagh-Ata site. Right: a close-up image of the DIMM instrument.
The technical parameters and specifications of the NIAOT DIMM are summarized in Table 1. The telescope has an aperture of 304.8 mm and operates with a focal ratio of |$f/8$|, corresponding to a focal length of 1600 mm. The DIMM utilizes four sub-apertures, each with a diameter of 50 mm and separated by a distance of 149 mm. Observations are captured using a Basler aca 2040 detector with a resolution of |$2k \times 2k$| pixels, and a pixel size of |$5.5 \, \mu \text{m} \times 5.5 \, \mu \text{m}$|. Typical exposure times are either 5 or 10 ms, with observations centred at a wavelength of 500 nm. The system outputs one seeing measurement per minute, converted to zenith conditions without applying scaling for exposure time.
Parameters and technical specifications of the NIAOT DIMM.
| NIAOT DIMM | Specifications |
|---|---|
| Telescope aperture (mm) | 304.8 |
| Focal ratio | f/8 |
| Focal length (mm) | 1600 |
| Sub-apertures | 4 |
| Sub-aperture diameters (mm) | 50 |
| Sub-aperture distance (mm) | 149 |
| Detector | Basler aca 2040, 2k |$\times$| 2k (5.5 |$\mu$|m) |
| Exposure time | 5 ms or 10 ms |
| Wavelength (nm) | 500 |
| Output frequency | 1 seeing value for every minute |
| Scaling and conversion | Convert to zenith |
| No exposure time scaling |
2.2 Seeing data statistic
The NIAOT DIMM was deployed at different heights to evaluate the impact of ground-layer turbulence on seeing, as summarized in Table 2. To ensure consistency and accuracy in the long-term analysis of seeing conditions at the Muztagh-Ata site, only the DIMM data collected from tower with 6-m height are used in this study, providing a reliable data set for future site characterization.
Observation periods of the NIAOT DIMM at different heights.
| Observation height | Observation period |
|---|---|
| Ground level (0 m) | 2017 March 12–14 November |
| 6-m tower | 2017 November 15–2018 September 20 |
| 2018 November 21–Present | |
| 11-m tower | 2018 September 21–November 20 |
| Observation height | Observation period |
|---|---|
| Ground level (0 m) | 2017 March 12–14 November |
| 6-m tower | 2017 November 15–2018 September 20 |
| 2018 November 21–Present | |
| 11-m tower | 2018 September 21–November 20 |
Table 3 presents the statistical summary of seeing measurements from the NIAOT DIMM at the Muztagh-Ata site between 2017 and 2022, detailing the total number of data points, the percentage of valid measurements, and occurrences of seeing values equal to 0 arcsec or exceeding 5 arcsec. While most data fall within the expected range, a small number of extreme values exceeding 5 arcsec were recorded in 2017 and 2018. These values were excluded as they fall outside the valid atmospheric seeing range and are unrepresentative of typical conditions. The majority of these outliers, often reaching tens or even 200 arcsec, likely result from instrumental errors or transient atmospheric disturbances rather than actual turbulence-driven seeing. Their removal, having a negligible impact on the overall distribution, ensures a more accurate and reliable characterization of the site’s seeing conditions.
Statistic of the seeing data from NIAOT DIMM (2017–2022).
| Year | Total data | Valid seeing (per cent) | Seeing = 0|$^{\prime \prime }$| | Seeing > 5|$^{\prime \prime }$| |
|---|---|---|---|---|
| 2017 | 9351 | 97.17 | 1 | 264 |
| 2018 | 31 213 | 99.55 | 0 | 142 |
| 2019 | 34 626 | 100.00 | 0 | 0 |
| 2020 | 16 514 | 100.00 | 0 | 0 |
| 2021 | 13 117 | 100.00 | 0 | 0 |
| 2022 | 8571 | 100.00 | 0 | 0 |
Fig. 3 illustrates the statistical distribution of seeing measurements at the Muztagh-Ata site from 2017 to 2022, which follows a lognormal distribution. The histogram (left axis) represents the frequency distribution of seeing values within the specified range (0–5 arcsec), while the red curve (right axis) shows the cumulative distribution normalized to 100 per cent. Key statistical metrics, including the median, mean, and the 25th and 75th percentiles, are indicated by vertical dashed lines. Invalid seeing values (i.e. those equal to 0 or greater than 5 arcsec) are excluded from the plot, with the total count of valid data points (112 985) displayed.
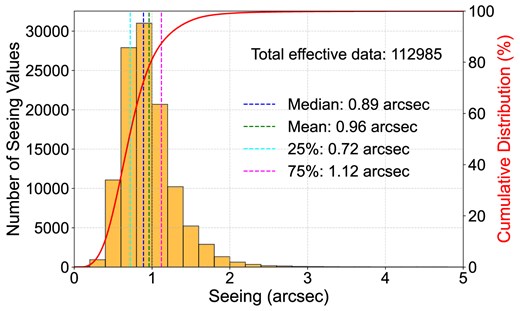
Distribution and cumulative distribution of the seeing values at the Muztagh-Ata site (2017–2022), with key statistical markers: median (blue), mean (green), 25th percentile (cyan), and 75th percentile (magenta).
As expected for a lognormal distribution, the median seeing value (0.89 arcsec) is lower than the mean (0.96 arcsec), reflecting the positively skewed nature of the data. This characteristic deviation between mean and median arises because seeing values, as a positive-definite random variable, tend to follow a multiplicative process rather than a symmetric Gaussian distribution. The 25th and 75th percentiles are 0.72 and 1.12 arcsec, respectively, defining the interquartile range (IQR) where most measurements are concentrated. These findings confirm that the seeing conditions at the Muztagh-Ata site are well suited for astronomical observations, with the majority of measurements falling within a favourable range for high-resolution optical astronomy and long-term monitoring programs.
2.3 Annual seeing variations
The statistical summary of seeing measurements at the Muztagh-Ata site from 2017 to 2022 is presented in Table 4. The data set includes over 112 000 effective data points, providing a solid foundation for characterizing the long-term astroclimate conditions at the site. The median seeing values range from 0.80 arcsec in 2019 to 1.07 arcsec in 2021, demonstrating noticeable annual variation in atmospheric turbulence. These fluctuations are indicative of changing climatic influences, offering valuable insight into the variability of site conditions for astronomical observations.
Statistical summary of seeing measurements from 2017 to 2022.
| Year | Effective data | Seeing statistics (arcsec) | ||||
|---|---|---|---|---|---|---|
| Median | Std | Mean | 25 per cent | 75 per cent | ||
| 2017 | 9086 | 1.03 | 0.47 | 1.11 | 0.83 | 1.29 |
| 2018 | 31 071 | 0.86 | 0.41 | 0.94 | 0.68 | 1.09 |
| 2019 | 34 626 | 0.80 | 0.31 | 0.86 | 0.67 | 0.98 |
| 2020 | 16 514 | 0.94 | 0.29 | 0.99 | 0.78 | 1.15 |
| 2021 | 13 117 | 1.07 | 0.35 | 1.13 | 0.88 | 1.33 |
| 2022 | 8571 | 0.95 | 0.27 | 0.99 | 0.79 | 1.13 |
| Total | 112 985 | 0.89 | 0.36 | 0.96 | 0.72 | 1.12 |
Across the 6 yr, the IQR remained relatively consistent, typically spanning 0.3 to 0.4 arcsec. This consistency highlights the prevalence of moderately turbulent conditions, which are typical for high-altitude observing sites in complex mountainous regions. The mean seeing values also remained close to the median for each year, indicating the absence of extreme outliers or significant deviations from central tendencies. The ‘Total’ row provides an aggregate view of the data set, offering a broader perspective on the site’s long-term seeing characteristics.
Fig. 4 illustrates the annual seeing distributions from 2017 to 2022, with values predominantly ranging between 0.5 and 1.5 arcsec and a decreasing frequency at higher values. The cumulative distribution curves for each year further validate this trend, showing that the vast majority of seeing values are below 2.0 arcsec. Variability across different years reflects changes in atmospheric turbulence conditions, with 2019 exhibiting the most favourable median and IQR. These interannual differences highlight the necessity of continuous monitoring to characterize seasonal and long-term atmospheric effects on seeing quality.
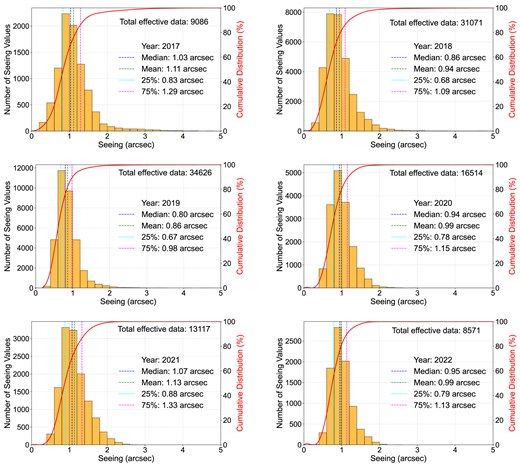
Annual seeing distributions (yellow histograms) and cumulative distribution functions (red lines) at the Muztagh-Ata site (2017–2022), with key statistical markers: median (blue), mean (green), 25th percentile (cyan), and 75th percentile (magenta).
2.4 Monthly seeing variations
Fig. 5 presents the monthly statistics of nighttime seeing data collected over 6 yr (2017–2022) at the Muztagh-Ata site. The data exhibit two distinct periods: a higher number of samples from September to January, likely due to longer nights and more favourable observing conditions, and a lower count from February to August, particularly in March, May, and June, where site maintenance and operational constraints may have further reduced observations. This distribution is consistent with the monthly variation in cloud cover and the number of photometric nights at the same site, as reported by Xu et al. (2023) for 2017–2021, suggesting that atmospheric conditions play a significant role in determining data availability.
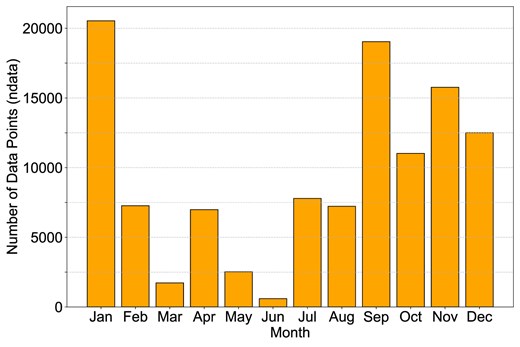
Monthly distribution of the number of data points (ndata) collected by the NIAOT DIMM from 2017 to 2022 for the Muztagh-Ata site.
Table 5 presents the monthly statistics for seeing measurements. Analysis of the data reveals that months with larger sample sizes, such as January, September, October, November, and December, exhibit more stable statistical characteristics, reflecting consistent seeing distributions. This conclusion is clearly validated in the raw seeing data (Tables 6 and 7), which provide monthly statistics from 2017 to 2022. Larger data sets (e.g. January, September, and November) demonstrate stable seeing with lower variability, while months with fewer data points (e.g. May and June) show higher variability and potential outliers. The inclusion of mean, median, standard deviation, and percentiles further highlights the stability of months like October and November, while December and June show greater fluctuations, emphasizing the need for larger data sets for accurate interpretation.
Monthly statistics of seeing data from 2017 to 2022.
| Month | Median | Std | Mean | 10 per cent | 25 per cent | 75 per cent | 90 per cent |
|---|---|---|---|---|---|---|---|
| Jan | 0.92 | 0.32 | 0.97 | 0.60 | 0.74 | 1.13 | 1.40 |
| Feb | 0.88 | 0.49 | 0.98 | 0.60 | 0.71 | 1.10 | 1.36 |
| Mar | 0.95 | 0.29 | 0.99 | 0.65 | 0.78 | 1.13 | 1.37 |
| Apr | 0.93 | 0.27 | 0.96 | 0.67 | 0.78 | 1.10 | 1.29 |
| May | 0.81 | 0.25 | 0.84 | 0.58 | 0.68 | 0.96 | 1.11 |
| Jun | 0.95 | 0.59 | 1.14 | 0.65 | 0.75 | 1.25 | 1.99 |
| Jul | 0.85 | 0.23 | 0.88 | 0.62 | 0.71 | 1.01 | 1.17 |
| Aug | 1.03 | 0.37 | 1.10 | 0.72 | 0.84 | 1.30 | 1.56 |
| Sep | 0.92 | 0.33 | 0.98 | 0.66 | 0.77 | 1.10 | 1.34 |
| Oct | 0.78 | 0.25 | 0.82 | 0.54 | 0.65 | 0.94 | 1.15 |
| Nov | 0.81 | 0.33 | 0.88 | 0.53 | 0.65 | 1.06 | 1.35 |
| Dec | 1.06 | 0.51 | 1.13 | 0.56 | 0.78 | 1.41 | 1.71 |
Monthly statistics of seeing data for 2017–2022, highlighting the data count and the 10th and 90th percentiles for each month.
| Month | 2017 | 2018 | 2019 | 2020 | 2021 | 2022 | ||||||||||||
|---|---|---|---|---|---|---|---|---|---|---|---|---|---|---|---|---|---|---|
| ndata | 10 per cent | 90 per cent | ndata | 10 per cent | 90 per cent | ndata | 10 per cent | 90 per cent | ndata | 10 per cent | 90 per cent | ndata | 10 per cent | 90 per cent | ndata | 10 per cent | 90 per cent | |
| Jan | – | – | – | 11395 | 0.57 | 1.33 | – | – | – | 5006 | 0.63 | 1.44 | 2494 | 0.82 | 1.44 | 1642 | 0.74 | 1.54 |
| Feb | – | – | – | 6107 | 0.59 | 1.43 | – | – | – | – | – | – | – | – | – | 1162 | 0.65 | 1.12 |
| Mar | – | – | – | 1193 | 0.61 | 1.17 | – | – | – | – | – | – | – | – | – | 536 | 0.88 | 1.55 |
| Apr | – | – | – | 1367 | 0.69 | 1.06 | 1032 | 0.55 | 1.10 | – | – | – | 1883 | 0.76 | 1.46 | 2703 | 0.67 | 1.31 |
| May | – | – | – | – | – | – | 2494 | 0.58 | 1.11 | – | – | – | 18 | 0.95 | 1.48 | 12 | 0.88 | 1.43 |
| June | – | – | – | – | – | – | 523 | 0.64 | 2.07 | – | – | – | – | – | – | 71 | 0.77 | 1.00 |
| July | – | – | – | – | – | – | 4452 | 0.61 | 1.10 | 1661 | 0.59 | 1.18 | 1020 | 0.79 | 1.20 | 657 | 0.75 | 1.37 |
| Aug | – | – | – | 3863 | 0.75 | 1.65 | 3213 | 0.69 | 1.40 | – | – | – | – | – | – | 146 | 0.90 | 1.48 |
| Sept | – | – | – | 1453 | 0.52 | 1.10 | 10094 | 0.64 | 1.33 | 6145 | 0.77 | 1.38 | 859 | 0.78 | 1.22 | 488 | 0.72 | 1.26 |
| Oct | – | – | – | – | – | – | 6196 | 0.49 | 1.02 | 3702 | 0.63 | 1.34 | 254 | 0.71 | 0.98 | 872 | 0.66 | 1.21 |
| Nov | 4009 | 0.54 | 1.52 | 2660 | 0.38 | 1.17 | 6242 | 0.53 | 1.12 | – | – | – | 2857 | 0.63 | 1.59 | – | – | – |
| Dec | 5077 | 0.74 | 1.67 | 3033 | 0.41 | 1.62 | 380 | 0.45 | 0.79 | – | – | – | 3732 | 0.85 | 1.80 | 282 | 0.67 | 1.26 |
Monthly statistics of seeing data for 2017–2022, showing the mean, median, standard deviation, and 25th and 75th percentiles for each month.
| Month | 2017 | 2018 | 2019 | ||||||||||||
|---|---|---|---|---|---|---|---|---|---|---|---|---|---|---|---|
| Mean | Median | Std | 25 per cent | 75 per cent | Mean | Median | Std | 25 per cent | 75 per cent | Mean | Median | Std | 25 per cent | 75 per cent | |
| Jan | – | – | – | – | – | 0.91 | 0.84 | 0.33 | 0.68 | 1.04 | – | – | – | – | – |
| Feb | – | – | – | – | – | 1.01 | 0.88 | 0.53 | 0.71 | 1.13 | – | – | – | – | – |
| Mar | – | – | – | – | – | 0.89 | 0.87 | 0.24 | 0.71 | 1.02 | – | – | – | – | – |
| Apr | – | – | – | – | – | 0.88 | 0.88 | 0.15 | 0.78 | 0.97 | 0.82 | 0.80 | 0.21 | 0.66 | 0.94 |
| May | – | – | – | – | – | – | – | – | – | – | 0.84 | 0.80 | 0.25 | 0.68 | 0.96 |
| June | – | – | – | – | – | – | – | – | – | – | 1.17 | 0.99 | 0.62 | 0.74 | 1.34 |
| July | – | – | – | – | – | – | – | – | – | – | 0.83 | 0.80 | 0.20 | 0.68 | 0.95 |
| Aug | – | – | – | – | – | 1.19 | 1.13 | 0.40 | 0.91 | 1.39 | 0.99 | 0.92 | 0.30 | 0.78 | 1.14 |
| Sept | – | – | – | – | – | 0.78 | 0.73 | 0.28 | 0.60 | 0.87 | 0.96 | 0.88 | 0.37 | 0.74 | 1.07 |
| Oct | – | – | – | – | – | – | – | – | – | – | 0.74 | 0.72 | 0.21 | 0.59 | 0.86 |
| Nov | 1.00 | 0.96 | 0.36 | 0.76 | 1.22 | 0.77 | 0.74 | 0.29 | 0.59 | 0.96 | 0.78 | 0.73 | 0.24 | 0.62 | 0.88 |
| Dec | 1.20 | 1.09 | 0.53 | 0.88 | 1.34 | 0.84 | 0.68 | 0.47 | 0.52 | 1.04 | 0.61 | 0.57 | 0.16 | 0.50 | 0.69 |
| Month | 2020 | 2021 | 2022 | ||||||||||||
| Mean | Median | Std | 25 per cent | 75 per cent | Mean | Median | Std | 25 per cent | 75 per cent | Mean | Median | Std | 25 per cent | 75 per cent | |
| Jan | 1.01 | 0.97 | 0.31 | 0.78 | 1.18 | 1.11 | 1.07 | 0.24 | 0.93 | 1.28 | 1.05 | 0.97 | 0.31 | 0.83 | 1.20 |
| Feb | – | – | – | – | – | – | – | – | – | – | 0.86 | 0.84 | 0.18 | 0.73 | 0.98 |
| Mar | – | – | – | – | – | – | – | – | – | – | 1.19 | 1.16 | 0.27 | 1.00 | 1.36 |
| Apr | – | – | – | – | – | 1.10 | 1.06 | 0.30 | 0.89 | 1.22 | 0.97 | 0.94 | 0.26 | 0.78 | 1.12 |
| May | – | – | – | – | – | 1.14 | 1.09 | 0.22 | 1.00 | 1.13 | 1.12 | 1.13 | 0.28 | 0.96 | 1.27 |
| June | – | – | – | – | – | – | – | – | – | – | 0.89 | 0.88 | 0.10 | 0.82 | 0.96 |
| July | 0.86 | 0.81 | 0.27 | 0.68 | 0.99 | 0.99 | 0.99 | 0.16 | 0.88 | 1.09 | 1.04 | 1.02 | 0.26 | 0.85 | 1.20 |
| Aug | – | – | – | – | – | – | – | – | – | – | 1.17 | 1.15 | 0.25 | 1.00 | 1.34 |
| Sept | 1.05 | 1.00 | 0.26 | 0.87 | 1.18 | 0.99 | 0.98 | 0.17 | 0.87 | 1.11 | 0.99 | 0.96 | 0.23 | 0.83 | 1.10 |
| Oct | 0.92 | 0.84 | 0.28 | 0.71 | 1.05 | 0.85 | 0.84 | 0.11 | 0.77 | 0.92 | 0.91 | 0.88 | 0.22 | 0.74 | 1.06 |
| Nov | – | – | – | – | – | 1.03 | 0.93 | 0.39 | 0.74 | 1.25 | – | – | – | – | – |
| Dec | – | – | – | – | – | 1.34 | 1.33 | 0.37 | 1.05 | 1.58 | 0.94 | 0.89 | 0.24 | 0.80 | 1.04 |
Fig. 6 illustrates the monthly variation in seeing conditions over several years, including key statistics such as the mean, median, and percentile ranges (10 per cent, 25 per cent, 75 per cent, and 90 per cent). Months with larger sample sizes, such as October, demonstrate more stable seeing with lower variability, while June, with a smaller sample size, exhibits higher fluctuations and outliers. The median remains relatively stable across most months, while the 10 per cent and 90 per cent percentiles highlight the months with more variability. Overall, October shows the most consistent results, while June’s smaller data set leads to more pronounced fluctuations.
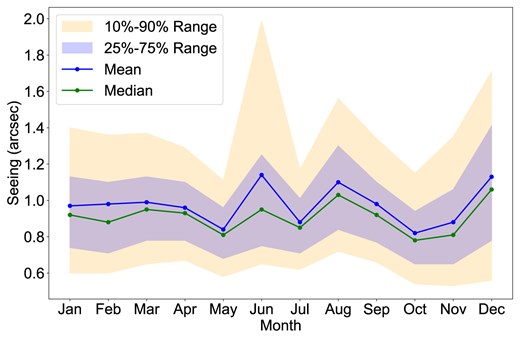
Monthly statistics of seeing conditions, showing the 10 per cent–90 per cent and 25 per cent–75 per cent ranges, along with the mean (blue) and median (green) values.
3 WIND-SPEED DISTRIBUTIONS WITH ERA5 DATA
3.1 ERA5 data set
To systematically analyse the distribution of long-term wind speed data at the Muztagh-Ata site, utilizing historical satellite data is an optimal approach. One such reliable source is the ERA5 data set, which provides comprehensive reanalysis of global climate and weather data over the past seven decades. Han et al. (2021) conducted a comparison between the measured radiosonde data and the corresponding ERA5 reanalysis data at the Lhasa and Gaomeigu sites above the Tibetan Plateau in China. The error analysis demonstrates the reliability of the ERA5 reanalysis data in accurately representing the local long-term meteorological parameters, which supports its use for studying wind speed and atmospheric variables at the Muztagh-Ata site.
The specific location and surrounding topography of the Muztagh-Ata site are shown in Fig. 1, and ERA5 wind speed data from 2000 to 2023 have been analysed. While ERA5 provides insights into kinetic turbulence by capturing variations in wind patterns, it does not measure optical turbulence, which arises from refractive index fluctuations in the atmosphere and directly impacts astronomical image quality. Nevertheless, the high temporal resolution of ERA5 enables a detailed characterization of wind speed distributions and atmospheric dynamics, offering valuable context for understanding local conditions that may influence astronomical observations.
3.2 Wind speed distribution statistics
The site parameters were measured at the Muztagh-Ata site, located at an elevation of approximately 4500 m above sea level, corresponding to a pressure of around 587 hPa (Xu et al. 2020). Wind speed and altitude data are provided for pressures ranging from 1 to 550 hPa, with the altitude at 550 hPa reaching approximately 4860 m. Table 8 presents the monthly median wind speed data at various altitudes and pressure levels at the Muztagh-Ata site, derived from the ERA5 data set covering the period from 2000 to 2023. Wind speed data corresponding to 200 hPa (V|$_{200}$|) are highlighted in bold in the table.
Monthly median wind speed data with various heights and pressure levels at the Muztagh-Ata site based on ERA5 data set from 2000 to 2023.
| Pressure (hPa) | Monthly wind speed (m s−1) | Height (km) | |||||||||||
|---|---|---|---|---|---|---|---|---|---|---|---|---|---|
| Jan | Feb | Mar | Apr | May | June | July | Aug | Sept | Oct | Nov | Dec | ||
| 550 | 4.59 | 5.28 | 4.78 | 3.60 | 3.22 | 2.11 | 1.08 | 1.13 | 2.82 | 4.27 | 5.54 | 5.47 | 4.86 |
| 500 | 10.77 | 12.23 | 9.80 | 7.48 | 5.65 | 4.01 | 3.35 | 3.95 | 5.76 | 7.23 | 10.74 | 11.90 | 5.57 |
| 450 | 14.12 | 16.04 | 12.68 | 10.19 | 8.05 | 6.54 | 7.17 | 8.01 | 9.41 | 9.83 | 13.83 | 14.81 | 6.34 |
| 400 | 16.83 | 18.67 | 14.87 | 11.86 | 9.75 | 8.41 | 10.25 | 11.19 | 11.93 | 11.66 | 16.17 | 17.48 | 7.18 |
| 350 | 19.63 | 21.44 | 16.80 | 13.56 | 11.51 | 10.92 | 14.19 | 16.13 | 15.44 | 13.65 | 19.10 | 20.24 | 8.11 |
| 300 | 22.53 | 24.75 | 19.45 | 16.20 | 13.91 | 14.84 | 20.03 | 22.57 | 20.51 | 16.71 | 22.66 | 23.76 | 9.16 |
| 250 | 26.67 | 28.14 | 23.37 | 19.61 | 17.64 | 22.38 | 25.67 | 26.71 | 27.53 | 21.11 | 27.41 | 28.94 | 10.35 |
| 225 | 28.76 | 29.61 | 25.25 | 20.93 | 19.76 | 26.05 | 27.30 | 28.67 | 30.54 | 23.45 | 29.49 | 30.75 | 11.03 |
| 200 | 30.77 | 30.56 | 25.87 | 22.19 | 22.54 | 28.10 | 28.01 | 30.04 | 32.50 | 25.60 | 30.13 | 31.72 | 11.77 |
| 175 | 31.03 | 30.27 | 26.01 | 23.49 | 24.88 | 28.95 | 27.52 | 30.07 | 32.81 | 26.83 | 31.27 | 33.20 | 12.58 |
| 150 | 30.90 | 29.45 | 25.57 | 22.98 | 24.98 | 27.46 | 26.01 | 27.37 | 30.80 | 26.50 | 30.99 | 32.49 | 13.50 |
| 125 | 30.02 | 29.18 | 24.57 | 21.40 | 22.45 | 23.51 | 21.89 | 22.41 | 26.34 | 24.48 | 29.08 | 30.59 | 14.55 |
| 100 | 27.54 | 26.41 | 21.24 | 18.07 | 17.16 | 16.44 | 14.70 | 14.67 | 18.61 | 19.57 | 25.40 | 27.65 | 15.79 |
| 70 | 22.67 | 21.18 | 15.71 | 10.68 | 6.89 | 3.93 | 2.36 | 2.32 | 7.24 | 12.54 | 19.53 | 21.38 | 17.66 |
| 50 | 19.05 | 15.77 | 10.27 | 4.96 | 1.44 | 4.18 | 7.16 | 4.81 | 1.51 | 9.06 | 16.64 | 18.64 | 19.31 |
| 30 | 16.98 | 12.86 | 9.17 | 3.99 | 1.70 | 8.36 | 12.24 | 9.70 | 1.90 | 9.90 | 17.60 | 18.33 | 21.62 |
| 20 | 16.18 | 11.95 | 12.35 | 6.69 | 2.90 | 9.11 | 14.63 | 11.82 | 3.20 | 10.95 | 20.88 | 22.70 | 23.31 |
| 10 | 16.24 | 9.92 | 17.60 | 12.48 | 2.52 | 11.62 | 18.51 | 14.86 | 3.22 | 10.42 | 30.27 | 27.32 | 25.90 |
| 1 | 17.72 | 30.42 | 16.64 | 5.05 | 12.91 | 33.79 | 42.60 | 33.84 | 6.52 | 18.35 | 60.21 | 26.33 | 32.43 |
The monthly median vertical profile variations in wind speed distribution over the 24-yr period from 2000 to 2023 exhibit distinct patterns influenced by seasonal atmospheric dynamics in Fig. 7. The solid line represents the median wind speed, calculated from ERA5 reanalysis data, for each month from 2000 to 2023 at the Muztagh-Ata site. The dashed lines indicate the first and third quartiles, highlighting the IQR of the wind speed data.
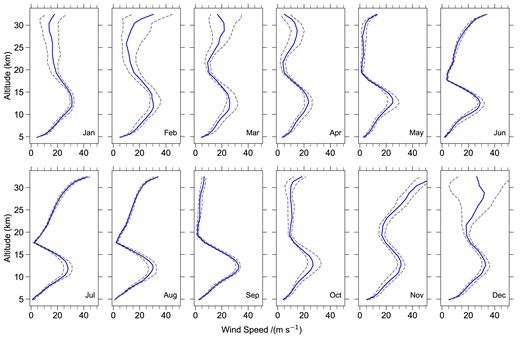
The median wind speed, calculated from ERA5 reanalysis data, is shown for each month from 2000 to 2023 at the Muztagh-Ata site (solid line). The dashed lines represent the first and third quartiles, illustrating the IQR of the wind speed data.
3.3 Pressure and wind speed relationship
The wind speed exhibits a clear inverse relationship with atmospheric pressure: as pressure decreases, wind speed increases, especially at lower pressure levels (below 200 hPa). This trend is particularly pronounced in the pressure range from 200 to 1 hPa, where wind speeds at the 1 hPa level reach a peak of 60.21 m s−1 in November, which is significantly higher than the wind speeds observed at 200 hPa (around 32.50 m s−1). This indicates that wind speeds are considerably stronger at higher altitudes and lower pressures, likely due to the enhanced atmospheric dynamics such as intensified temperature gradients, the presence of jet streams, and increased atmospheric instability at higher altitudes.
In contrast, at higher pressure levels, such as 550 and 500 hPa, wind speeds are generally much weaker. This is especially true during the summer months, when wind speeds at these levels can drop below 2 m s−1, reflecting the more stable and less turbulent atmospheric conditions that characterize summer. The reduced wind speeds at these pressure levels during summer months suggest a more stratified atmosphere with weaker thermal gradients, leading to lower atmospheric activity and reduced wind shear near the surface. This stability is typically associated with the absence of strong weather systems, such as cyclones or jet streams, which contribute to more dynamic and turbulent conditions in the atmosphere.
3.4 Seasonal variations in wind speed
Wind speed exhibits clear seasonal variations, with higher values generally observed during the winter months, particularly at higher altitudes. For instance, at 200 hPa, wind speeds during winter (December and January) are around 30 m s−1, whereas in the summer (e.g. July), they decrease to approximately 28.01 m s−1. This seasonal variation indicates that atmospheric conditions at higher altitudes are more dynamic during winter, likely due to enhanced upper level atmospheric activity, such as more intense jet streams and larger temperature gradients, which contribute to stronger wind speeds. The winter season is marked by more active atmospheric dynamics, leading to higher wind speeds in the upper atmosphere, a pattern that weakens during the summer months.
In contrast, wind speeds in the spring months (March, April, and May) are generally lower, especially at higher pressure levels (such as 200 and 300 hPa). The atmosphere during spring is typically more stratified, with smaller temperature gradients, which results in lower wind speeds. The lower wind speeds during spring are likely due to the more stable atmospheric conditions typically associated with this transitional period. During spring, the lack of strong atmospheric disturbances and the relative stability of the atmospheric layers lead to weaker winds compared to both the winter and summer months.
In the summer (June, July, and August), wind speeds at lower altitudes are notably lower. For instance, at pressure levels like 550 and 500 hPa, wind speeds often drop below 2 m s−1, indicating a more stable lower atmosphere during this period. The lower atmosphere in summer is typically warmer and more stable, with weaker temperature gradients and less active weather systems. This leads to a quieter atmosphere with reduced wind shear and lower wind speeds compared to the more turbulent winter conditions.
Overall, the seasonal variation in wind speed is influenced by factors such as atmospheric pressure systems, temperature gradients, and atmospheric stratification. Winter winds are stronger at higher altitudes due to increased atmospheric activity and enhanced jet streams, while spring and summer show reduced wind speeds due to more stable atmospheric conditions and weaker temperature gradients. These seasonal differences provide valuable insights into the dynamics of the atmosphere across different times of the year.
3.5 Height and wind speed correlation
There is a strong positive correlation between wind speed and altitude, particularly at lower pressure levels. As altitude increases, wind speed generally increases as well, especially in the higher pressure regions. At altitudes above 200 hPa (approximately 11.77 km), wind speeds remain relatively high, with minimal seasonal variation. For instance, wind speeds at 200 hPa during the winter months (December and January) are consistently around 30 m s−1. This trend suggests that, beyond this altitude, the atmospheric conditions contribute to stronger wind speeds with little fluctuation across seasons.
However, at altitudes exceeding 20 km, the atmosphere transitions into the stratosphere, where the temperature increases nearly adiabatically, leading to a negligible potential temperature gradient. In this region, even strong kinetic turbulence does not generate optical turbulence. Therefore, wind speed variations at such high altitudes are not directly relevant to astronomical seeing conditions.
Overall, the correlation between wind speed and altitude highlights the significant role that atmospheric dynamics play at higher altitudes. While lower altitudes exhibit more stable and seasonal fluctuations in wind speed, wind variations in the upper atmosphere may be shaped by multiple factors, including large-scale jet streams and stratospheric circulation, which likely play a dominant role in wind dynamics at these elevations.
3.6 Temporal variability of wind speed
|$V_{200}$| refers to the wind speed at the 200 hPa pressure level, which is located near the tropopause. This level typically lies between the troposphere and stratosphere, at an altitude of approximately 10–12 km, with variations depending on atmospheric pressure and seasonal changes. Due to its relatively high wind speeds and the influence of upper atmospheric dynamics, such as jet streams and temperature gradients, |$V_{200}$| is often the maximum wind speed value in the wind speed profile. It exhibits significant seasonal and weather-related fluctuations, particularly during the winter months when atmospheric activity is stronger, leading to peak wind speeds.
To examine the variability and temporal behaviour of |$V_{200}$| at the Muztagh-Ata site, wavelet analysis was performed on the monthly average time series of |$V_{200}$| from 2000 to 2023. The Morlet function, a simple and commonly used wavelet, was selected as the base function for this analysis. Fig. 8 presents the detailed results of the wavelet analysis on the monthly average |$V_{200}$| data. A ‘time-average’ test was conducted to estimate the 95 per cent confidence level for the average power spectrum, as shown in Fig. 8(c).
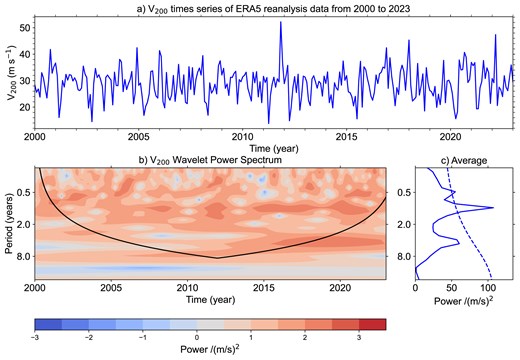
Wavelet analysis of the mean monthly |$V_{200}$| at the Muztagh-Ata site. (a) The |$V_{200}$| time series from the ERA5 reanalysis data set (2000–2023); (b) the local wavelet power spectrum of the time series using the Morlet wavelet; (c) the average wavelet power spectrum, with the dashed line indicating the 95 per cent confidence level.
The analysis of |$V_{200}$| data from 2000 to 2023 reveals distinct periodicities, identified through both the Wavelet Power Spectrum (shown in Fig. 8b) and the Autocorrelation Function (ACF) (presented in Fig. 9). The wavelet power spectrum highlights significant power at 0.5-, 1-, and 4-yr intervals (below 95 per cent confidence interval), corresponding to seasonal, semi-annual, and longer term climatic cycles. Similarly, the ACF analysis shows clear peaks at these same lags, further confirming the presence of these periodic patterns in the wind speed data. Together, these analyses suggest that the |$V_{200}$| at the Muztagh-Ata site exhibits a clear periodic structure, with dominant cycles occurring at 0.5, 1, and 4 yr, reflecting both short-term and long-term atmospheric and climatic influences.
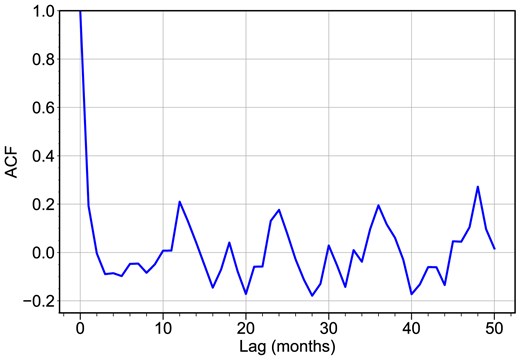
ACF of wind speed data at the Muztagh-Ata site, as defined earlier in the text.
For the Fig. 9, the ACF measures the correlation between a time series and its lagged versions. It is used to identify patterns, periodicity, and the temporal structure of the data. The ACF, ranging from −1 to 1, quantifies the relationship between a time series’ current and lagged values. An ACF close to 1 indicates strong positive correlation, suggesting similar values, while −1 implies strong negative correlation, where values are opposites. An ACF near 0 signifies no significant correlation, indicating random fluctuations. ACF is valuable for detecting seasonality and trends in time series data, revealing periodic patterns at specific frequencies.
The formula for the ACF at lag |$k$| is given by
where
|$X_t$| is the |$V_{200}$| value at time |$t$|.
- |$\bar{X}$| is the mean |$V_{200}$| of the time series, calculated as(2)$$\begin{eqnarray} \bar{X} = \frac{1}{n} \sum _{t=1}^{n} X_t . \end{eqnarray}$$
|$k$| is the lag, representing the number of periods between the current time point and the lagged value.
|$n$| is the total number of data points in the time series.
The annual periodicity of |$V_{200}$| at the Muztagh-Ata site was confirmed through both wavelet and ACF analyses. To illustrate the annual variation of |$V_{200}$|, Fig. 10 presents the average monthly behaviour of |$V_{200}$|. The results show that the average |$V_{200}$| is lowest during spring, with April marking the month of minimum wind speed throughout the year. There is a significant increase in |$V_{200}$| during autumn and winter, with an abrupt spike in wind speed observed in both June and September. The highest |$V_{200}$| value occurs in September. A sudden drop is observed in October, followed by a gradual increase.
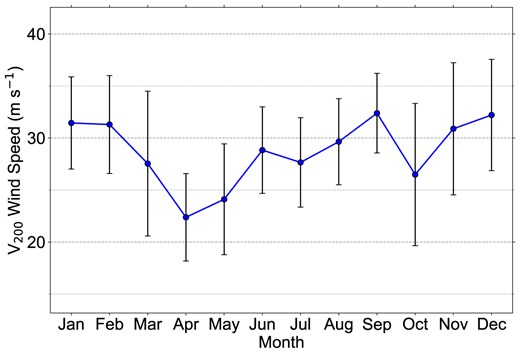
Monthly variations of |$V_{200}$| at the Muztagh-Ata site from 2000 to 2023, with error bars indicating standard deviations.
4 CORRELATION ANALYSIS BETWEEN SEEING AND WIND SPEEDS
Fig. 11 presents the monthly variation of mean seeing and 200 hPa wind speed |$V_{200}$| at the Muztagh-Ata site, revealing a clear seasonal pattern. Better seeing conditions are observed in May and October, while poorer seeing coincides with stronger upper atmosphere winds in winter and summer. This seasonal dependence suggests that high-altitude wind speed is a significant factor influencing atmospheric turbulence at the site.
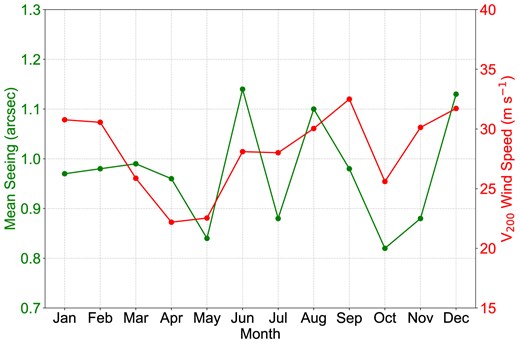
Monthly variations of mean seeing (green) and |$V_{200}$| (red) at the Muztagh-Ata site.
To further quantify this relationship, we analyse the correlation between |$V_{200}$| and seeing, as shown in Fig. 12. A moderate positive correlation is observed, in agreement with previous studies indicating that upper level wind speeds can influence turbulence (Vernin 1986). This analysis confirms that increased wind speeds at 200 hPa tend to degrade seeing conditions. While this correlation is evident, the observed scatter suggests that additional factors, such as ground-layer turbulence and seasonal variations, also contribute to the overall seeing conditions.
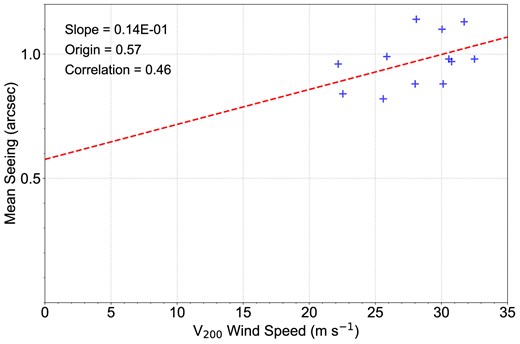
Scatter plot of the mean seeing (arcsec) versus the |$V_{200}$| at the Muztagh-Ata site.
These findings highlight the importance of upper level wind variations in site characterization and emphasize the need to account for their impact when optimizing telescope scheduling for high-resolution observations.
5 CONCLUSIONS
This study examines the vertical distribution of wind speed and optical turbulence above the Muztagh-Ata site, with a particular focus on their implications for astronomical applications. Using ERA5 data from the grid point closest to the site, we investigated the vertical variation in wind speed over a 24-yr period (2000–2023). This extensive data set provides crucial insights into the atmospheric conditions at the site. Additionally, we performed a comprehensive analysis of atmospheric seeing at the Muztagh-Ata site, utilizing 6 yr of seeing data (2017–2022) from the DIMM monitoring system. Additionally, we carried out a preliminary correlation analysis between seeing data and |$V_{200}$|, exploring their potential relationship. The key findings of our study are as follows:
The site exhibits stable seeing conditions, with a median of 0.89 arcsec and a mean of 0.96 arcsec. The distribution follows a lognormal pattern, with most measurements concentrated between the 25th and 75th percentiles (0.72–1.12 arcsec), confirming its suitability for high-resolution optical astronomy.
The annual seeing at the Muztagh-Ata site varies from 0.80 to 1.07 arcsec, with 2019 showing relatively better conditions. Monthly data exhibit two distinct periods: more favourable observing conditions from September to January, and reduced observations from February to August.
The wind speed distribution demonstrates an inverse correlation with atmospheric pressure, showing stronger winds at higher altitudes and during the winter months. Wavelet and autocorrelation analyses of |$V_{200}$| reveal periodicities at 0.5- and 1-yr intervals, reflecting seasonal and climatic cycles.
A moderate positive correlation between seeing and |$V_{200}$| suggests that high-altitude dynamics affect turbulence, with ground-level and seasonal factors also contributing.
The Muztagh-Ata site exhibits exceptional stability for high-resolution optical astronomical research, making it well-suited for long-term observations. These attributes make it an ideal location for advanced optical astronomy research.
ACKNOWLEDGEMENTS
The authors thank the reviewer for the constructive comments and valuable insights that have significantly improved the clarity and quality of this paper. This work was supported by the National Natural Science Foundation of China (NSFC Grants 12203005, 42304188, and U2031209), the National Key R&D Program of China (2021YFA0718500), the Tian-shan Talent Training Program (No. 2023TSYCLJ0053), the Tianshan Innovation Team Program of Xinjiang Uygur Autonomous Region, No. 2024D14015, the Chinese Academy of Sciences (CAS) ‘Light of West China’ Program (No. 2022-XBQNXZ-016), and the Natural Science Foundation of Xinjiang Uygur Autonomous Region (No. 2023D01A13).
DATA AVAILABILITY
The elevation data of Muztagh-Ata site marked in Fig. 1 are sourced from the AW3D data set of the Japan Aerospace Exploration Agency (JAXA), featuring a spatial resolution of 1 arcsec (approximately 30 m) and an elevation accuracy of 1 m. The ERA5 data used for analysis and research in this work were obtained from https://cds.climate.copernicus.eu/cdsapp#!/dataset/reanalysis-era5-pressure-levels?tab = form.
