


ABSTRACT
Red supergiants may lose significant mass during the final 100–1000 yr before core collapse, shaping their circumstellar environment. The supernova (SN) shockwave propagating through this environment forms a shock-swept dense shell that interacts with the surrounding circumstellar material (CSM), generating secondary shocks that energize the ejecta and may power the SN during the nebular phase. In this work, we investigate the nebular spectrum of SN 2023ixf, observed 1-yr post-explosion (at +363 d) with the recently commissioned WEAVE instrument on the 4.2 m William Herschel Telescope. This marks the first supernova spectrum captured with WEAVE. In this spectrum, H |$\alpha$| exhibits a peculiar evolution, flanked by blueward and redward broad components centred at |$\sim \pm 5650\, \mathrm{km\, s^{-1}}$|, features that have been observed in only a few SNe as early as 1-yr post-explosion. These features may indicate energy deposition from shock generated by the interaction of shock-swept dense shell with CSM expelled a few hundred years prior to the explosion. Comparisons of the +363 d spectrum with model spectra from the literature suggest a shock power of at least |$\sim 5 \times 10 ^{40}\, \mathrm{erg\, s^{-1}}$| at this epoch. Additionally, analysis of the [O i] doublet and other emission lines helped to constrain the oxygen mass (|$\lesssim 0.07-0.30 \, {\rm M_\odot}$|), He-core mass (|$\lesssim 3 \, {\rm M_\odot}$|), and zero-age main sequence mass (|$\lesssim 12 \, {\rm M_\odot}$|) for SN 2023ixf. The comparison with other Type II SNe highlights SN 2023ixf’s unique shock interaction signatures and evidence of dust formation, setting it apart in terms of evolution and dynamics.
1 INTRODUCTION
The properties of supernovae (SNe) are primarily governed by the characteristics of their progenitors and their surrounding environments, which are closely linked. The progenitor’s properties (e.g. mass, composition, metallicity, rotation, and magnetic field) not only play a critical role in determining overall ejecta morphology and the powering mechanisms – such as radioactive decay, ejecta heated by the central engine, or circumstellar material interaction (CSMI) – but also shape the surrounding environment.
Type II SNe are thought to originate from the core-collapse of red supergiants (RSGs) with a zero-age main sequence mass (|$M_{\rm ZAMS}$|) range of |$\sim 8-25 \, {\rm M_\odot}$| (Heger et al. 2003; Smartt 2009; Van Dyk 2017). The most direct method for probing the properties of SN progenitors is to investigate the pre-explosion images to identify the progenitor star. This approach is only feasible, however, for nearby SNe (Maund & Smartt 2005; Gal-Yam et al. 2007; Maund, Reilly & Mattila 2014; Maund 2017; Van Dyk 2017; Kilpatrick et al. 2023a; Pledger & Shara 2023). For distant SNe, the comparatively lower intrinsic luminosity of progenitor stars and spatial resolution limitations make direct detection highly challenging. Upcoming advanced facilities, such as the Large Synoptic Survey Telescope (LSST; LSST Science Collaboration 2009) are expected to significantly improve these capabilities (see Strotjohann et al. 2024). An alternative, indirect method of constraining the progenitor properties is through observations and modelling of the nebular spectra of SNe. During the nebular phase (|$\gtrsim 140\, \mathrm{d}$|), the spectrum is dominated by forbidden emission lines, whose luminosities, shapes, and line ratios provide valuable insights into the physical conditions within the ejecta, such as temperature, density, and the mass of the emitting material. These observations can help constrain key progenitor properties such as oxygen mass (|$M_{\rm O}$|), which is linked to the helium-core mass (|$M_{\rm He}$|), |$M_{\rm ZAMS}$|, as well as the explosion geometry (Uomoto 1986; Thielemann, Nomoto & Hashimoto 1996; Nomoto et al. 2006; Smartt 2009; Jerkstrand et al. 2014; Jerkstrand 2017; Dessart & Hillier 2020).
The process of mass-loss significantly impacts the evolution of massive stars and also plays a crucial role in the type of the emerged SN, see Filippenko (1997) and Modjaz, Gutiérrez & Arcavi (2019) for different classes and subclasses of SNe based on the observed properties. Several potential mechanisms exist by which massive stars undergo mass-loss, such as steady line-driven winds through radiation pressure (Chiosi & Maeder 1986; Curé & Araya 2023), eruptive episodes of mass-loss (Decin et al. 2006; Yoon & Cantiello 2010; Dupree et al. 2022; Bonanos et al. 2024; Qin et al. 2024), and/or mass-transfer to a binary companion through Roche Lobe overflow (Nomoto 1984; Podsiadlowski, Joss & Hsu 1992; Drout et al. 2023; Ercolino et al. 2024). Mass-loss from the progenitor can create a dense CSM (Yaron et al. 2017), which can subsequently interact with the SN ejecta to produce enhanced luminosity and emission features with narrow cores and broad wings, depending on the properties of CSM, e.g. density, extent, distribution, and mass of the CSM (Schlegel 1990; Stathakis & Sadler 1991; Kurfürst, Pejcha & Krtička 2020; Dessart & Hillier 2022). These environmental effects can significantly impact the observed light curve and spectral evolution of the SN (Meynet et al. 2015; Dessart2024).
A number of SNe in the literature exhibit signatures of ejecta interacting with CSM located close to the progenitor and expelled shortly before core collapse. On the other hand, late-time spectroscopic observations of SNe that probe the mass lost by the progenitor star in the hundreds to thousands of years before explosion are rare (see Dessart 2024 for a review). At early phases, the observed properties of SNe could be mainly governed by the thermal energy in the envelope stored during the explosion, whereas other powering sources contribute at later phases, e.g. late-time ejecta–CSM interaction, decay of radioactive elements and/or centrally located compact remanent such as magnetar (Arnett 1982; Chugai 1990; Chevalier & Fransson 1994; Kasen & Bildsten 2010; Dessart et al. 2023). In the nebular phase spectra of some SNe, broad boxy components of H |$\alpha$| are observed that indicate significant energy deposition by the shock generated through the interaction of the ejecta with the far-located dense CSM produced through the wind mass-loss (Chugai, Chevalier & Utrobin 2007; Gutiérrez et al. 2017; Dessart & Hillier 2022; Dessart et al. 2023). The contribution of such late-time interaction as a powering source can be seen in radio, |$X-$|ray, and |$\rm UV$|, whereas, in the optical, it can mainly be observed through H |$\alpha$| evolution and a knee in the R-band light curve; see Dessart et al. (2023) and references therein. The broad boxy components of H |$\alpha$| have been observed in the nebular spectra of a few SNe at different time-scales [|$\sim$|200 to 600 d, e.g. SNe 1993J (Matheson et al. 2000a, b), 2007it (Andrews et al. 2011), 2007od (Andrews et al. 2010), 2013by (Black et al. 2017), 2014G (Terreran et al. 2016), 2017eaw (Weil et al. 2020), 2017ivv (Gutiérrez et al. 2020), 2020a.m.v (Sollerman et al. 2021), and 2022jox (Andrews et al. 2024); indicating the contribution of interaction as the powering source at late-times (Chugai 1990; Dessart & Hillier 2022; Dessart et al. 2023)].
Nebular-phase spectroscopy serves as a powerful tool to probe the morphology of the ejecta, providing critical insights into asphericity through the profiles of emission lines. Approximately half of the well-observed SNe at nebular times exhibit features of asphericity, which can also be affected by factors such as clumpiness in the ejecta or the presence of dust (Maeda et al. 2008; Modjaz et al. 2008; Taubenberger et al. 2009; Mauerhan et al. 2017; Fang et al. 2024; Maund 2024). A pristine understanding of the explosion geometry offers valuable clues about the nature of potential progenitors and the mechanisms that drive these energetic events. Forbidden emission lines, especially the [O i] doublet |$\lambda \lambda$|6300, 6364, provide critical insights into ejecta geometry, progenitor mass, and nucleosynthesis (Taubenberger et al. 2009; Jerkstrand et al. 2014, 2015). In the literature (e.g. Maeda et al. 2002; Mazzali et al. 2005; Maeda et al. 2008; Modjaz et al. 2008; Tanaka et al. 2009; Taubenberger et al. 2009; Fang et al. 2024), double-peaked [O i] profiles in the nebular spectra of SNe have been interpreted as signatures of oxygen-rich ejecta distributed in a toroidal or disc-like configuration, potentially viewed off-axis. However, Milisavljevic et al. (2010) highlighted challenges with this interpretation, demonstrating that many such profiles can arise from the intrinsic doublet nature of [O i] |$\lambda \lambda$|6300, 6364, line blending, and radiative transfer effects.
This work investigates the nebular phase spectrum of one of the closest Type II SNe, SN 2023ixf, observed nearly 1-yr post-explosion. SN 2023ixf was discovered on 2023 May 19 (JD 2460084.4), in the nearby galaxy M101 at a distance of approximately |$6.85 \pm 0.15\, \mathrm{Mpc}$| (Itagaki 2023; Perley & Gal-Yam 2023). This proximity enabled extensive multiwavelength follow-up campaigns, shedding light on the progenitor system and explosion dynamics. Initial optical and |$\rm UV$| observations captured a rapid rise in brightness driven by shock cooling and strong ejecta interaction with a dense confined CSM (Bostroem et al. 2023; Hiramatsu et al. 2023; Hosseinzadeh et al. 2023; Jacobson-Galán et al. 2023; Smith et al. 2023; Teja et al. 2023; Yamanaka, Fujii & Nagayama 2023; Hu, Wang & Wang 2024; Kozyreva et al. 2024; Li et al. 2024; Singh et al. 2024; Yang et al. 2024; Zimmerman et al. 2024). Spectral flash-ionization features confirmed the presence of CSM close to the progenitor, while spectropolarimetric data revealed asymmetries in its structure (Smith et al. 2023; Vasylyev et al. 2023; Li et al. 2024; Shrestha et al. 2024; Singh et al. 2024). |$X-$|ray and radio observations further supported the existence of ejecta–CSM interaction at early times, providing constraints on the density and geometry of the CSM, which was expelled a few years before the core collapse (Grefenstette et al. 2023; Matthews et al. 2023; Chandra et al. 2024; Iwata et al. 2025; Nayana et al. 2024; Zimmerman et al. 2024). Pre-SN observations of the host site revealed the progenitor to be a RSG covered in dust, exhibiting periodic variability with a possible period of |$\sim$|1000 d, suggesting episodic mass-loss events before the explosion; however, the progenitor’s initial mass remains uncertain, with estimates ranging from 8 to 24 |$\, {\rm M_\odot}$|, reflecting discrepancies in analyses based on luminosity, variability, and stellar population models (Jencson et al. 2023; Kilpatrick et al. 2023b; Liu et al. 2023; Niu et al. 2023; Pledger & Shara 2023; Soraisam et al. 2023; Bersten et al. 2024; Fang et al. 2025; Moriya & Singh 2024; Neustadt, Kochanek & Smith 2024; Qin et al. 2024; Ransome et al. 2024; Van Dyk et al. 2024; Xiang et al. 2024). One year of optical light-curve evolution of SN 2023ixf is presented in Hsu et al. (2024), while the latest reported nebular spectrum at +259 d post-explosion is investigated in Ferrari et al. (2024), suggesting asymmetric ejecta and |$M_{\rm ZAMS} \sim 12 - 15 \, {\rm M_\odot}$|. Our current study explores the nebular spectrum at +363 d post-explosion, which represents a more developed nebular phase, providing complementary insights into the ejecta morphology and progenitor properties.
The paper is organized as follows: Section 2 describes the observations and data reduction; Section 3 discusses the spectral evolution of SN 2023ixf from +141 to +363 d, a detailed study of the nebular lines and geometry of the ejecta; an estimate of the mass of the progenitor is presented in Section 4; shock interaction signatures are discussed in Section 5; Section 6 presents the comparison of the nebular spectrum (at +363 d) of SN 2023ixf with other Type II SNe at similar epochs; and Section 7 summarizes our findings. Throughout this study, the phase is referenced in days since the explosion.
2 OBSERVATION AND DATA REDUCTION
The site of SN 2023ixf was observed with the 4.2 m William Herschel Telescope (WHT) using the WHT Enhanced Area Velocity Explorer (WEAVE) multi-object survey spectrograph (Dalton et al. 2012, 2016; Jin et al. 2024) on 2024 May 15 UT 23:51:16, as part of programme WS2024A2-005 (PI: Maund). WEAVE is a next-generation wide-field spectroscopic survey facility designed for high-efficiency spectral acquisition across large areas of the sky. Its Large Integral Field Unit (LIFU) mode provides spatially resolved spectroscopy over a field of view of approximately |$82.9 \times 92.4~\mathrm{arcsec}^{2}$|, allowing for simultaneous investigation of transient events and their host environments. WEAVE’s fibre-based design offers significant advantages in time-domain astronomy, facilitating rapid and high-quality follow-up observations. The instrument’s spectral resolution of |$R\sim 2500$| in the blue (3660–6060 Å) and red (5790–9590 Å) arms is well-suited for resolving broad and narrow spectral features in SNe, enabling precise characterization of ejecta kinematics and line profiles. Compared to other transient follow-up spectrographs, WEAVE provides a unique combination of moderate resolution and large-scale integral-field coverage, enhancing its capability to simultaneously capture the SN spectrum and map its host galaxy environment.
The observations of SN 2023ixf used WEAVE in its LIFU mode, where each fibre corresponded to a 2.6 arcsec diameter on the sky, providing spatial resolution for detailed spectral analysis. The seeing recorded at the beginning of the observation was 0.96 arcsec. The observation consisted of three dithered exposures of 1020 s each, utilizing both the blue and red arms of WEAVE with a spectral resolution of |$\approx 2500$|. The combined, dithered exposures covered an area of |$\approx 82.9 \times 92.4~\mathrm{arcsec}^{2}$|. The final stacked datacube was retrieved from the WEAVE Operational Repository. A Pan-STARRS1 image of the site of SN 2023ixf in M101, overlaid with the footprint of the WEAVE LIFU observations, alongside a colour composite image derived from the WEAVE datacube itself are shown in Fig. 1.

Left panel: Pan-STARRS1 image of the site of SN 2013ixf in M101, with the footprint of the WEAVE LIFU observation indicated by the hexagon. Right panel: the WEAVE datacube, with colours generated from wavelength regions in the blue and red arms corresponding to Sloan |$gri$|. In both panels, the SN position is indicated by the cross-hairs.
The spectrum was extracted by summing the flux across all wavelength bins within a 3×3 pixel region of interest (ROI) centred on the coordinates of SN 2023ixf, using a self-developed Python script. To ensure reliable flux measurements, calibration using the sensitivity function was applied. Post-calibration, following the method discussed in Kumar et al. (2021), the spectrum was smoothed using a Savitzky–Golay filter with a window length of 31 Å and a polynomial of the order of 3, reducing noise spikes while preserving key broad spectral features. The spectrum was shifted to the rest-wavelength assuming a redshift of M101 of z = 0.0008046 and de-reddened using |$E(B-V)_{\mathrm{MW+Host}} = 0.039 \pm 0.011\, \mathrm{mag}$| derived by Singh et al. (2024).
3 SPECTRAL EVOLUTION
The spectral evolution of SN 2023ixf from +141 to +363 d post-explosion is presented in Fig. 2. The spectra observed at +141 and +259 d are taken from Singh et al. (2024) and Ferrari et al. (2024), respectively. All three spectra have been normalized to their respective median flux values and a constant offset has also been applied, to facilitate clear comparisons of their features. All the prominent features are marked with colour-coded vertical lines, and their respective rest-frame wavelengths are written on the top. In the +363 d spectrum, narrow emission lines corresponding to H |$\beta$| and [O iii] |$\lambda$|5007 are observed at nearly zero velocity and are likely host galaxy emission lines (highlighted with grey dashed lines). Their alignment with the systemic velocity of the host supports this interpretation. However, given the ongoing evidence of shock–CSM interaction in SN 2023ixf (discussed in Section 5), these lines could also originate from the unshocked CSM. Further observations tracking the evolution of these lines are required to confirm their origin, as this study is based on a single spectrum.
![The comparison of the rest-frame spectra of SN 2023ixf at three different phases: +141 d (Singh et al. 2024), +259 d (Ferrari et al. 2024), and +363 d (this work). Prominent spectral features are labelled with vertical dashed lines at their respective rest-frame wavelengths. Atmospheric absorption bands, O$_2$ and H$_2$O, are indicated by shaded regions. Narrow emission lines corresponding to H $\beta$ and [O iii] $\lambda$5007, identified as galaxy emission lines are highlighted with dashed lines. The spectra are normalized and offsets have been applied for clarity. The interaction signatures as blueward and redward components of H $\alpha$, as discussed by Dessart et al. (2023), can be seen clearly in the spectra at +259 and +363 d.](https://oup.silverchair-cdn.com/oup/backfile/Content_public/Journal/mnras/538/2/10.1093_mnras_staf312/1/m_staf312fig2.jpeg?Expires=1750250714&Signature=ZuQLZ6pUQ1ErtF1XrNPBswHv3IHRdzbyvScO3IrT2caFxPhsJScpRHmX5me8U8x6PmD6DG2nfttkCQxwp~XJPLG3NsE3H-7pjdix0gGA7cKLhS3Ak2vfZNUQIexOtl1qwwpp6uPgixSI4338xjnaZ8MCsD2jahsocVbfSTDZWdwS0wpAPFKB1fTqnUYwOYBxbGQSxzIDFVldcRRzbLpNa9VGCHp1dVRSUNPUk-xH1PXG2B9tMWXItChq~kDcjUkKtBdktY58RAxayYSpWz1~o6uGSr1eqX~GhopngzBNPHXOWuy4-aI9xpFb6a6b0gU-XbE24-DtH2zEDf65pq5E-Q__&Key-Pair-Id=APKAIE5G5CRDK6RD3PGA)
The comparison of the rest-frame spectra of SN 2023ixf at three different phases: +141 d (Singh et al. 2024), +259 d (Ferrari et al. 2024), and +363 d (this work). Prominent spectral features are labelled with vertical dashed lines at their respective rest-frame wavelengths. Atmospheric absorption bands, O|$_2$| and H|$_2$|O, are indicated by shaded regions. Narrow emission lines corresponding to H |$\beta$| and [O iii] |$\lambda$|5007, identified as galaxy emission lines are highlighted with dashed lines. The spectra are normalized and offsets have been applied for clarity. The interaction signatures as blueward and redward components of H |$\alpha$|, as discussed by Dessart et al. (2023), can be seen clearly in the spectra at +259 and +363 d.
Notably, the blueward component of H |$\alpha$|, previously marked as unidentified by Ferrari et al. (2024) and not visible in the spectrum at +141 d (Singh et al. 2024), appears more prominent in our +363 d spectrum, along with a clearly visible redward component. These features are highlighted with green bands (see Fig. 2), likely indicating an interaction between a shock-swept dense shell with a CSM ejected nearly 100–1000 yr before the core-collapse, as suggested by Dessart et al. (2023). A detailed analysis of these features is provided in Section 5.
Additionally, the spectrum at +363 d exhibits diminished hydrogen line intensities, particularly H |$\alpha$|. In contrast, emission features on the blue side of 6000 Å become more prominent, dominated by Fe ii lines, alongside increasingly visible forbidden emission lines such as Mg i], the [O i] doublet, and [Ca ii] |$\lambda \lambda$|7291, 7324. These features clearly indicate cooling, decreasing ejecta density, and the transition to deeper, metal-rich ejecta layers. The O i|$\lambda$|7774 and Ca ii NIR triplet show a steady decline in strength, decreasing from +141 to +259 d and further fading at +363 d, showing decreasing ionization and recombination as the ejecta expands and cools.
3.1 Nebular lines study
The five most prominent lines – Mg i] |$\lambda$|4571, [O i] doublet, H |$\alpha$|, [Ca ii] |$\lambda \lambda$|7291, 7324, and Ca ii NIR triplet – in the spectra at +141, +259, and +363 d are compared in velocity space in Fig. 3, providing insights into the evolution of the expansion velocities and the physical conditions of the ejecta. For Mg i] |$\lambda$|4571, [O i] doublet, H |$\alpha$|, [Ca ii] |$\lambda \lambda$|7291, 7324, and Ca ii NIR triplet emission lines, the zero velocities are respectively taken at |$\lambda$|4571, |$\lambda$|6300, |$\lambda$|6563, |$\lambda$|7291, and |$\lambda$|8498 and shown with the vertical grey dashed lines. The rest wavelengths of other related lines, [O i] |$\lambda$|6364, [Ca ii] |$\lambda$| 7324, and Ca ii|$\lambda \lambda$|8542, 8662, in velocity space are marked with blue dashed lines in their respective panels. The presented features are normalized relative to the median flux values of emission-free regions adjacent to the corresponding emission lines.
![The evolution of Mg i], [O i] doublet, H $\alpha$, [Ca ii] $\lambda \lambda$7291, 7324, and Ca ii NIR triplet in the velocity space is presented, with each line highlighted in a separate panel. The zero velocity for each line is marked at $\lambda$6300 for [O i] doublet, $\lambda$6563 for H $\alpha$, $\lambda$7291 for [Ca ii], and $\lambda$8498 for Ca ii NIR triplet in grey colour, whereas the positions of other related wavelengths are also shown with blue dashed lines in the velocity space.](https://oup.silverchair-cdn.com/oup/backfile/Content_public/Journal/mnras/538/2/10.1093_mnras_staf312/1/m_staf312fig3.jpeg?Expires=1750250714&Signature=WGlKKJ5ZciK6LV-VUMmjROm2ibni221N-d3qqc2pnoacZZ9AFwh3Yn1x00-bF7no8C4ttr~-MT-Khk6JGVvTq9aAwy~33zqL7X-2MDI0gCZzmyv9ALZtYJTEvCJj-0nKywGunFwx6keEmHlGv~0R-A4yvlVRkHdw3udKXC6Kq0hCwM7a1xgzD4S-65L19q6xBt77YIrD6xi5gYzbrTR8q1JD9Xy9GynAOzQCoF0ME7beGKRPiezFmMgtsJuLTd-7h8~aocfhVMjZxBw6I4M3Gup0oq8t2LGR5Qst28Ny6yWwkZHu~SmqJrtR0ENGWVC~3W6ARMpuoMjVxHMP5flI4w__&Key-Pair-Id=APKAIE5G5CRDK6RD3PGA)
The evolution of Mg i], [O i] doublet, H |$\alpha$|, [Ca ii] |$\lambda \lambda$|7291, 7324, and Ca ii NIR triplet in the velocity space is presented, with each line highlighted in a separate panel. The zero velocity for each line is marked at |$\lambda$|6300 for [O i] doublet, |$\lambda$|6563 for H |$\alpha$|, |$\lambda$|7291 for [Ca ii], and |$\lambda$|8498 for Ca ii NIR triplet in grey colour, whereas the positions of other related wavelengths are also shown with blue dashed lines in the velocity space.
Across all three spectra (+141 to +363 d), the [O i] doublet emission features are significantly blue-shifted. In the +259 and +363 d spectra, the Mg i] |$\lambda$|4571 and [O i] doublet are shifted by approximately |$-1500\, \mathrm{km\, s^{-1}}$| from their respective rest wavelengths. The H |$\alpha$| line exhibits multiple components, including a central broad profile surrounded by boxy blueward and redward features (marked in green; see the third panel of Fig. 3), each displaying a multipeak structure in the +363 d spectrum. From +141 to +363 d, the central H |$\alpha$| profile is observed nearly at zero velocity, though it appears asymmetric around the central wavelength. In the spectrum at +259 d, the blueward component of H |$\alpha$| line is observed at a velocity around |$-6900\, \mathrm{km\, s^{-1}}$|, while the redward component is not visible. By +363 d, this blueward component of H |$\alpha$| shifts closer to the rest velocity of H |$\alpha$|, peaking at |$\sim -5650\, \mathrm{km\, s^{-1}}$|. Meanwhile, the redward component emerges at nearly the same velocity but in the opposite direction (|$\sim +5650\, \mathrm{km\, s^{-1}}$|), albeit comparatively suppressed. The asymmetry of the central H |$\alpha$| profile around zero velocity, along with the distinct profiles of the blueward and redward components, indicate asymmetry and clumpiness in the ejecta and/or surrounding CSM; discussed in detail in Section 5.
The [Ca ii] |$\lambda \lambda$|7291, 7324 features appear slightly blueshifted, with velocities in the range of approximately |$-100$| to |$-170\, \mathrm{km\, s^{-1}}$|, and increase in intensity over time. Additionally, the emergence of [Fe ii] |$\lambda \lambda$|7155, 7172 on the left of this feature becomes apparent. On the other hand, the Ca ii NIR triplet appears nearly at zero velocity in the +141 d spectrum but becomes redshifted in the +259 and +363 d spectra (|$\approx 600\, \mathrm{km\, s^{-1}}$|), while simultaneously weakening over time.
To analyse the blended [O i] doublet and H |$\alpha$| composite structure, we perform a simultaneous multi-Gaussian fit in the wavelength region 6200 to 6750 Å using the Python package scipy.curve_fit (see Fig. 4). For the H |$\alpha$| line, we fit the central component with a Gaussian initialized at 6562.8 Å. Additionally, we include two sets of satellite Gaussians symmetrically shifted by variable parameters, |$\Delta \lambda _{01}$| and |$\Delta \lambda _{02}$|, on both sides of the central H |$\alpha$| component. These shift parameters (|$\Delta \lambda _{01}$| and |$\Delta \lambda _{02}$|) are treated as free variables during the fitting process. All Gaussians associated with H |$\alpha$| are constrained to have the same full-width at half maximum (FWHM). For the [O i] doublet, each component is fitted using two Gaussians: a narrow Gaussian and a broad Gaussian. The broad Gaussian is constrained to have the same FWHM as the H |$\alpha$| Gaussians, while the FWHM of the narrow Gaussian is treated as an independent free parameter. The individual Gaussian components and the total fit are shown in Fig. 4, with the central wavelengths of the fitted Gaussians marked above the top. The parameter estimates from the multi-Gaussian fitting process are provided in Table 1. From this fit, we determined the FWHM values for the broad and narrow components to be |$62.3 \pm 2.7$| Å and |$26.9 \pm 2.6$| Å, respectively. The shift parameters |$\Delta \lambda _{01}$| and |$\Delta \lambda _{02}$| were found to be |$\pm (42.9\pm 2.6)$| Å and |$\pm (123.7 \pm 2.6)$| Å, respectively. We note that the bridge-like feature connecting [O i] doublet and H |$\alpha$| has contributions from both the blueward component H |$\alpha$| and the redward component of [O i] doublet. These features indicate a complex velocity structure of the material within the ejecta, with components moving at varying speeds (Kuncarayakti et al. 2020). From these fits, we measured the flux of the [O i] doublet, calculated as the composite flux of all four Gaussian components, to be |$0.93 \times 10^{-13}\, \mathrm{erg\, cm^{-2}\, s^{-1}}$|, which is later used in Section 4.1.
![Multiple Gaussian components fitted to the [O i] doublet and H $\alpha$ profile are shown. The Gaussian components near the rest wavelengths of the [O i] doublet and H $\alpha$ are shaded in brown. The central wavelengths of each fitted Gaussian are labelled at the top.](https://oup.silverchair-cdn.com/oup/backfile/Content_public/Journal/mnras/538/2/10.1093_mnras_staf312/1/m_staf312fig4.jpeg?Expires=1750250714&Signature=lfLeUkF5ydDNjFTLoT2OnPgwceqqKMnGj7g7YTZ~pU2-PnhpkQsCM8-n1XKZKEjoEnZhUJ9SDmfWaP-aciJzcaVGOdYEHpWyKqJpN9NhDAHMeq9F7bjnk3bpRxnzpDK6CV36wbVVJZ~hZtfquKYrzeH~KPqWtbxe2kixuwwgTG0QTrSDBsu1T71w2DMmOVAG74C7G9B-D~D-YXXoS~bnv9KtSL2QIi-g~L1I~8MBV9JsO0~yyUlZlH4Nc2jJTXugwDc7N-LmpaEZ3uvT2ynLa8I5OnBvB7ZbAZxBDMzu0lcDzvkGl1DyjYXcjNODF3U3J9YAqWUolvjkYOhv81sEkA__&Key-Pair-Id=APKAIE5G5CRDK6RD3PGA)
Multiple Gaussian components fitted to the [O i] doublet and H |$\alpha$| profile are shown. The Gaussian components near the rest wavelengths of the [O i] doublet and H |$\alpha$| are shaded in brown. The central wavelengths of each fitted Gaussian are labelled at the top.
Parameter estimates of the multi-Gaussian fitting process for the blended [O i] doublet and H |$\alpha$| composite structure, and Mg i] profile.
| Component | Parameter | Best-fitted value (Å) | Notes |
|---|---|---|---|
| H |$\alpha$| | Central wavelength | 6563.1 |$\pm$| 2.6 | Central Gaussian component of H |$\alpha$|. |
| FWHM | 62.3 |$\pm$| 2.7 | Broad component, same FWHM applied to all H |$\alpha$| Gaussians. | |
| |$\Delta \lambda _{01}$| | |$\pm$| (42.9 |$\pm$| 2.6) | Shift for the first pair of satellite components. | |
| |$\Delta \lambda _{02}$| | |$\pm$| (123.7 |$\pm$| 2.6) | Shift for the second pair of satellite components. | |
| [O i] Doublet | Central wavelengths (Broad Gaussians) | 6295.0 |$\pm$| 2.8, 6357.6 |$\pm$| 2.9 | Broad component constrained to same FWHM |
| FWHM (Broad Gaussians) | 62.3 |$\pm$| 2.6 | as H |$\alpha$|. | |
| Central wavelengths (Narrow Gaussians) | 6269.1 |$\pm$| 2.5, 6331.9 |$\pm$| 2.5 | Independent narrow components. | |
| FWHM (Narrow Gaussians) | 26.9 |$\pm$| 2.6 | ||
| Mg i] | Central wavelength (Broad Gaussian) | 4578.5 |$\pm$| 2.0 | Broad component. |
| FWHM (Broad Gaussian) | 57.5 |$\pm$| 2.2 | ||
| Central wavelength (Narrow Gaussian) | 4550.4 |$\pm$| 1.8 | Narrow component. | |
| FWHM (Narrow Gaussian) | 20.0 |$\pm$| 1.9 |
3.1.1 Geometry
Profiles of emission lines in the nebular spectra of SNe are powerful tools for probing the geometry of the ejecta. Among these, the [O i] doublet |$\lambda \lambda$|6300, 6364 is particularly useful due to its high strength during the nebular phase and its relative isolation from blending with other lines. Based on numerous studies (e.g. Maeda et al. 2002; Mazzali et al. 2005; Maeda et al. 2008; Modjaz et al. 2008; Tanaka et al. 2009; Taubenberger et al. 2009; Fang et al. 2024), double-peaked [O i] profiles have often been interpreted as arising from oxygen-rich ejecta arranged in toroidal or disc-like geometry, potentially viewed off-axis. However, Milisavljevic et al. (2010) highlighted the challenges of interpreting [O i] doublet profiles solely as evidence of such a geometry, emphasizing that the separation of the double peaks in the [O i] doublet plays a crucial role in the interpretation.
For SN 2023ixf, the spectrum at +359 d (Figs 3 and 4) shows that the narrow components of the [O i] doublet are separated by |$\approx$|63 |$\pm$| 1 Å, with both peaks equidistant from 6300 Å (the zero-velocity position). This separation matches the theoretically expected value for the [O i] |$\lambda$|6300 and [O i] |$\lambda$|6364 lines. In this context, the intrinsic doublet nature of the [O i] lines is sufficient to explain the symmetric double-peaked profiles without invoking a toroidal or disc-like geometry. Furthermore, from the fit, it is apparent that the narrow components of the [O i] doublet, shifted by –1500 km s|$^{-1}$|, contribute to the overall blueshifted structure, while the peaks of the broad components remain near their rest wavelengths. The blueshifted, narrow profiles and the broad, nearly zero velocity profiles could potentially originate from two different regions of the SN: a central, spherically symmetric distribution of O-rich ejecta and a clump or shell of O-rich material moving at a moderate velocity (–1500 km s|$^{-1}$|) toward the observer.
Additionally, the intensity ratio between the [O i] |$\lambda$|6300 and [O i] |$\lambda$|6364 components is measured to be |$\approx$|1.15, significantly lower than the theoretical value of 3 for an optically thin region. This reduced ratio suggests suppression of the bluer |$\lambda$|6300 component, likely due to optically thick line emission with |$\tau \gt 1$| (Li & McCray 1992; Williams 1994). Further evidence supporting the identification of the two peaks as the [O i] |$\lambda \lambda$|6300, 6364 doublet comes from the increasing blue to red peak height ratio from +141 to + 363 d, as the SN’s expansion (and corresponding decrease in opacity) should drive this ratio towards the expected nebular-phase 3:1 ratio.
Interestingly, we also noted that the peak of Mg i] is also blueshifted by the same amount as [O i]. Hydrodynamic explosion models (Maeda et al. 2006) predict that Mg and O should share a similar spatial distribution within the SN ejecta, while heavier elements such as Fe and Ca may exhibit significantly different distributions. As a result, the profiles of isolated Mg and O emission lines are expected to be similar, a trend observed in several stripped-envelope SNe (Taubenberger et al. 2009).
However, a direct comparison of the Mg i] and [O i] lines is challenging because, unlike Mg i], the [O i] feature is a doublet. To address this, Taubenberger et al. (2009) proposed a method in which the Mg i] feature is first isolated, and a linearly fitted background is subtracted. The Mg i] line is then rescaled to one-third of its initial intensity, shifted by 46 Å (equivalent to the 64 Å separation between the two [O i] lines), and added back to the original profile. This modified Mg i] profile can then be directly compared with the observed [O i] feature.
For SN 2023ixf, we initially fit the Mg i] profile using both a narrow and a broad Gaussian component, as shown in the left panel of Fig. 5. We applied the rescaling to both components, and the final modified profile is presented in the right panel of Fig. 5. The modified Mg i] profile closely reproduces the observed [O i] feature, except that the |$\lambda$|6364 component of [O i] appears brighter than its counterpart in the modified Mg i] profile. This discrepancy is expected given the lower-than-expected [O i] doublet ratio (|$\sim$|1.15) obtained for SN 2023ixf. Thus, the similarity between the [O i] and Mg i] profiles suggests a similar spatial distribution of these elements and further supports the presence of a directional component in addition to a centrally symmetric ejecta structure. The latter is powered by radioactive decay and also contributes to the central H |$\alpha$| profile centred at 6563 Å (discussed in more detail in Section 5).
![Double Gaussian fitted to the Mg i] doublet is shown along with the linearly fitted continuum. The modified Mg i] profile is compared in the right panel with the observed [O i] profile.](https://oup.silverchair-cdn.com/oup/backfile/Content_public/Journal/mnras/538/2/10.1093_mnras_staf312/1/m_staf312fig5.jpeg?Expires=1750250714&Signature=ggXXynWccOjK5Is0wrVPUL9PL65UWKPCWktDwOB0r6QHIEnOnaWx5elaMecTqX4~9esRN1ywDegeSgGl8QbwvjReFC6yHVOWu6PEc2jcp0r7VRMg5w7JE5Un8ehUb7-e1cUH1UePFKR9gclUjaIcib7BiNDbWaIUvc70yKm9Kq1hvm8Buo51T0FaDRvCN~HsOtXeMQA2Y-Il595aUPexjwljSosbkqR-qO5jarDYo7FNp8zWTpRAB6zi9EEv4qz2NTkzexblA3a5lGtKY8roJ1yhxjXKIPn4pJUVcpL546BO3I0NU83aVSa7UW6i16oh6ecR~f8u~S3M9rJ-38o48Q__&Key-Pair-Id=APKAIE5G5CRDK6RD3PGA)
Double Gaussian fitted to the Mg i] doublet is shown along with the linearly fitted continuum. The modified Mg i] profile is compared in the right panel with the observed [O i] profile.
4 PROGENITOR MASS
The values for |$M_{\rm O}$|, |$M_{\rm He}$|, and |$M_{\rm ZAMS}$| can be estimated using the observed flux of the [O i] doublet, in conjunction with a comparison to the modelled spectra of Jerkstrand et al. (2014).
4.1 Progenitor mass from [O i] doublet flux
Forbidden oxygen lines in the nebular phase of SNe, mainly the isolated [O i] doublet |$\lambda \lambda$|6300, 6364, are directly linked to nucleosynthesis and are considered a reliable indicator of the progenitor mass. These lines also help constrain various ejecta properties, such as mixing, the mass of synthesized |$^{\rm 56}$|Ni, and geometry (Taubenberger et al. 2009; Jerkstrand et al. 2014; Jerkstrand 2017). Ferrari et al. (2024) have measured |$M_{\rm O}$| for SN 2023ixf using the spectrum at +259 d. In this work, we also attempt to estimate |$M_{\rm O}$| using our +363 d spectrum, which appears to represent a more developed nebular phase, complementing the earlier measurement. Following Uomoto (1986), |$M_{\rm O}$| can be expressed as:
where |$f\left([{\rm O}~{\rm I}]\right)$| is the integrated flux of the [O i] doublet, d is the distance to the host galaxy, and |$T_4$| is the temperature of the oxygen-emitting region in |$10^4$| K. Before the flux measurements, the spectrum has been corrected for the Milky Way and the host galaxy extinctions, considering |$E(B-V)_{\rm MW+Host}$| = 0.039 |$\pm$| 0.011 mag (Singh et al. 2024). We estimated |$f\left([{\rm O}~{\rm I}]\right)$| to be |$\approx 0.93 \times 10^{-13} \, \mathrm{erg \, cm^{-2} \, s^{-1}}$|. Similar to Singh et al. (2024), we adopted the distance of the host galaxy of SN 2023ixf equals to 6.82 |$\pm$| 0.14 Mpc, which is the mean distance of those measured by Tikhonov, Lebedev & Galazutdinova (2015) and Riess et al. (2022). |$T_4$| can be estimated using the flux ratio of [O i] |$\lambda$|5577 to the [O i] doublet (|$\lambda \lambda$|6300, 6364), which is mainly sensitive to temperature and optical depth. If we assume the region is optically thin, the ratio depends solely on the temperature of the emitting region (Elmhamdi 2011; Jerkstrand et al. 2014). However, in our +363 d spectrum, the region around [O i] |$\lambda$|5577 falls within the chip gap, resulting in distortion and preventing a reliable flux measurement. Consequently, we adopt the value of T with a range of 3500–4500 K (as suggested by Bose et al. 2013), consistent with the typical oxygen-emitting region temperatures observed in Type II SNe during the nebular phase (300–400 d; see Liu & Dalgarno 1995; Smartt et al. 2009; Bose et al. 2013; Jerkstrand et al. 2014, 2015). This range reflects the balance of radioactive heating and line cooling processes, which are largely uniform across Type IIP SNe with similar progenitor types. Adopting this range ensures systematic uncertainties are considered while leveraging consistent thermal evolution trends observed in similar SNe. Using equation (1) and parameter values, we estimate |$M_{\rm O} \approx 0.07-0.30\, \, {\rm M_\odot}$|. Based on Jerkstrand et al. (2015), |$M_{\rm O}$| values of |$0.3-1.3 \, {\rm M_\odot}$| correspond to |$M_{\rm ZAMS}$| of |$12-17 \, {\rm M_\odot}$| and |$M_{\rm He}$| of |$3-5\, \, {\rm M_\odot}$|, respectively. Based on this, SN 2023ixf likely originates from a progenitor with |$M_{\rm ZAMS} \lesssim 12 \, {\rm M_\odot}$| and |$M_{\rm He} \lesssim 3 \, \, {\rm M_\odot}$|.
4.2 Progenitor mass from literature model spectra comparison
Jerkstrand et al. (2014) modelled nebular phase spectra of Type II SNe for progenitors with initial masses of 12, 15, 19, and 25 |$\, {\rm M_\odot}$|, assuming a |$^{\rm 56}$|Ni mass of 0.062 |$\, {\rm M_\odot}$| and a distance of 5.5 Mpc. We compared the +363 d spectrum of SN 2023ixf to the 12 and 15 |$\, {\rm M_\odot}$| models to estimate the progenitor’s mass, as shown in Fig. 6. During the nebular phase, the SN is powered by radioactive decay energy. To account for differences in |$^{\rm 56}$|Ni mass, we scaled the model spectra flux by the ratio of the |$^{\rm 56}$|Ni mass of SN 2023ixf (0.070 |$\, {\rm M_\odot}$|; Hsu et al. 2024; Zimmerman et al. 2024) to that of the model spectra (0.062 |$\, {\rm M_\odot}$|). The model flux was also rescaled to match the distance (6.82 Mpc) and phase (+363 d) of the nebular spectrum of SN 2023ixf. Before comparison, we corrected the SN spectrum for redshift, scaled it to match the photometric flux to account for slit losses, and applied reddening corrections (|$A_V = 0.12\, \mathrm{mag}$|). The model spectra display strong H |$\alpha$| emission, which is significantly weaker in the observed spectrum of SN 2023ixf. The Mg i] |$\lambda$|4571 line is reproduced well by both the models, but the models exhibit a prominent Ca ii NIR triplet feature that is weaker in the SN 2023ixf spectrum. The [O i] doublet flux in the SN 2023ixf spectrum closely matches the flux predicted by the 12 |$\, {\rm M_\odot}$| model spectrum, suggesting a |$M_{\rm ZAMS}$| of |$\sim$|12 |$\, {\rm M_\odot}$| for SN 2023ixf. Additionally, the [Ca ii] in the 12 |$\, {\rm M_\odot}$| model spectrum is a better match to the observed spectrum, although the strength of this line is only weakly dependent on the progenitor mass (Jerkstrand et al. 2014).
![Comparison of +363 d spectrum of SN 2023ixf with 12 and 15 $\, {\rm M_\odot}$ model spectra from Jerkstrand et al. (2014). The inset shows the zoom-in of the [O i] $\lambda \lambda$6300, 6364 region.](https://oup.silverchair-cdn.com/oup/backfile/Content_public/Journal/mnras/538/2/10.1093_mnras_staf312/1/m_staf312fig6.jpeg?Expires=1750250714&Signature=eIAxFV3Omec8PjuCHDwXMz8frIMYNaC1QJtu2REl9CWMVgrYU8kZyyt-Y1ici~hMk2S6Enf3ArdsinhUECp85YSCtRYDgcELE8oBqMf82S2WH1ugYuzbndOOybWLT4z~CuuHp4ZJuHK2m-AdfWvB8iyGJjaLyXSr~DSKof-ipXC1IkAIP2f65EF4nGRd7wRd23a~d1IuhsYPcbks4I-vuLs1YJpaxZHJNOLpdravZKo9Zf57CTWQ9tOQFhwFPOrwsNaiLBZ4sHb6ShxHSyR141e0IPZDwlRoOLiFmZmHPyX2IstCmU8TpAtKHZATyDb000ajPpKm~dlXe97b5QEGfw__&Key-Pair-Id=APKAIE5G5CRDK6RD3PGA)
Comparison of +363 d spectrum of SN 2023ixf with 12 and 15 |$\, {\rm M_\odot}$| model spectra from Jerkstrand et al. (2014). The inset shows the zoom-in of the [O i] |$\lambda \lambda$|6300, 6364 region.
In summary, our estimate of the progenitor mass for SN 2023ixf, derived from the flux measurement of the [O i] doublet and constrained through comparison with model spectra, suggests a |$M_{\text{ZAMS}}$| of |$\lesssim 12\, \, {\rm M_\odot}$|. This is consistent with previous studies that suggested a low-mass progenitor through pre-explosion imaging and the hydrodynamical modelling, such as Kilpatrick et al. (2023a, |$11\pm 2 \, \, {\rm M_\odot}$|), Pledger & Shara (2023, |$\sim 12 \, \, {\rm M_\odot}$|), Neustadt et al. (2024, |$9.3-13.6 \, {\rm M}_{\odot }$|), Singh et al. (2024, |$\sim 10\, \, {\rm M_\odot}$|), and Xiang et al. (2024, |$12^{+2}_{-1}\, \, {\rm M_\odot}$|).
5 INTERACTION SIGNATURES
The +363 d spectrum of SN 2023ixf exhibits a highly complex H |$\alpha$| profile, revealing crucial details about the interaction processes within the SN environment. The central component of this structure, referred to hereafter as ‘Region A’, can be decomposed into three distinct components, as shown in Fig. 7, spanning velocities from –4000 to |$+4000\, \mathrm{km\, s^{-1}}$| relative to the rest velocity of H |$\alpha$|. The central component of ‘Region A’, redshifted by |$12\, \mathrm{km\, s^{-1}}$|, is flanked by two components centred at |$\sim \pm 1950\, \mathrm{km\, s^{-1}}$|. The blueshifted component is notably stronger than its redshifted counterpart. A similar multipeaked profile is also evident in the +141 and +259 d spectra (see the third panel of Fig. 3). In addition to ‘Region A’, distinct high-velocity features emerge, symmetrically positioned on both sides of ‘Region A’, centred at |$\sim \pm 5650\, \mathrm{km\, s^{-1}}$| relative to the rest velocity of H |$\alpha$|. These high-velocity features are absent in spectra obtained up to +141 d (see the third panel of Fig. 3). The high-velocity feature on the blue side becomes discernible as early as +259 d, while that on the red side becomes prominent at +363 d.
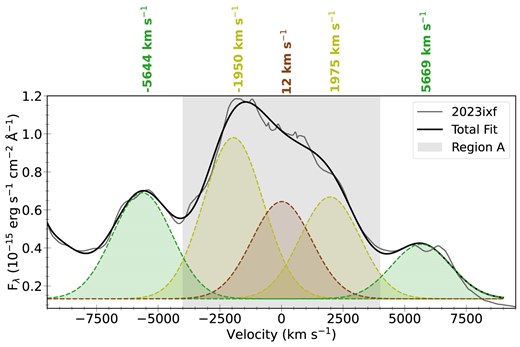
Zoom-in of the H |$\alpha$| profile fit in velocity space. The velocity of each of the Gaussian components relative to the rest velocity of H |$\alpha$||$\lambda$|6562.8 are labelled at the top. The central complex H |$\alpha$| profile, referred to as ‘Region A’ in the text, is shaded in grey.
Dessart et al. (2023) modelled nebular-phase spectra (> +350 d) of a |$15.2\, \, {\rm M_\odot}$| RSG star explosion, incorporating shock power generated by the interaction of a shock-swept dense shell with a tenuous CSM, in addition to energy from radioactive decay. To mimic this interaction, they inject shock power in the range |$10^{40}-10^{41}\, \mathrm{erg \, s^{-1}}$| in a dense shell expanding at a velocity of |$8000\, \mathrm{km\, s^{-1}}$|. These shock powers correspond to a mass-loss rate of the progenitor in the range |$10^{-6}-10^{-5}\, \, {\rm M_\odot} \, \mathrm{yr}^{-1}$| during hundreds to thousands of years before the explosion. This injected power is comparable to the energy produced by radioactive decay 1-yr post-explosion, and as the radioactive energy declines over time, the shock interaction increasingly dominates the luminosity. The signatures of this interaction are evident across various wavelengths, with the |$\rm UV$| being particularly sensitive. In the |$\rm UV$|, the interaction manifests as an increase in the overall continuum luminosity and enhanced emission from the Mg ii|$\lambda \lambda$| 2795, 2802 doublet. In the optical spectrum, the shock interaction signatures are observed as blueshifted and redshifted broad, boxy H |$\alpha$| emission features.
In Fig. 8, we compare the +363 d spectrum of SN 2023ixf with the +350 d model spectra of Dessart et al. (2023), which incorporate various injected shock powers ranging from |$10^{40}$| to |$10^{41}\, \mathrm{erg\, s^{-1}}$| in a spherical dense shell. The models exhibit a central H |$\alpha$| profile spanning |$\pm 2000\, \mathrm{km\, s^{-1}}$| (indicated by dashed lines in the inset plot), surrounded by broad, boxy emission profiles on both sides, with steep cutoffs at |$\pm 8000\, \mathrm{km\, s^{-1}}$|. In their models, the boxy profiles originate exclusively from the narrow dense shell and display sharp vertical edges due to the high density and limited width of the emitting region.
![Comparison of the +363 d spectrum of SN 2023ixf with the +350 d nebular spectra models from Dessart et al. (2023). The models, representing various injected shock powers ranging from $10^{40}$ to $10^{41}\, \mathrm{erg\, s^{-1}}$, are indicated in the figure legend. The inset provides a close-up view of the [O i] doublet and H $\alpha$ regions. For comparison, the +259 d spectrum of SN 2023ixf is also shown in the inset. The extent of the central H $\alpha$ component in the models ($\pm 2000\, \mathrm{km\, s^{-1}}$) is marked with dashed lines, while the shaded region highlights its extent in SN 2023ixf.](https://oup.silverchair-cdn.com/oup/backfile/Content_public/Journal/mnras/538/2/10.1093_mnras_staf312/1/m_staf312fig8.jpeg?Expires=1750250714&Signature=pGfo3JEH~aQMsdhrqVz5CL3jbEwYXz64O9hUBdSXbvOWl~ZXPUkuMRF76~vFUntTRyXrxtJlU~anwb9vbRH1XlYlbVjUvY~U5Ru24gWKcbEHVYyHnmy37g6txL8v8PIFgRTPtZFNTe1JMwiiuqamix-6GRpUEbSksK7nFUPFgBeJS94QyoC9Ve-YoFUJK9Jur4qNlAQcmjqzyY7YG3zsgEVuYmVUNVkvdv9If3RQ6XiyOJw0bk-kKk1z6rvo8TCcmAv1qWJfQwQ1wLQCumVsjBz9WjWbq32d80lyjYkxYV6-LA7A0zRFla-VPBJ~ZXMFTZkDXin7Hzi3n4ddnjUPeA__&Key-Pair-Id=APKAIE5G5CRDK6RD3PGA)
Comparison of the +363 d spectrum of SN 2023ixf with the +350 d nebular spectra models from Dessart et al. (2023). The models, representing various injected shock powers ranging from |$10^{40}$| to |$10^{41}\, \mathrm{erg\, s^{-1}}$|, are indicated in the figure legend. The inset provides a close-up view of the [O i] doublet and H |$\alpha$| regions. For comparison, the +259 d spectrum of SN 2023ixf is also shown in the inset. The extent of the central H |$\alpha$| component in the models (|$\pm 2000\, \mathrm{km\, s^{-1}}$|) is marked with dashed lines, while the shaded region highlights its extent in SN 2023ixf.
In SN 2023ixf, however, the central component is clearly broader and, as discussed above, blends with the boxy structure at |$\pm 4000\, \mathrm{km\, s^{-1}}$|. Such a multicomponent profile could originate from an asymmetric, clumpy shell interacting with a low-density CSM. Singh et al. (2024) proposed the presence of an extended CSM in addition to the torus-shaped dense CSM responsible for early flash-ionization features. According to their model, varying densities along the poles and equator result in an aspherical shock front after it breaks out of the dense CSM approximately 4 d post-explosion.
Multiple pieces of evidence for this aspherical shock front are presented in Singh et al. (2024). After breaking out of the torus-shaped dense CSM, they describe a faster shock front moving at 13 500 km s|$^{-1}$|, resulting from the freely expanding ejecta interacting with the low-density extended CSM, and a slower shock front, decelerated by the equatorial dense CSM, moving at 8500 km s|$^{-1}$|. Over time, the asymmetric shock front sweeps up material, forming an asymmetric dense shell. Both shock fronts will decelerate over time, with the slower moving shock front accumulating more material than the faster one, leading to enhanced interaction power at lower velocities.
The interaction of this asymmetric dense shell with the CSM drives a reverse shock into the dense shell and outer layers of the ejecta and a forward shock into the surrounding CSM. The recombination of the shocked material produces H |$\alpha$| emission at distinct velocities. The brighter emission component of H |$\alpha$| at lower velocities (|$\sim \pm 1950\, \mathrm{km\, s^{-1}}$|) corresponds to the higher interaction power due to a more massive shell, while the weaker emission at higher velocities (|$\sim \pm 5650\, \mathrm{km\, s^{-1}}$|) arises from the less massive, faster moving shell. This picture seamlessly aligns with the presence of two pairs of satellite components observed on either side of the central H |$\alpha$| feature powered by radioactive decay (see Fig. 7). Moreover, unlike the models, we note that the high velocity H |$\alpha$| components in SN 2023ixf display extended, slanted wings rather than sharp, vertical edges. Dessart et al. (2023) suggested that such wings can be explained by a less dense shell than assumed in the models, allowing some shock power to be reprocessed deeper in the ejecta, thus enhancing line emissivity over a broader velocity range.
The +259 d spectrum is also shown in the inset of Fig. 8 to compare the extent of these features in the velocity space at +259 and +363 d. While the high-velocity feature on the blue side of H |$\alpha$| is distinct in the +259 d spectrum, an emerging high-velocity feature on the red side is also visible at this epoch. Since the high-velocity feature on the blue side blends with [O i], it is challenging to determine at which wavelength it merges with the continuum. However, on the red side, it appears to merge with the continuum at a velocity of 9000|$\, \mathrm{km\, s^{-1}}$|. For the low-velocity components, blending with the central H |$\alpha$| feature on one side and the high-velocity components on the other complicates the determination of their extent, but the multicomponent fit indicates merging with the continuum at |$\pm 5500\, \mathrm{km\, s^{-1}}$|.
In the model spectra of Dessart et al. (2023) at various epochs (350, 500, and 700 d), features originating from the dense shell remain constrained within |$\pm 8000\, \mathrm{km\, s^{-1}}$|, the velocity of injection of shock power at 350 d, while the strength of the feature increases over time. Therefore, for SN 2023ixf we can assume that the asymmetric dense shell expanding at velocities 5500 and 9000 |$\, \mathrm{km\, s^{-1}}$| (which are the respective merging points with continuum) along the equator and the poles respectively, is interacting with the extended CSM. The corresponding CSM radii, based on the distance travelled by the shock front over 259 d, are approximately 1.2 |$\times$| 10|$^{16}$| cm and 2.0 |$\times$| 10|$^{16}$| cm. Assuming the CSM expands at a typical red supergiant wind velocity of |$10\, \mathrm{km\, s^{-1}}$|, this CSM likely formed |$\sim 390 - 640$| yr prior to the explosion. However, it is important to note that these features may have emerged anywhere between +141 and +259 d, this timeframe is approximate. Finally, a comparison with Dessart et al. (2023) models indicates that the minimum shock power required to produce the high-velocity feature is around 5|$\times 10^{40}$| erg s|$^{-1}$|.
Furthermore, we note that the H |$\alpha$| profile shows asymmetry: the blueshifted feature is stronger and exhibits a triangular shape, while the redshifted feature is weaker and displays a boxy profile as shown in the inset of Fig. 8. Such red-blue asymmetry is also seen in the blueward components of [O i] doublet and [Ca ii] lines, and, to a lesser extent, in the Ca ii NIR triplet. Dust formation likely contributes to this asymmetry, with redshifted radiation more attenuated as it traverses dusty regions. This asymmetry, first evident in the +125 d spectrum (Singh et al. 2024), likely arises from the formation of dust in a cold dense shell (CDS; Chugai 2009) produced during the interaction of ejecta with CSM expelled within a decade prior to the explosion. As discussed above, the +363 d spectrum indicates interaction with a more distant CSM, which could lead to the formation of additional CDS, providing a secondary source of dust that enhances the observed red-blue asymmetry. The increasing prominence of this asymmetry over time strongly supports ongoing dust formation as SN 2023ixf evolves. This dust-driven asymmetry, coupled with CSM interaction with an aspherical dense shell, underscores the interplay of geometry and dust formation in shaping the observed spectral features.
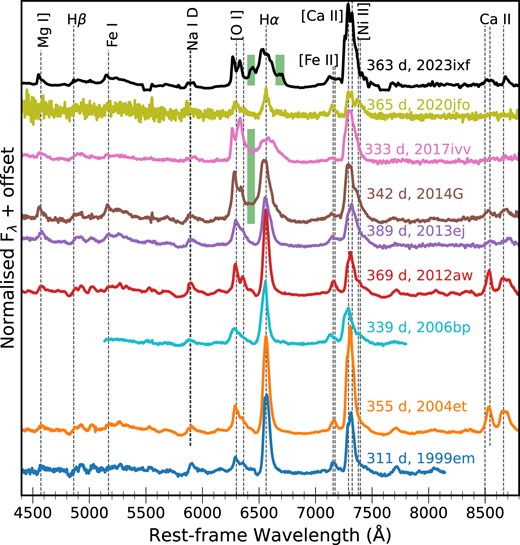
Comparison of the +363 d spectrum of SN 2023ixf with similar epoch spectra from the comparison sample. Interaction signatures in SNe 2014G, 2017ivv, and 2023ixf are highlighted with bands.
6 COMPARISON WITH OTHER TYPE II SNE
We compare the +363 d spectrum of SN 2023ixf with those of other Type II SNe that have spectra available within |$\pm$|50 d of this epoch. From the literature, we obtained spectra for the following SNe: 1999em, 2004et, 2006bp, 2012aw, 2013ej, 2014G, 2017ivv, and 2020jfo. The redshifts and explosion epochs, and the corresponding references for these SNe, as considered in this work, are provided in Table 2. SNe 1999em, 2004et, 2006bp, 2012aw, 2013ej, and 2020jfo do not show broad boxy components of H |$\alpha$|, considered signs of late-time interaction. Interaction signatures are evident in SNe 2014G and 2017ivv, though they are not as pronounced as those in SN 2023ixf. This indicates the presence of a dense shell in SN 2023ixf, formed earlier than in SNe 2014G and 2017ivv, and hence located closer to the progenitor. The distance of this CSM shell depends on the progenitor’s wind mass-loss rate, the wind velocity, and the density and velocity of the ambient medium (Kurfürst et al. 2020). SN 2014G displays a bridge-like feature connecting [O i] and H |$\alpha$|, caused by broad H |$\alpha$| emission – a sign of interaction – which is also seen in SN 2023ixf but over a shorter wavelength range. SN 2017ivv also exhibits a broad H |$\alpha$| component that enhances the red component of the [O i] doublet profile (Dessart & Hillier 2022). The blueshifted [O i] feature observed in SN 2023ixf is also apparent in SN 2017ivv. None of the comparison SNe, except SN 2023ixf, exhibit the red-blue asymmetric peaks in H |$\alpha$| and [Ca ii], which are considered signatures of dust formation. These observations highlight SN 2023ixf as a uniquely interacting and dynamically evolving Type II SN, showcasing signatures of a dense, close-in CSM shell and potential dust formation that distinguish it from the other SNe in the comparison sample.
Parameters of Type II SNe used in Fig. 9 along with the references for the explosion epoch and/or spectra. The redshifts are taken from NED.
| SN | Explosion | Redshift | Spectra epoch | References |
| Epoch (MJD) | (d) | |||
| 1999em | 51474.7 | 0.002390 | 311 | [a] |
| 2004et | 53270.5 | 0.000909 | 355 | [b] |
| 2006bp | 53834.6 | 0.003502 | 339 | [c], [d] |
| 2012aw | 56002.6 | 0.002600 | 369 | [e], [f] |
| 2013ej | 56497.5 | 0.002190 | 389 | [g] |
| 2014G | 56669.3 | 0.004500 | 342 | [h] |
| 2017ivv | 58091.6 | 0.03 | 333 | [i] |
| 2020jfo | 58973.1 | 0.005220 | 365 | [j] |
| 2023ixf | 60082.7 | 0.000804 | 363 | [k], This work |
Note. References: [a] Leonard et al. (2002), [b] Faran et al. (2014), [c] Quimby et al. (2007), [d] Inserra et al. (2012), [e] Fraser et al. (2012), [f] Jerkstrand et al. (2014), [g] Yuan et al. (2016), [h] Terreran et al. (2016), [i] Gutiérrez et al. (2020), [j] Ailawadhi et al. (2023), [k] Hsu et al. (2024), and references therein.
7 DISCUSSION AND CONCLUSION
In this study, we analysed the nebular phase spectrum of SN 2023ixf obtained at 1-yr post-explosion using the recently commissioned WEAVE multi-object fibre-fed spectrograph at the prime focus of 4.2m WHT. This spectrum of SN 2023ixf, the closest Type II SN of the decade, represents a significant landmark as it marks the first SN spectrum ever captured with WEAVE. This milestone highlights the instrument’s capabilities for detailed spectroscopic analysis of transient phenomena, particularly in the late phases of SN evolution.
To investigate the spectral evolution of SN 2023ixf, we incorporated published nebular spectra from earlier epochs (+141 and +259 d). The evolution of emission features over time reveals a rich array of lines typically observed in Type II SNe. Additionally, narrow host galaxy emission lines, such as H |$\beta$| and [O iii] |$\lambda$|5007, are detected at nearly zero velocity.
The +363 d spectrum exhibits a complex H |$\alpha$| profile, a hallmark of ongoing interaction between the SN ejecta and CSM. Detailed multi-Gaussian decomposition of this profile reveals that the central broad feature spanning |$\pm 4000\, \mathrm{km\, s^{-1}}$| can be decomposed into three Gaussian components: a red-shifted feature near 12 |$\mathrm{km\, s^{-1}}$| and two symmetric components centred at |$\pm 1950\, \mathrm{km\, s^{-1}}$|. Furthermore, two high velocity components centred at |$\pm 5650\, \mathrm{km\, s^{-1}}$| emerges in the +363 d spectrum. The two pairs of satellite components indicate interactions of an asymmetric shock-swept dense shell with the surrounding CSM expelled a few hundred years before the explosion.
Studies of emission lines (mainly [O i] doublet and Mg i]) in the nebular-phase spectrum of SN 2023ixf at +363 d highlight that the geometry of SN 2023ixf’s ejecta does not require a toroidal or disc-like structure to explain the observed double-peaked [O i] profile. Instead, the symmetric peaks arise naturally from the intrinsic doublet nature of [O i] |$\lambda \lambda$|6300, 6364. The observed blue shift of both [O i] and Mg i] suggests the presence of a moderately blueshifted clump or shell of oxygen-rich material moving at |$\sim$|1500 km s|$^{-1}$| toward the observer, overlaid on a broader, near-zero velocity component that likely represents a more spherically symmetric distribution of ejecta. The lower-than-expected [O i] doublet ratio (|$\sim$|1.15) further implies optically thick line emission. These findings indicate a complex ejecta structure with a central symmetric distribution and an additional, directional component rather than a purely toroidal or disc-like morphology.
The analysis of the [O i] doublet flux, combined with comparisons of the +363 d spectrum to modelled spectra, suggests |$M_{\rm O} \approx 0.07-0.30\, \, {\rm M_\odot}$|, |$M_{\rm He}$||$\lesssim$|0.3 |$\, {\rm M_\odot}$|, and |$M_{\rm ZAMS}$||$\lesssim$|12 |$\, {\rm M_\odot}$| for SN 2023ixf. The progenitor mass of SN 2023ixf estimated in this study aligns with numerous previous studies that suggested a low-mass progenitor for SN 2023ixf, based on pre-explosion imaging and hydrodynamical modelling.
The comparison of SN 2023ixf +363 d spectrum with other Type II SNe around the same epoch shows that while most (e.g. SNe 1999em, 2004et, 2006bp, 2012aw, 2013ej, 2020jfo) lack significant late-time interaction signatures, SNe 2014G and 2017ivv show moderate interaction features. In contrast, SN 2023ixf exhibits stronger interaction signatures, indicating a close-in CSM shell formed earlier and located closer to the progenitor. Additionally, SN 2023ixf uniquely displays red-blue asymmetric peaks in H |$\alpha$| and [Ca ii], likely due to dust formation, setting it apart from the comparison sample. This highlights the distinct evolution and interaction dynamics of SN 2023ixf in comparison to other Type II SNe.
This study underscores the importance of further investigation of SN 2023ixf, focusing on the |$\rm UV$| and the evolution of the H |$\alpha$| profile, particularly its blueward and redward components. These regions prominently exhibit the effects of the shock generated by the ejecta–CSM interaction and offer significant potential to constrain the interaction properties and shock power as a key energy source at late times. Overall, continued late-time follow-up of SN 2023ixf will provide valuable insights into the mass-loss history of its progenitor star, offering a deeper understanding of its evolution thousands of years before core collapse.
ACKNOWLEDGEMENTS
AK and JRM are supported by the UK Science and Technology Facilities Council (STFC) Consolidated grant ST/V000853/1. RD acknowledges funds by ANID grant FONDECYT Postdoctorado Nº3220449.
The authors thank Javier Mendez Alvarez for their support in preparing the WEAVE observations. The authors further express their gratitude to Luc Dessart for providing the modelled spectra published in Dessart et al. (2023) and Avinash Singh and Lucia Ferrari for sharing the +141 and +259 d spectra, respectively.
Based on observations made with the William Herschel Telescope operated on the island of La Palma by the Isaac Newton Group of Telescopes in the Spanish Observatorio del Roque de los Muchachos of the Instituto de Astrofísica de Canarias (WEAVE proposal WS2024A2-005).
Funding for the WEAVE facility has been provided by UKRI STFC, the University of Oxford, NOVA, NWO, Instituto de Astrofísica de Canarias (IAC), the Isaac Newton Group partners (STFC, NWO, and Spain, led by the IAC), INAF, CNRS-INSU, the Observatoire de Paris, Région Île-de-France, CONACYT through INAOE, the Ministry of Education, Science and Sports of the Republic of Lithuania, Konkoly Observatory (CSFK), Max-Planck-Institut für Astronomie (MPIA Heidelberg), Lund University, the Leibniz Institute for Astrophysics Potsdam (AIP), the Swedish Research Council, the European Commission, and the University of Pennsylvania. The WEAVE Survey Consortium consists of the ING, its three partners, represented by UKRI STFC, NWO, and the IAC, NOVA, INAF, GEPI, INAOE, Vilnius University, FTMC – Center for Physical Sciences and Technology (Vilnius), and individual WEAVE Participants. Please see the relevant footnotes for the WEAVE website2 and for the full list of granting agencies and grants supporting WEAVE.3
DATA AVAILABILITY
Data can be shared upon request to the corresponding author.
