


ABSTRACT
Some ultra diffuse galaxies (UDGs) reveal many more globular clusters (GCs) than classical dwarf galaxies of the same stellar mass. These UDGs, with a mass in their GC system (|$M_{\rm GC}$|) approaching 10 per cent of their host galaxy stellar mass (|$M_{\ast }$|), are also inferred to have high halo mass to stellar mass ratios (|$M_{\rm halo}/M_{\ast }$|). They have been dubbed Failed Galaxies. It is unknown what role high GC formation efficiencies and/or low destruction rates play in determining the high |$M_{\rm GC}/M_{\ast }$| ratios of some UDGs. Here we present a simple model, which is informed by recent JWST observations of lensed galaxies and by a simulation in the literature of GC mass loss and tidal disruption in dwarf galaxies. With this simple model, we aim to constrain the effects of GC efficiency/destruction on the observed GC richness of UDGs and their variation with the integrated stellar populations of UDGs. We assume no ongoing star formation (i.e. quenching at early times) and that the disrupted GCs contribute their stars to those of the host galaxy. We find that UDGs, with high |$M_{\rm GC}/M_{\ast }$| ratios today, are most likely the result of very high GC formation efficiencies combined with modest rates of GC destruction. The current data loosely follow the model that ranges from the mean stellar population of classical dwarfs to that of metal-poor GCs as |$M_{\rm GC}/M_{\ast }$| increases. As more data becomes available for UDGs, our simple model can be refined and tested further.
1 INTRODUCTION
A subset of low surface brightness galaxies with large effective radii (R|$_\mathrm{ e}$|> 1.5 kpc) and low central surface brightnesses (|$\mu _{\mathrm{ g},0}$|> 24 mag per sq. arcsec) have recently obtained much attention. These ultra diffuse galaxies (UDGs; van Dokkum et al. 2015) are dwarfs with L< 10|$^9$|L|$_{\odot }$| but UDGs are larger than classical dwarfs which have R|$_\mathrm{ e}$|< 1.5 kpc. UDGs have several interesting properties:
They tend to be featureless, lacking components clearly seen in other galaxies such as spiral arms, bars, bulges etc. (van Dokkum et al. 2017).
Found in all environments, with their number proportional to the mass of the environment, e.g. van der Burg et al. (2017), Janssens et al. (2019), La Marca et al. (2022), and Karunakaran & Zaritsky (2023).
Cluster UDGs tend to be red, gas-poor and passive, while field UDGs are mostly blue, gas-rich and star forming, e.g. Román & Trujillo (2017) and Prole et al. (2019).
UDGs in high-density environments tend to have formed earlier and faster (as indicated by their alpha-element ratios) than those in low density environments, e.g. Ruiz-Lara et al. (2018), Gu et al. (2018), and Ferré-Mateu et al. (2023).
While some individual UDGs show clear signs of interaction, e.g. Gannon et al. (2021), Okamoto et al. (2024), most UDGs do not (Mowla et al. 2017).
They host up to several times more GCs, per unit galaxy starlight, than classical dwarfs of the same mass, e.g. Lim et al. (2018) and Forbes et al. (2020).
Cluster UDGs host more GCs per unit starlight on average than UDGs located in lower density environments, e.g. Lim et al. (2020) and Jones et al. (2023).
Assuming that they follow the same GC number versus halo mass relation for normal galaxies (Spitler & Forbes 2009; Harris, Blakeslee & Harris (2017); Burkert & Forbes 2020; Le & Cooper 2024), GC-poor (N|$_{\rm GC}$|< 20) UDGs follow the standard stellar mass–halo mass relation, while the GC-rich (N|$_{\rm GC}$|> 20) UDGs reside in overly massive haloes (Forbes & Gannon 2024).
UDGs with low metallicities for their stellar mass are generally found to be GC-rich, e.g. Buzzo et al. (2022) and Buzzo et al. (2024, MNRAS, submitted).
GC-rich UDGs tend to be of lower surface brightness (Forbes et al. 2020) and rounder, perhaps indicating they are more pressure-supported (Pfeffer et al. 2024).
The presence of two types of UDGs was hinted at in the first study of the GC systems of Coma UDGs (van Dokkum et al. 2017). Recently, a statistical analysis of UDGs by Buzzo et al. (2024) and Buzzo et al. (2024, MNRAS, submitted) found that one type is GC-rich, old, metal-poor, round, with short star formation (SF) time-scales, typically found in high-density environments, and another type that is GC-poor, younger, has metallicities that match the mass–metallicity relation, with longer SF time-scales and typically found in low density environments.
Several models for the formation of UDGs have focused on external processes due to their environment, e.g. Yozin & Bekki (2015), Jiang et al. (2019), Carleton et al. (2021), and Benavides et al. (2021). Such models provide a possible mechanism for tidally puffing-up a dwarf galaxy giving it a larger size for its stellar mass. Given that some UDGs are located well outside clusters, there must be a formation mechanism that does not depend on environment. Indeed, several studies have focused on internal mechanisms such as high spin (Amorisco & Loeb 2016) or episodic feedback from supernovae (Di Cintio et al. 2017). These models are often referred to as ‘Puffy Dwarf’ models since an initial classical dwarf galaxy can be puffed-up in size, and reduced in surface density, thereby matching the definition of a UDG.
An alternative is the ‘Failed Galaxy’ scenario (van Dokkum et al. 2015; Peng & Lim 2016; Danieli et al. 2022; Forbes & Gannon 2024). In this scenario a large number of GCs formed within a substantial dark matter halo but for some unknown reason the galaxy quenched before many field stars could form. It could be due to quenching at early times by infall and gas removal as the UDG enters a group/cluster (Mistani et al. 2016; Doppel et al. 2023), although supporting evidence is not clearly seen in the currently available data for cluster UDGs (Gannon et al. 2022; Forbes et al. 2023). This environmental quenching cannot be the mechanism for isolated UDGs (Janssens et al. 2022). Alternatively, quenching might be the result of an interaction with a filament or cosmic sheet (Pasha et al. 2023), isotropic gas accretion at high redshift (Kimmig et al. 2023), or some form of self-quenching due to feedback from an intense period of GC formation so that the gas is no longer available to form stars (Danieli et al. 2022).
The GC systems of UDGs are clearly a key element in understanding the nature and origin of UDGs. GC richness is often described simply in terms of the total number of GCs (|$N_{\rm GC}$|) that a galaxy hosts. For dwarf galaxies, the absolute number can be quite low, even zero (Forbes et al. 2018b), but perhaps a better measure is that of the relative number. Compared to classical dwarf galaxies of the same stellar mass, UDGs have, on average, several times more GCs (Forbes et al. 2020; Lim et al. 2020). This difference can be quantified by examining the specific frequency of GCs, |$S_{\rm N}$|, which normalizes for galaxy luminosity, i.e. |$S_{\rm N}$| = |$N_{\rm GC}$| 10|$^{0.4 (M_\mathrm{ V} + 15)}$|.
However, to remove the effects of different stellar populations it is better to use stellar mass. Here, we use the ratio of GC system mass (|$M_{\rm GC}$|) divided by host galaxy stellar mass (|$M_{\ast }$|) expressed as a percentage. We note that other literature works refer to this quantity as S|$_\mathrm{ M}$|. In order to convert the number of GCs into a GC system mass, we assume a constant mean GC mass of 2 |$\times$| 10|$^5$| |$\mathrm{M}_{\odot }$| for all dwarf galaxies (similar to that for the GCs of the Milky Way; Jordán et al. 2006; Harris, Harris & Alessi 2013). While there is some evidence that the mean mass of a GC may be slightly smaller in lower mass galaxies (Harris et al. 2013), it is not yet clear if this applies to UDGs. Indeed, one of the most complete luminosity (mass) functions for a GC system associated with a UDG is that of NGC5846_UDG1 (Danieli et al. 2022), which reveals a peak luminosity at the same value as the Milky Way.
Forbes et al. (2020) showed that Coma cluster UDGs have a wide range of |$M_{\rm GC}/M_{\ast }$| ratios from 0 per cent to |$\sim$|10 per cent with an average of |$\sim$|5 per cent. Other classical dwarf galaxies also span a range of values, but have averages closer to 1 per cent for classical Coma dwarfs and 0.5 per cent for Local Volume dwarf galaxies. For comparison, the stellar halo of the Milky Way has a ratio of around 1–2 per cent (Larsen, Strader & Brodie 2013). This indicates that classical dwarfs cannot be simply puffed-up in size (with no change in total stellar mass or GC content) to explain the GC-rich UDGs with the highest |$M_{\rm GC}/M_{\ast }$| ratios (see also Saifollahi et al. 2022). Recent SED fitting work by Buzzo et al. (2024, MNRAS, submitted) divided UDGs into two classes and found class A (associated with puffy dwarfs) to have an average |$M_{\rm GC}/M_{\ast }$| = 0.8|$\pm$| 0.4 per cent and class B (associated with failed galaxies) with |$M_{\rm GC}/M_{\ast }$| = 3.9|$\pm$|0.5 per cent. This raises questions, such as why do some UDGs have much more mass in their GC systems GCs per unit stellar mass than classical dwarfs? Is it due to efficient GC formation or relatively inefficient GC destruction?
Here, we investigate whether the stellar population properties of UDGs vary in a systematic way with the observed |$M_{\rm GC}/M_{\ast }$| ratio today. In other words, we study UDGs that range from GC-poor puffy dwarfs (with expected low |$M_{\rm GC}/M_{\ast }$|) to those of GC-rich failed galaxies (with expected high |$M_{\rm GC}/M_{\ast }$|). In Section 2, we summarize the current observed upper limit for |$M_{\rm GC}/M_{\ast }$| and in Section 3 describe the properties expected for a failed galaxy. Section 4 discusses GC formation and destruction processes. In Section 5 we present a simple model to characterize these processes. We describe our stellar population data and compare it to our simple model predictions in Section 6. Section 7 lists a few examples from the literature of possible failed galaxies. Finally, we give our summary and conclusions in Section 8.
2 What is the upper limit to |$M_{\rm GC}/M_{\ast }$| ratio for UDGs in the local Universe?
The spectroscopy-based UDG catalogue of Gannon et al. (2024) lists two galaxies with apparently |$M_{\rm GC}/M_{\ast }$|>10 per cent. They are NGVSUDG-20 and VLSB-B, both located in the Virgo cluster. Both have relatively low stellar masses of |${\sim} 10^7$| |$\mathrm{M}_{\odot }$| (Gannon et al. 2024). NGVSUDG-20 has 11 GC candidates with a large uncertainty of |$\pm$|8.6. Toloba et al. (2023) confirm 6 GCs and derive a very high velocity dispersion (89 km/s). Forbes & Gannon (2024) noted the extreme case of the disturbed galaxy VLSB-B, with 26 GC candidates (14 of which have been confirmed spectroscopically Toloba et al. 2023), giving it a ratio of 14 per cent (confirmed) to 23 per cent (all candidates). However, again the GC velocity dispersion is quite high (45 km/s). In both cases, the velocity dispersion is very high for the galaxy stellar mass (see fig. 7 of Toloba et al. 2023) which we believe hints at some of the GCs being unbound and/or interlopers.
Recently, Fielder et al. (2023) have presented a disturbed UDG (UGC 9050-Dw1) with HST imaging of its GC system, deriving a total GC system of 52. Assuming our method with a universal mean GC mass, the ratio is |$\sim$|30 per cent (their own method, based on the ratio of the GC system flux to galaxy flux, places it closer to 20 per cent). UGC 9050-Dw1 may have one of the highest ratios known, but caution is warranted as the study may have underestimated the background contamination level as it made use of a different HST instrument on an offset field in order to estimate this background. At 35 Mpc it will be extremely difficult to confirm any of its GCs with spectra.
Another extreme galaxy worthy of mention is the IKN dwarf. It is nearby (D|$\sim$| 3.6 Mpc) with a size and surface brightness similar to those of UDGs. This galaxy has 5 GCs (Georgiev et al. 2010; Forbes et al. 2024 ) giving it |$M_{\rm GC}/M_{\ast }$| of |$\sim$|10 per cent. Lianou, Grebel & Koch (2010) have suggested IKN experienced substantial galaxy mass loss due to a past interaction. If this interaction has removed more stars than GCs then |$M_{\rm GC}/M_{\ast }$| may have been artificially inflated. It is also difficult to correctly measure its stellar mass due to a nearby bright foreground star.
Perhaps the most reliable example of a UDG with a high |$M_{\rm GC}/M_{\ast }$| ratio is NGC5846_UDG1 (also known as MATLAS-2019). From 2-orbit HST imaging the number of GCs was determined to be 54 and the GC luminosity function showed a peak consistent with that of the Milky Way’s GC luminosity function, i.e. M|$_\mathrm{ V}$| = –7.5 (Danieli et al. 2022). They noted that the 34 brightest, centrally located GCs have an estimated contamination rate of only 0.15 GC. Using our method for 54 GCs, and a stellar mass from the database of Gannon et al. (2024), this corresponds to |$M_{\rm GC}/M_{\ast }$| of 9.8 per cent. We note that Danieli et al. (2022) quote a ratio of 13 per cent; the difference being due to their higher assumed mean GC mass of 2.5 |$\times$| 10|$^5$||$\mathrm{M}_{\odot }$|.
To summarize, there are examples of UDGs in the local Universe today with remarkably high |$M_{\rm GC}/M_{\ast }$| ratios, but, 10 per cent is probably the upper limit that we can currently use with high confidence. While some UDGs show clear evidence for a tidal interaction, the bulk of UDGs do not (Mowla et al. 2017).
The original GC system mass in a galaxy is expected to be much higher than today due to the disruption of GCs (Forbes et al. 2018a). The stars lost from these GCs would now contribute to the stellar mass of the galaxy. The implication of high |$M_{\rm GC}/M_{\ast }$| ratios today is that the mass contained in GCs at formation was much more significant, and that today the integrated stellar populations of the field stars may be similar to those of old, metal-poor GCs. For example, in two simulations of the Fornax dwarf galaxy by Chen & Gnedin (2023), the GC system was initially up to 5–8|$\times$| more numerous than the final number of half a dozen, due to disruption over cosmic time. This is supported by detailed observations of the chemical abundances of the Fornax GCs which place an upper limit on the original mass of the GC system to be 4–5× that of today (Larsen, Strader & Brodie 2012).
3 High |$M_{\rm GC}/M_{\ast }$| galaxies as failed galaxies
As mentioned in the Introduction, a ‘failed galaxy’ is a proposed pathway for UDGs that formed in a massive halo with an effective radius similar to that of a giant galaxy, but, for some reason, formed a stellar mass more similar to that of a dwarf galaxy. Massive haloes are associated with rich GC systems for normal galaxies (Burkert & Forbes 2020), thus failed galaxy UDGs are also expected to host large numbers of GCs for their stellar mass, i.e. extremely high |$M_{\rm GC}/M_{\ast }$| ratios.
The large number of GCs may have played a key role in self-quenching the galaxy (Forbes & Gannon 2024). We might expect the GC system to have a similar radial extent as that of its host galaxy given that disrupted GCs can make a significant contribution to its field stars. Failed galaxies may have formed GCs very efficiently, perhaps due to high gas pressures (Kruijssen 2012) which in turn is reflected in rounder dwarf galaxies that are pressure-supported (Pfeffer et al. 2024). Indeed, there is some evidence that rounder dwarf galaxies do have higher |$M_{\rm GC}/M_{\ast }$| values (Pfeffer et al. 2024). Failed galaxies may also have stellar populations that resemble metal-poor GCs and so lie below the standard dwarf galaxy mass-metallicity relation. Observations provide some support for this with UDGs of low metallicity (for their stellar mass) found to be GC-rich, i.e. |$N_{\rm GC}$|> 20 (Buzzo et al. 2022 Ferré-Mateu et al. 2023). Forbes & Gannon (2024) found that such GC-rich UDGs were most likely hosted in overly massive haloes with cored profiles. Overly massive haloes lie off the standard stellar mass–halo mass relation in the direction of galaxies that have assembled late with low halo concentrations and/or been quenched early.
In summary, failed galaxies might be expected to have:
High |$M_{\rm halo}/M_{\ast }$| ratio,
Rich GC systems.
High |$M_{\rm GC}/\mathrm{M}_{\odot }$|.
Field stars with GC-like stellar populations (i.e. low metallicity, old ages and enhanced in alpha elements).
Relatively flat, or even rising, stellar population gradients.
GC system with a similar size to the host galaxy (R|$_{\rm GC}$|/R|$_\mathrm{ e}$||$\sim$| 1).
A round host galaxy.
Pressure-supported stellar kinematics.
Here, we explore how the stellar populations of UDGs vary with |$M_{\rm GC}/M_{\ast }$| ratio. We note that Peng & Lim (2016) first coined the phrase ‘pure stellar halo’ for the Coma cluster UDG DF17 which they described as a sub-L|$^{\ast }$| failed galaxy. It has an |$M_{\rm GC}/M_{\ast }$| ratio of about 2.5 per cent. In the next sections, we discuss GC formation and destruction processes and create a simple model for how |$M_{\rm GC}/M_{\ast }$| depends on the interplay of these two processes.
4 GLOBULAR CLUSTER FORMATION AND DESTRUCTION PROCESSES
The number of GCs, or the mass of the GC system, observed today is a combination of GC formation, accretion (e.g. mergers), removal (e.g. tidal stripping), mass loss and disruption over time. For dwarf galaxies, accretion of fully-formed, ex-situ GCs (and stars) is expected to make only a small contribution, if any, to the ratio of GC mass to galaxy mass (given that GCs and galaxy stars will be accreted in similar proportions). Similarly, the ratio would remain largely unchanged in tidal stripping since the GC system and stars have a similar radial extent in dwarfs (Forbes 2017; Hudson & Robison 2018; Saifollahi et al. 2022), and so would be removed in similar proportions.
Here, we briefly discuss what processes determine GC formation and what processes that control their destruction (and thus how their stars contribute to the field star population of their host galaxy).
The formation efficiency of GCs is strongly related to the overall star cluster formation efficiency (CFE). The CFE is defined as the fraction of bound clusters as a fraction of the total stellar mass formed. The model of Kruijssen (2012) predicted that CFE is primarily driven by the gas surface density in the host galaxy, and good agreement was shown between their predicted CFE and observations in the local Universe. This formation model is incorporated into the EAGLE cosmological simulation, along with GC destruction, to predict the properties of GC systems (Pfeffer et al. 2018).
In the Gnedin models, e.g. Chen & Gnedin (2023), GC formation is dependent on the accretion rate and gas mass. Similarly, the EMERGE-based model of Valenzuela et al. (2021) also assumes that when the accretion rate passes some threshold, GC formation is triggered. Chen, Mo & Wang (2024) noted that low metallicity gas also acts to enhance the fraction of stars formed in bound clusters. Therefore GC formation is most efficient at higher redshifts where high gas pressures and accretion rates are combined with low metallicities. Any subsequent SF after this epoch would tend to reduce the GC mass to stellar mass ratio as it will be less efficient at forming GCs relative to field stars.
As noted above, the GC content of a galaxy today is not simply a function of its formation efficiency but also the efficiency by which GCs are disrupted. The destruction of GCs over time has been described in classic works such as Aguilar, Hut & Ostriker (1988) and Gnedin & Ostriker (1997). Briefly, GCs are subject to internal and external destruction processes. Internal ones include two-body relaxation and mass loss due to stellar evolution. Mass-loss dominates in the early stages of GC formation. External processes are due to the tidal field of the host galaxy (Gieles & Baumgardt 2008) – these can include disc and bulge shocking which remove stars when the GC experiences the tidal field of a disc or bulge. These processes all tend to reduce the mass of individual GCs, the total mass of the GC system and ultimately the number of GCs present with shocks being the most efficient process at early times. These processes evolve an initial power-law distribution into the well-known Gaussian GC luminosity function (Chen & Gnedin 2023). Any stars liberated from disrupted GCs will add to the field star population of the host galaxy.
Dynamical friction is also an external process, which tends to cause in-spiralling of the more massive GCs, and may lead to the formation of a galaxy nucleus from merged GCs (e.g. Fahrion et al. 2022). In this case, the number of GCs is reduced. The GC system mass will also be reduced if the nucleus is counted separately. With some nuclei located slightly off centre, they may, or may not, be included in the GC system count. The importance of dynamical friction in modifying a GC system in a dwarf galaxy depends strongly on the dark matter density profile–cuspy profiles, with high-density inner regions, will tend to accelerate the in-spiralling process, whereas it will be much reduced for lower density cored profiles. For example, a core profile has been invoked to explain the presence of several old-aged GCs in the Fornax dwarf galaxy, e.g. Cole et al. (2012).
Dwarf galaxies have much weaker tidal fields than giant galaxies, and in the case of UDGs, may lack structures such as discs and bulges, so tidal shocks are expected to be much less important in disrupting the GC systems of dwarfs. Using a cosmological simulation with an N-body code, Moreno-Hilario et al. (2024) recently modelled the evolution of GCs in classical dwarf galaxies including both internal mass-loss and disruption from external environmental effects. Starting with a power-law distribution of cluster masses they followed GCs within dwarf galaxies of different total masses. They found that lower mass, and lower density, galaxies had lower GC disruption rates. The latter might explain why UDGs, with lower stellar densities than classical dwarfs, have more GCs per unit starlight today (Forbes et al. 2020). We note that their model galaxies were drawn from a cosmological simulation and so follow the standard stellar mass–halo mass relation by design.
Finally, we note that the deep HST imaging of NGC5846_UDG1 reveals a standard GC luminosity function shape (Danieli et al. 2022). This implies that the destruction processes that have modified an initial power-law mass distribution have operated in NGC5846_UDG1 in a similar overall manner to that of other dwarf and giant galaxies.
5 A SIMPLE MODEL FOR GC FORMATION AND DESTRUCTION
Based on the discussion above, we now describe a simple model for the evolution of the GC-to-stellar mass ratio over cosmic time to better understand the high ratios observed for some UDGs today. We assume that the initial mass formed in GCs (|$M_{\rm GC,i}$|) to that in field stars (|$M_{\ast ,\mathrm{ i}}$|) at high redshift is equivalent to the GC formation efficiency (c) i.e.
We further assume that due to destruction processes, the current final mass in GCs (|$M_{\rm GC,f}$|) is some fraction of that initially, i.e.
where d is the destruction fraction.
Assuming that the galaxy is quenched early with no further SF and no loss/gain of field stars (e.g. due to tidal interactions or accretion), then the current field star mass is simply the original one plus the mass of stars disrupted from GCs, i.e.
The ratio observed today of GC system mass to stellar mass in percentage terms (or S|$_\mathrm{ M}$|) is:
Replacing the above we have
or
Equation (6) shows that |$M_{\rm GC}/M_{\ast }$| today in this simple model, depends on only the GC formation efficiency (c) and the destruction fraction (d). For example, in the absence of any destruction (d = 0), |$M_{\rm GC}/M_{\ast }$| today equals |$M_{\rm GC}/M_{\ast }$| at formation (c|$\times$| 100). If no GCs form (c = 0), then |$M_{\rm GC}/M_{\ast }$| = 0.
Similarly, the mass in disrupted GCs relative to the final stellar mass of the galaxy is
GC formation was most efficient at the earliest epochs when gas surface densities were high. In the models of Choksi & Gnedin (2019), star cluster formation is some 20|$\times$| more efficient at z = 10 compared to today due to high rates of gas accretion at early times. In the models of Kruijssen (2012) the CFE in the early Universe has fractions of up to 80 per cent. At formation, a proto-GC may have contained 4–5 (Larsen et al. 2012) to 10 (Renzini 2017) times as much mass as a GC today. Renzini (2017) inferred that the mass in proto-GCs was roughly equal to half of the total stellar mass. If SF was highly preferenced to be in GCs over that of individual field stars and if proto-GCs were originally significantly more massive then the GC formation efficiency (c) could in principle exceed unity.
Observational constraints on c shortly after the formation of GCs are now available from JWST observations of lensed galaxies (although only a few examples are available, they have the advantage of being largely randomly selected galaxies). Several recent examples of galaxies at large look-back times are now available. For the ‘Cosmic Grapes’ galaxy at z|$\sim$| 6, the light in the star forming clumps is some 70 per cent of the total light (Fujimoto et al. 2024). The ‘Firefly Sparkle’ galaxy (Mowla et al. 2024), with a stellar mass of 4 |$\times$| 10|$^6$||$\mathrm{M}_{\odot }$|, is at a redshift z = 8.3 corresponding to a look-back time of over 13 billion years. Its ten star clusters have typical ages of |$\sim$|100 Myr and masses from 2 to 6 |$\times$| 10|$^5$||$\mathrm{M}_{\odot }$|. The total mass of these 10 star clusters is 49–57 per cent of the total stellar mass of the host galaxy. The ‘Cosmic Gems’ galaxy at z|$\sim$| 10.2 formed only 460 Myr after the big bang (Adamo et al. 2024 ). Its half dozen star clusters have individual masses of 1–2.6 |$\times$| 10|$^6$| |$\mathrm{M}_{\odot }$|, and a combined stellar mass of around 30 per cent that of the host galaxy. The star clusters have compact sizes of 1–2 pc and of high density suggesting they are gravitationally-bound. These JWST observations are likely detecting the brightest GCs shortly after their formation. Lower mass clusters are likely present but undetected implying that the current fractions are lower limits to the true value. Another implication from the ‘Cosmic Gems’ galaxy at z = 10.2, is that the original proto-GCs have already undergone significant mass loss so that they start to resemble bona fide GCs in terms of their sizes and masses only |$\le$|500 Myr after formation. This early phase of GC formation appears to be associated with a short-lived but intense period of SF (Topping et al. 2024).
To constrain the destruction fraction of GCs we must use theoretical models. In their model of dwarf galaxies, Moreno-Hilario et al. (2024) found GC system total destruction rates (i.e. including mass loss and tidal disruption) of 70–88 per cent after 10–12 Gyr. They also found that low density galaxies, like UDGs, have the lowest destruction rates. Based on their findings, we assume variations in d from 0.7 to 0.9 for UDGs. A destruction rate of 1.0 would mean no GCs at the present day, and so |$M_{\rm GC}/M_{\ast }$| = 0. We note for the MW, the contribution of stars from disrupted GCs to the stellar mass of the halo is estimated to be at least 25 per cent (Schiavon et al. 2017).
To explore how GC formation and destruction affects |$M_{\rm GC}/M_{\ast }$| in our simple model, we show in Fig. 1 the dependency of |$M_{\rm GC}/M_{\ast }$| for fixed destruction fractions of d = 0.7, 0.8, and 0.9 and a variable GC formation efficiency c. The plot shows that UDGs with low |$M_{\rm GC}/M_{\ast }$| ratios (i.e. puffy dwarfs) may have experienced very low GC formation efficiencies and/or very high destruction fractions. In order to achieve the observed upper limit of |$M_{\rm GC}/M_{\ast }$||$\sim$| 10 per cent (corresponding to failed galaxies), destruction fractions of |$\sim$|70 per cent (80 per cent) require modest GC formation efficiencies of |$\ge$|40 per cent (80 per cent). For destruction fractions of 90 per cent efficiencies over 100 per cent would be needed to reach |$M_{\rm GC}/M_{\ast }$||$\sim$| 10 per cent. These GC destruction fractions and formation efficiencies are consistent with the dwarf galaxy simulations of Moreno-Hilario et al. (2024) and recent JWST observations of high redshift lensed systems.
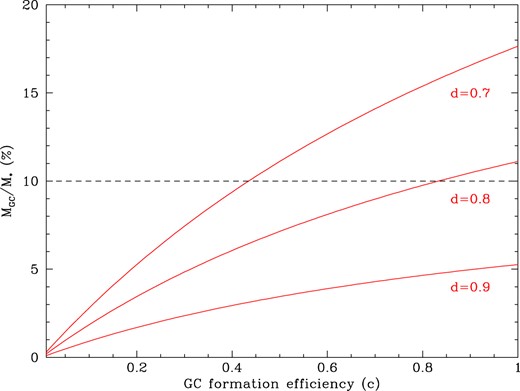
|$M_{\rm GC}/M_{\ast }$| as a function of GC formation efficiency (c). Three curves, from equation 6, show GC destruction fractions of d = 0.7, 0.8, and 0.9. Destruction includes mass-loss and tidal disruption. In order to reproduce the observed upper limit today for UDGs of |$M_{\rm GC}/M_{\ast }$||$\sim$| 10 per cent (dashed line) a combination of either modest GC destruction rates (|$\sim$|70–80 per cent) and/or very high GC formation efficiencies (|$\ge$|40 per cent) are required. GC-poor galaxies with low |$M_{\rm GC}/M_{\ast }$| ratios suggest low GC formation efficiency and/or high destruction rates.
If we hold the destruction fraction constant, then higher GC formation efficiencies are associated with higher |$M_{\rm GC}/M_{\ast }$| ratios. However, at a fixed GC formation efficiency, higher |$M_{\rm GC}/M_{\ast }$| ratios require a decrease in the destruction fraction. Thus c and d have an inverse relationship with each other in terms of how they affect the |$M_{\rm GC}/M_{\ast }$| ratio.
GC formation and destruction processes might be expected to lead to differences in the integrated stellar populations of the galaxy field stars as |$M_{\rm GC}/M_{\ast }$| changes. At a given GC formation efficiency, higher GC destruction fractions would imply that more GCs have been disrupted, contributing to the field stars of the galaxy, giving rise to more GC-like integrated stellar populations and lower ratios since |$M_{\rm GC}$| is reduced while |$M_{\ast }$| increases. However, for a fixed modest destruction fraction, higher GC formation efficiencies are associated with higher |$M_{\rm GC}/M_{\ast }$| ratios and the integrated stellar populations become more GC-like due to the high rate of GCs that have been formed and then disrupted. We explore this further in the next section.
6 THE VARIATION OF ULTRA DIFFUSE GALAXY STELLAR POPULATIONS WITH GLOBULAR CLUSTER SYSTEM MASS
In order to study the stellar populations of UDGs we use the recent catalogue of Gannon et al. (2024). This compilation includes UDGs with spectroscopic stellar populations (largely from Ferré-Mateu et al. 2023) and/or velocity dispersions. It includes GC counts from a variety of sources (mostly derived from HST imaging). We include all UDGs from the catalogue with both stellar population and GC count information. However, for NGC5846_UDG1 we have decided to adopt the average of the four stellar population parameters from the literature.
These studies are Müller et al. (2020), Ferré-Mateu et al. (2023), Heesters et al. (2023), and Buzzo et al. (2024; the first three are spectroscopic and the latter is from spectral energy distribution fitting). This gives an age of 11.0 |$\pm$| 2.0 Gyr and metallicity [M/H] = –1.53|$\pm$|0.2. For the alpha element ratio, the only value available is that of Ferré-Mateu et al. (2023) who found [Mg/Fe] = 0.54|$\pm$|0.18. We use the same GC count and stellar mass for UDG1 as listed in the Gannon et al. (2024) catalogue, giving |$M_{\rm GC}/M_{\ast }$| = 9.8 per cent. We also add the recent GC counts from Janssens et al. (2024) for PUDG_R15 (13|$\pm$|5) and PUDG_R84 (43|$\pm$|6). Unfortunately, VCC 615 (|$M_{\rm GC}/M_{\ast }$| = 8.3 per cent) and NGVSUDG-19 (|$M_{\rm GC}/M_{\ast }$| = 5.4 per cent) are excluded as they lack stellar population information.
The stellar population values for each galaxy and its |$M_{\rm GC}/M_{\ast }$| ratio in our sample are summarized in Table 1. Biases in the catalogue are discussed in Gannon et al. (2024). For example, other than DGSAT 1 (Janssens et al. 2022) located in the field, the UDGs are located in high-density environments. We also note that for DGSAT I we assume the same mean GC mass as the other UDGs, although in this case there is evidence that some of the GCs may be more massive by a factor of |$\sim$|3× than is typical (Janssens et al. 2022). As noted in Gannon et al. (2024), the catalogue has a bias against GC-poor UDGs. We note that metallicity, in particular, has a strong dependence on stellar mass for dwarf galaxies (e.g. Simon 2019) but our UDG sample has a relatively small range in mass and we do not attempt to correct for the mass-metallicity relation. While ages and metallicities are available for more UDGs from SED fitting studies, such studies lack [Mg/Fe] measurements and tend to have large uncertainties on their |$M_{\rm GC}/M_{\ast }$| ratios.
GC system and stellar population properties for UDGs. Column 1: UDG name, column 2: GC system mass to galaxy stellar mass, column 3: galaxy total metallicity, column 4: galaxy age, column 5: galaxy [Mg/Fe] ratio. Uncertainties are given in round brackets. |$^{\dagger }$| Janssens et al. (2022) found DGSAT I to have higher mass GCs than the typical mean value assumed here of 2 |$\times$| 10|$^5$||$\mathrm{M}_{\odot }$|.
| Name | |$M_{\rm GC}/M_{\ast }$| (%) | [M/H] (dex) | Age (Gyr) | [Mg/Fe] (dex) |
|---|---|---|---|---|
| DF44 | 4.9 (1.2) | –1.33 (+0.05, –0.04) | 10.23 (1.50) | –0.1 (0.06) |
| DF07 | 1.1 (0.3) | –0.78 (0.18) | 11.18 (1.27) | 0.6 (0.4) |
| DF17 | 2.1 (0.3) | –0.83 (+0.56, –0.51) | 9.11 (2.0) | – (–) |
| DF26 | 1.3 (1.3) | –0.56 (0.18) | 7.88 (1.76) | 0.38 (0.17) |
| DFX1 | 3.6 (1.0) | –1.08 (0.21) | 8.84 (1.13) | 0.57 (0.4) |
| DGSAT I | 0.6 (0.1)|$^{\dagger }$| | –1.8 (0.4) | 8.1 (0.4) | 1.5 (0.5) |
| Hydra I-UDG11 | 2.2 (0.9) | –1.2 (0.1) | 10 (1.0) | – (–) |
| NGC1052-DF2 | 0.7 (+0.7, –0.4) | –1.07 (0.12) | 8.9 (1.5) | 0 (0.05) |
| NGC5846_UDG1 | 9.8 (1.6) | –1.53 (0.2) | 11 (2.0) | 0.54 (0.18) |
| PUDG-R15 | 1.0 (0.4) | –0.93 (0.32) | 11.32 (2.5) | 0.44 (0.2) |
| PUDG-R84 | 3.9 (0.6) | –1.48 (0.46) | 8.99 (3.2) | 0.22 (0.3) |
| VCC1287 | 2.2 (0.8) | –1.06 (0.34) | 9.09 (1.07) | 0.56 (0.11) |
| Yagi358 | 4.1 (0.8) | –1.56 (0.6) | 9.81 (2.46) | 1.4 (0.2) |
Fig. 2 shows the observed stellar populations for our UDG sample as a function of their observed |$M_{\rm GC}/M_{\ast }$| ratio, ranging from |$M_{\rm GC}/M_{\ast }$| = 0 per cent (puffy dwarf) to 10 per cent (failed galaxy). The UDG with the highest ratio of 9.8 per cent is NGC5846_UDG1 (see Table 1). The panels show metallicity [M/H], age (in Gyr) and [Mg/Fe]. The data show a decrease in metallicity (|$\sim$|0.45 |$\pm$| 0.1 dex) and a weak hint of older ages (|$\sim$|0.6 |$\pm$| 1 Gyr) as the ratio of GC system mass to stellar mass increases. There is no clear trend for [Mg/Fe], which shows a large scatter in values. It is not clear if this large scatter in [Mg/Fe] is due to observational uncertainty or represents an intrinsic variation in UDGs.
![Galaxy stellar populations as a function of GC system mass to host galaxy stellar mass $M_{\rm GC}/M_{\ast }$. Panels show total metallicity (in dex), age (in Gyr) and [Mg/Fe] (in dex) from top to bottom, respectively. The red lines represent our simple model starting at $M_{\rm GC}/M_{\ast }$ = 0 (puffy dwarfs) and as $M_{\rm GC}/M_{\ast }$ increases the stellar population changes to be more GC-like with weights given by the fraction of disrupted GC mass (see text for details). The solid and dashed lines show the effect of increasing GC formation efficiency for a fixed the GC destruction fraction of d = 0.7 and 0.8 respectively. The long dashed blue lines indicate a constant GC-like stellar population (as might be the case if a UDG formed with GC-like stellar populations and had no further SF). Data points are our sample of UDGs (see Table 1), which are mostly located in high-density environments, come from the catalogue of Gannon et al. (2024). DGSAT I is a field UDG with higher mass GCs than typically found (Janssens et al. 2022); the value plotted of $M_{\rm GC}/M_{\ast }$ = 0.6 per cent is a lower limit. The vertical line at 2.5 per cent represents a possible division between puffy dwarfs and failed galaxies (Peng & Lim 2016). The top axis label shows approximate corresponding $S_{\rm N}$ values. The data, and the models, show a decrease in metallicity and a slight increase in age with increasing $M_{\rm GC}/M_{\ast }$ ratio. The [Mg/Fe] data shows considerable scatter with no clear trend.](https://oup.silverchair-cdn.com/oup/backfile/Content_public/Journal/mnras/536/2/10.1093_mnras_stae2675/1/m_stae2675fig2.jpeg?Expires=1750251740&Signature=XEYcpehLvscGWddh-6kcb-fgHLDqJg7eYDjhipqx6-tXV5yJCKS3LxB0NTq-wOa1XlNoikdxWbh2ngLq9RuTSrSeAqjMRbU8aB-I6qr7cMN~9Irk3q-2rZcvpDHnujIg-HImJ-iZ5ZZMgMWWSN2qhz1Pel1iPvU8RNbU~xIBzokKFs9IkgNM2g-sk~jfg1~juUV45uKBL3i-aA179ywSML6EBcd~oRAx~W6MT9EhJeudUzngB4pcYCWWP6BIokwkeoJVAWGD1Pfxh2L4UrjNfdKM7cQbAs68a-MYwwoFUo3aj5uaXNjTpgtZlDfRx9Avrk2SawWUTWk41K-tAFuaHA__&Key-Pair-Id=APKAIE5G5CRDK6RD3PGA)
Galaxy stellar populations as a function of GC system mass to host galaxy stellar mass |$M_{\rm GC}/M_{\ast }$|. Panels show total metallicity (in dex), age (in Gyr) and [Mg/Fe] (in dex) from top to bottom, respectively. The red lines represent our simple model starting at |$M_{\rm GC}/M_{\ast }$| = 0 (puffy dwarfs) and as |$M_{\rm GC}/M_{\ast }$| increases the stellar population changes to be more GC-like with weights given by the fraction of disrupted GC mass (see text for details). The solid and dashed lines show the effect of increasing GC formation efficiency for a fixed the GC destruction fraction of d = 0.7 and 0.8 respectively. The long dashed blue lines indicate a constant GC-like stellar population (as might be the case if a UDG formed with GC-like stellar populations and had no further SF). Data points are our sample of UDGs (see Table 1), which are mostly located in high-density environments, come from the catalogue of Gannon et al. (2024). DGSAT I is a field UDG with higher mass GCs than typically found (Janssens et al. 2022); the value plotted of |$M_{\rm GC}/M_{\ast }$| = 0.6 per cent is a lower limit. The vertical line at 2.5 per cent represents a possible division between puffy dwarfs and failed galaxies (Peng & Lim 2016). The top axis label shows approximate corresponding |$S_{\rm N}$| values. The data, and the models, show a decrease in metallicity and a slight increase in age with increasing |$M_{\rm GC}/M_{\ast }$| ratio. The [Mg/Fe] data shows considerable scatter with no clear trend.
As well as examining how the stellar population properties of UDGs vary with GC system mass, we also wish to compare the observations with predictions from our simple model of GC formation and destruction. The stellar populations of a puffy dwarf UDG (i.e. a dwarf galaxy that is puffed up in size and made more diffuse with a low |$M_{\rm GC}/M_{\ast }$| ratio) might be expected to resemble that of a classical dwarf galaxy if the puffing-up process does not modify its stellar population. This is probably true when puffy dwarfs are simply the high spin tail of a dwarf galaxy distribution (Amorisco & Loeb 2016) but less so if multiple supernovae bursts (Di Cintio et al. 2017) is the formation mechanism. Failed galaxies (with high |$M_{\rm GC}/M_{\ast }$| ratios) might be expected to have stellar populations similar to those of metal-poor GCs if their GCs formed very efficiently and were also largely destroyed so that GC stars now contribute to the overall galaxy stellar population (Ferré-Mateu et al. 2018). Similarly, mass loss at the proto-GC stage would also contribute GC stars to the field star stellar population.
In Fig. 2, we also show our simple model as a function of |$M_{\rm GC}/M_{\ast }$|, which is given by equation 6. We start by assigning a stellar population value for UDGs with |$M_{\rm GC}/M_{\ast }$| = 0. Rather than use a proxy such as classical dwarf galaxies, we use the average value for the 5 sample UDGs with |$M_{\rm GC}/M_{\ast }$|< 1.5 per cent to represent a puffy dwarf. This can be improved in the future when more spectroscopic studies of GC-poor UDGs are conducted. From these 5 UDGs we find mean values of [M/H] = –1.03, age = 9.5 Gyr and [Mg/Fe] = 0.58 dex. We use these values as the ‘zero point’ for the stellar population of a UDG with |$M_{\rm GC}/M_{\ast }$| = 0, i.e. a puffy dwarf.
As GCs are disrupted they contribute to the integrated stellar populations of the UDG. To characterize the mean stellar population of old, metal-poor GCs we assume a mean age of 12.5|$\pm$|1 Gyr, mean metallicities [M/H] of –1.5|$\pm$|0.3 and [Mg/Fe] of +0.4|$\pm$|0.1 from the compilation of Milky Way GCs by Recio-Blanco (2018). To account for the contribution of disrupted GCs to the stellar population of the host galaxy we weight the stellar population using equation (7). For example, if the destruction fraction d = 0.7 and the formation efficiency c = 0.4, then the resulting stellar population has a contribution from disrupted GCs (age 12.5 Gyr) weighted by 0.22 (equation 7) and the original stellar population of the stars (age 9.5 Gyr) weighted by 1–0.22 = 0.78 to get 0.22 |$\times$| 12.5 + 0.78 |$\times$| 9.5 = 10.2 Gyr. Following Fig. 1, we show two model tracks in Fig. 2 for a fixed destruction fraction of d = 0.7 (solid line) and d = 0.8 (dashed line) with the GC formation efficiency (c) allowed to vary. We remind the reader that destruction in the Moreno-Hilario et al. (2024) models includes GC mass-loss. The model curves reveal a decrease in metallicity and increase in age, approaching a GC-like stellar population (and the location of NGC5846_UDG1) at the highest |$M_{\rm GC}/M_{\ast }$| ratio. The effect of increasing destruction from d = 0.7 to 0.8 further decreases the metallicity and increases the age of the model tracks. The model predicts a relatively small change in [Mg/Fe] ratio with increasing |$M_{\rm GC}/M_{\ast }$| ratio.
An additional line is shown in Fig. 2 which represents a constant GC-like stellar population. If the initial stars of a UDG formed from the same metal-poor gas at early times as the GCs and is immediately quenched (i.e. no ongoing SF) then one would expect GC-like stellar populations. Further contributions from GC mass loss and/or disrupted GCs would then not change the integrated stellar population. Thus, this situation represents a limit to the expected stellar populations. The UDG metallicity and age data tend to be more metal-rich (by |$\sim$|0.3 dex) and younger (by |$\sim$|1.5 Gyr) than the pure GC stellar population, as shown by the long dashed line in Fig. 2. If supported by additional data, this would suggest that some SF occurred after the main epoch of GC formation even for failed galaxies.
More data are needed at |$M_{\rm GC}/M_{\ast }$| high ratios to test the model trends with increasing |$M_{\rm GC}/M_{\ast }$| ratio. More data at very low ratios would allow for a better ‘zero point’ for the stellar populations of puffy dwarfs. More observational data might help to determine whether a ratio of 2.5 per cent, as advocated by Peng & Lim (2016), represents a real division between puffy dwarfs and failed galaxies. Although we note that our simple model is continuous and does not predict a clear distinction. Another interesting approach is to compare the mean colours of GCs with that of the galaxy stars as done recently by Janssens et al. (2024) for a sample of Perseus UDGs.
Within the limitations and assumptions of our simple model, we suggest that GC-rich UDGs with high |$M_{\rm GC}/M_{\ast }$| ratios (failed galaxies) are likely the result of very high GC formation efficiencies with modest rates of GC destruction. Additional data are needed to further test and refine the simple model.
7 POSSIBLE EXAMPLES OF FAILED GALAXIES
Perhaps the best candidate for a failed galaxy is NGC5846_UDG1. It has a rich GC system of 54|$\pm$|9 GCs (|$M_{\rm GC}/M_{\ast }$| = 9.8 per cent), which according to the GC number–halo mass relation (Burkert & Forbes 2020), implies a large |$M_{\rm halo}/M_{\ast }$| ratio placing it off the standard stellar mass–halo relation. Its GC system extent is comparable to that of the host galaxy, i.e. R|$_{\rm GC}$|/R|$_\mathrm{ e}$| = 0.8|$\pm$|0.2 (Danieli et al. 2022). Using MUSE on the VLT, Müller et al. (2020) found consistent (old) ages and (low) metallicities for the GCs and stars. This suggests that the stars of the galaxy and those in the GCs formed at a similar time from the same enriched gas. This would be as expected if the stars of disrupted GCs now contribute significantly to the stellar field star population. Müller et al. (2020) did not measure [Mg/Fe] ratios but Ferré-Mateu et al. (2023) found super-solar [Mg/Fe] for the stars, which is again consistent with those of metal-poor GCs. It is a nearly round galaxy (b/a = 0.9) with no evidence of rotation (Forbes et al. 2021). All of these properties match those expected of a failed galaxy, as listed in Section 2.1.
As well as VCC 615 and NGVSUDG-19 mentioned above, Ferré-Mateu et al. (2023) have noted four UDGs with low stellar metallicities for their stellar mass and hence potential failed galaxy candidates. They are: DGSAT I (field), DF44 (Coma), Yagi358 (Coma), and PUDG-R84 (Perseus). They also all have old ages. Their |$M_{\rm GC}/M_{\ast }$| ratios are: 0.6 per cent, 4.9 per cent, 4.1 per cent, and 3.9 per cent (see Table 1). DGSAT I reveals an extremely high [Mg/Fe] ratio and a very high dynamical to stellar mass ratio (Martín-Navarro et al. 2019). In the case of DF44, a total halo mass measurement is available from its radial kinematics (van Dokkum et al. 2019) which indicates an overly massive halo (large |$M_{\rm halo}/\mathrm{M}_{\odot }$| ratio). These galaxies are potential candidates for failed galaxies and warrant further study.
There may also be some parallels between failed galaxy UDGs and much lower stellar mass dwarfs. For example, the Local Group dwarf Eridanus II has an |$M_{\rm GC}/M_{\ast }$| ratio of |$\sim$|4 per cent today from its only GC. Weisz, Savino & Dolphin (2023) suggest that at birth this single GC, before mass loss, represented |$\sim$|10 per cent of the galaxy stellar mass. The presence of other GCs would make this mass fraction at formation even higher, and contribute to the field star population when disrupted. They found that the field stars of Eridanus II have old ages (13.5|$\pm$|0.3 Gyr) and very low metallicity ([Fe/H] |$\sim$| –2.6|$\pm$|0.15). They also found the GC to have the same age and metallicity within uncertainties. After initial SF at an early epoch, the galaxy was effectively quenched. Forbes et al. (2018b) derived a high halo mass to stellar mass ratio for Eridanus II, similar to those inferred for UDG failed galaxy candidates.
8 SUMMARY AND CONCLUSIONS
Observations of UDGs reveal that some of them have many more GCs per unit starlight than classical dwarf galaxies of the same stellar mass. These high |$M_{\rm GC}/M_{\ast }$| UDGs have been dubbed failed galaxies, whose key property is an inferred overly massive halo for their stellar mass (i.e. high |$M_{\rm halo}/\mathrm{M}_{\odot }$| ratio).
Simulations indicate that it is high gas densities and/or gas accretion rates that lead to higher fractions of mass in bound star clusters relative to field stars. Such conditions are common at early epochs. From observations, it is difficult to infer the natal gas pressure in an infant galaxy or to track its accretion rate, but recent observations with JWST of high redshift lensed galaxies have revealed very high ratios (40–70 per cent) of the mass in bound, high-density star clusters relative to that of the stellar mass of the host galaxy. These appear to be GCs forming up to 13.5 Gyr ago in, and around, a host galaxy with a high |$M_{\rm GC}/M_{\ast }$| ratio.
To understand GC destruction over cosmic time we must rely on simulations. The recent work of Moreno-Hilario et al. (2024) modelled GC mass loss and tidal disruption in dwarf galaxies. They found lower GC destruction (higher survival fractions at the present day) in lower mass dwarfs and for dwarfs of lower surface density. This may help explain why UDGs, of low surface density, have higher |$M_{\rm GC}/M_{\ast }$| ratios today than classical (higher surface density) dwarfs.
Using these constraints on GC formation efficiency and destruction fractions we have created a simple model to help understand the stellar populations from GC-poor puffy dwarfs and GC-rich failed galaxies. Our simple GC formation/destruction model has different expectations for the stellar populations of the host galaxy, assuming that disrupted GCs contribute to the field stars of the galaxy and there is no ongoing SF in the galaxy (i.e. it quenched early). We found that failed galaxy UDGs, with high |$M_{\rm GC}/M_{\ast }$| ratios, are likely the result of very high GC formation efficiencies combined with modest rates of GC destruction. Ultimately, full hydrodynamical simulations of UDGs in a cosmological context are required that incorporate high rates of GC formation, early quenching of SF and GC destruction over cosmic time. Meanwhile, our simple model can be refined and tested as more UDG stellar population data becomes available.
ACKNOWLEDGEMENTS
We wish to thank the anonymous referee for their comments that allowed us to improve the paper. We thank other members of the AGATE team for their help and useful discussions: W. Couch, L. Haacke, J. Pfeffer. We thank R. Remus, L. Kimmig, J. Read for helpful discussions. DF and JB thank the Australian Research Council for support via DP220101863 and DP200102574. AFM has received support from RYC2021-031099-I and PID2021-123313NA-I00 of MICIN/AEI/10.13039/501100011033/FEDER, UE, NextGenerationEU/PRT. MLMC acknowledges support from Science and Technology Facilities Council grants ST/Y002857/1 and ST/Y002865/1. AJR was supported by National Science Foundation grant AST-2308390.
DATA AVAILABILITY
This study made use of publicly available data in the literature. In particular, sources collected by McConnachie (2012), van Dokkum et al. (2015, 2016, 2017), Beasley et al. (2016), Martin et al. (2016); Martínez-Delgado et al. (2016), Yagi et al. (2016), Karachentsev et al. (2017), Alabi et al. (2018), van Dokkum et al. (2018), Ferré-Mateu et al. (2018), Gu et al. (2018), Lim et al. (2018), Ruiz-Lara et al. (2018), Toloba et al. (2018), Forbes et al. (2018b), Chilingarian et al. (2019), Danieli et al. (2019), van Dokkum et al. (2019), Fensch et al. (2019), Martín-Navarro et al. (2019), Torrealba et al. (2019), Collins et al. (2020), Gannon et al. (2020, 2021, 2022, 2023, 2024), Iodice et al. (2020), Lim et al. (2020), Müller et al. (2020), Forbes et al. (2021), Huang & Koposov (2021), Ji et al. (2021), Müller et al. (2021), Shen et al. (2021), Danieli et al. (2022), Janssens et al. (2022), Mihos et al. (2022), Saifollahi et al. (2022), Villaume et al. (2022); Webb et al. (2022), Ferré-Mateu et al. (2023), Iodice et al. ( 2023), Shen, van Dokkum & Danieli (2023), Toloba et al. (2023)
