


ABSTRACT
PSR B1259|$-$|63is a gamma-ray binary system with a 48 ms radio pulsar orbiting around an O9.5Ve star, LS 2883, in a highly eccentric |${\sim} 3.4$| yr long orbit. Close to the periastron the system is detected from radio up to the TeV energies due to the interaction of the stellar wind from LS 2883 and the pulsar’s relativistic outflow. Observations of the last four periastron passages, taken in 2010–2021, demonstrate periastron-to-periastron variability at all wavelengths, probably linked to the state of the Be star’s decretion disc. In this paper, we present the results of our optical, radio and X-ray observational campaigns on PSR B1259|$-$|63 performed in 2024 accompanied with the analysis of the publicly available GeV Fermi/LAT data. We show that this periastron passage was characterized by the early flaring of X-rays before the periastron passage and GeV emission after the periastron passage, which can be explained by a larger size of the decretion disc as supported by the optical observations. The structure of the GeV flare is also in agreement with the disruption of the large dense disc. The possible X-ray/radio correlation was observed only during the post-periastron rise of X-ray and radio emission.
1 INTRODUCTION
First discovered during the Parkes high-frequency radio survey in 1990 (Johnston et al. 1992), PSR B1259|$-$|63 is a classical gamma-ray loud binary. In this system a young 48 ms radio pulsar is orbiting around an O9.5Ve massive star, LS 2883, in a highly eccentric (|$e = 0.87$|) 3.4 yr long orbit (Negueruela et al. 2011; Shannon, Johnston & Manchester 2014; Miller-Jones et al. 2018). The decretion disc of LS 2883 is inclined to the orbital plane by about 35|$^\circ$| (Shannon et al. 2014) and the pulsed radio emission is eclipsed by the disc around periastron. Unpulsed radio emission appears at about the time the pulsar approaches the disc for the first time, showing two maxima (peaks) during the first and second disc crossing, which greatly exceed the flux level of the pulsed emission. The position of these radio peaks roughly coincides with the peaks in the X-ray light curve (see e.g. Chernyakova et al. 2021).
The observed radio to TeV emission from this system is generally believed to be the result of the interaction of the relativistic electrons of the pulsar wind with the LS 2883 radiation and wind outflow. The radio and X-ray emission is usually assumed to be a result of synchrotron emission (Tavani & Arons 1997; Connors et al. 2002; Chernyakova et al. 2020), though note that the emission region(s) and electron population(s) are still under debate. The TeV emission is due to the Inverse Compton (IC) scattering of the soft photons on the relativistic electrons of the pulsar wind (Kirk, Ball & Skjæraasen 1999; Chernyakova et al. 2020). The origin of the GeV emission from this system is still under debate. The observed variability of the GeV emission on timescales as short as 15 minutes (Johnson et al. 2018) and the lack of correlation with any other energy band excludes one-zone models (e.g. Tam et al. 2011; Kong, Cheng & Huang 2012) and makes it difficult to attribute the observed GeV emission to either synchrotron or IC emission (e.g. Khangulyan et al. 2012; Dubus & Cerutti 2013; Tam et al. 2015; Chen et al. 2019). Optical observations show an increase in the equivalent width (EW) of the H |$\alpha$| emission line around periastron, and a subsequent decrease starting around 30 days after periastron, which is linked to changes in the structure of the circumstellar disc (van Soelen et al. 2016; Chernyakova et al. 2017, 2021, 2024). A possible solution to the origin of the GeV flare was proposed by Chernyakova et al. (2020). In this paper it was shown that a combination of IC emission with the bremsstrahlung emission of the relativistic electrons drifting along the shock and interacting with the clumps produced due to the disruption of the disc can explain both the observed luminosity and the structure of the flare.
Observations of PSR B1259|$-$|63 before the 2021 periastron allowed us to propose a relation between the GeV flare and the disruption of the disc, suggested by the decrease of the EW of the H |$\alpha$| emission line (Chernyakova et al. 2020). Observations of PSR B1259|$-$|63 during its 2021 periastron passage, however, have clearly demonstrated that the evolution of the disc is not directly linked to the start of the GeV flare, as the evolution of the H|$\alpha$| EW in 2014 and 2021 was very similar, while the start of GeV flare in 2021 was very delayed and began only |$\sim$|60 d after periastron (Chernyakova et al. 2021). Observations of the 2021 periastron passage also demonstrated other new features, like the correlation of the radio/X-ray emission during the second X-ray peak (and the subsequent disappearance of this correlation afterwards), the sudden appearance of the third X-ray peak (Chernyakova et al. 2021, 2024), and evidence for X-ray/TeV correlation (H. E. S. S. Collaboration2024).
The 2024 periastron passage of PSR B1259|$-$|63 occurred on June 30, |$t_\mathrm{ p}=$| MJD 60491.592 (Shannon et al. 2014). In order to better understand the physical processes in this interesting system, we undertook an intensive radio, optical and X-ray monitoring campaign before, during, and after the 2024 periastron. In this paper, we report on the initial results of this campaign. In Section 2, we describe the details of radio, optical, X-ray and GeV data analysis. The results of the observations are presented and discussed in Section 3.
2 DATA ANALYSIS
2.1 Radio data
For the 2024 periastron, PSR B1259|$-$|63 was observed in the radio band with ATCA, under project code C3582. This observing campaign began approximately 20 d before periastron (2024 June 11), finishing 79 d after the periastron (2024 Sep 17). Data was recorded at two central frequencies, centred at 5.5 GHz and 9 GHz, with 2 GHz of bandwidth at each frequency (Wilson et al. 2011).
The campaign consisted of 31 observations in total. Observations typically lasted for an average of |$\sim$|4-h. During each observation, two calibrators were also observed (in addition to PSR B1259|$-$|63). Bandpass and flux density calibration was carried out with either PKS B1934|$-$|638 or PKS B0823|$-$|500, depending on source visibility, where PKS B1934|$-$|638 was the preferred calibrator. We also used the nearby unresolved bright radio source PKS J1322|$-$|6532 for phase calibration.
The Common Astronomy Software Applications (casa), version 6.6.3.22 (CASA Team et al. 2022) was used to analyse the data. When starting the analysis, the data had to be flagged by removing radio frequency interference and systematic issues. The data were then calibrated following standard procedures in casa.1 Imaging was carried out using tclean within casa. The calibrated integrated flux value was found by fitting a 2D Gaussian to the point source in the image with the imfit function, fixing the Gaussian full width at half-maximum values to those of the synthesized beam.
2.2 Optical data
Optical coverage of the 2024 periastron passage of PSR B1259|$-$|63 was carried out with the Robert Stobie Spectrograph (Burgh et al. 2003) on the Southern African Large Telescope (SALT; Buckley, Swart & Meiring 2006). Observations were obtained from |$\approx$|60 d before (2024 May 1) until |${\approx} 36$| d after periastron (2024 Aug 5) in order to trace the behaviour of the H |$\alpha$| emission line (produced by the circumstellar disc) as the pulsar passed through periastron. All observations were taken with the PG2300 grating, with the 0.6|$^{\prime \prime }$| long slit (achieving a resolving power of |$R\approx$|11 000), and consisted of 15|$\times$|30 s exposures. The data reduction and spectral extraction followed the same procedure as discussed in Chernyakova et al. (2021, 2024). All the data was first pre-reduced by the SALT pipeline, and then flat correction, wavelength calibration and spectral extraction was performed, and each night’s observations were averaged together, continuum corrected with a low-order polynomial, and barycentric corrected, using a python script relying on numpy, scipy, astropy, and pyraf. The EW of the H |$\alpha$| emission line was then measured by numerically integrating over the wavelength range |$\lambda = 6528{\!-\!}6607$| Å, and the uncertainty was estimated following Vollmann & Eversberg (2006), with the signal-to-noise ratio estimated as in Stoehr et al. (2008). The variation in H |$\alpha$| EW for the 2014–2024 periastra is shown in Fig. 1.
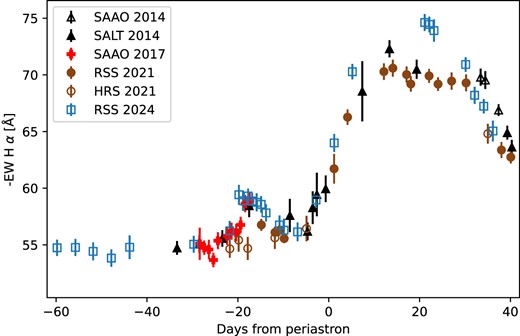
EW of the H |$\alpha$| emission line around the 2024 periastron passage of PSR B1259|$-$|63, compared to the previous periastra.
2.3 X-ray Data
2.3.1 Swift
The 2024 periastron passage of PSR B1259|$-$|63 was closely monitored by the Neil Gherels Swift Observatory (Swift; Gehrels et al. 2004). We have analysed all available data taken from June 1 to September 9, 2024. The data was reprocessed and analysed as suggested by the Swift/XRT team2 with the xrtpipeline v.0.13.7 and heasoft v.6.34 software package. The spectral analysis of Swift/XRT spectra was performed with XSPEC v.12.14.1. The spectrum was extracted from a circle of radius |$36^{\prime \prime }$| around the position of PSR B1259|$-$|63, and the background estimated from a co-centred annulus with inner/outer radii of |$60^{\prime \prime }/300^{\prime \prime }$|. We performed the fit of the spectrum, grouped to have at least 1 photon per energy bin, using ‘cstat’ statistic (Cash 1979; Wachter, Leach & Kellogg 1979) by an absorbed power-law model (cflux*tbabs*po) in 0.3–10 keV range. The flux of the source, hydrogen column density and the slope of the power law were treated as free parameters during the fit. The uncertainties of the Swift/XRT fluxes shown in Fig. 2 are |$1\sigma$| confidence intervals.
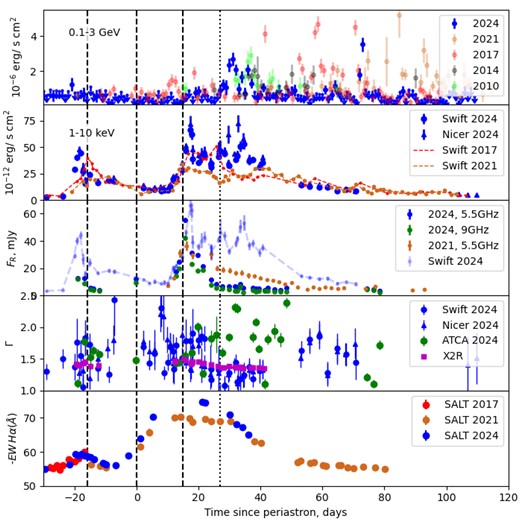
The PSR B1259|$-$|63 light curves from radio to GeV energies. The vertical dashed lines correspond to periastron and to the moments of the disappearance (first non-detection, |$t=t_\mathrm{ p}-16$|) and the reappearance (first detection, |$t=t_\mathrm{ p}+15$|) of the pulsed emission, as observed in 2010 (Abdo et al. 2011). The dotted line corresponds to the first appearance of the detection in GeV band on a day time-scale at the beginning of the 2024 GeV flare. All historical data in this figure are taken from (Chernyakova et al. 2021, 2024, and references therein). Panel a: Fermi/LAT flux measurements in the E> 100 MeV energy range with a daily bin size. Panel b: absorbed 1–10 keV X-ray flux. Panel c: radio flux densities in mJy. Scaled 2024 X-ray Swift data is also shown in this panel with a dashed line for comparison. Panel d: evolution of the X-ray (Swift, Nicer) and radio (ATCA,|$1- \alpha$|) photon indexes around periastron. With squares (X2R), we show the photon indexes that would explain the overall radio to X-ray spectrum (using data points separated by no more than 1.5 d). Panel e: H |$\alpha$| EW.
2.3.2 NICER
NICER is an externally attached payload on the International Space Station, delivered in 2017 (Gendreau et al. 2016). The primary instrument of NICER is the X-ray Timing Instrument (XTI). It consists of 56 pairs of X-ray concentrators (XRC) and silicon drift detectors (SDD). Each SDD detects individual incoming photons collected by the XRC. NICER/XTI operates in the energy range of |$0.2{\!-\!}12$| keV, with a sufficiently large effective area of 1700 cm|$^{2}$| at 1 keV, high sensitivity, and an unprecedented precision in photon arrival time measurements – less than 300 ns. However, the design of NICER does not allow it to produce images, meaning that the photons are registered from a region of the sky that spans several arcmin.
We used data from the monitoring campaign of PSR B1259|$-$|63, where spectral extraction was possible and the spectrum was not dominated by the background noise, consisting of 27 observations covering MJD 60472–60539 (ObsIDs 5203610101–6, 8–15, 17–21, 27, 31–32, 35–36). NICER data were reduced using the nicerdas software and CALDB version 20 240 206 according to the official data analysis threads.3 The data were processed using the nicerl2 task, then the cleaned event files were used to generate spectral products using the nicerl3-spect task, incorporating the SCORPEON background model. For each observation an ‘orbit-night’ spectrum was extracted using standard threshold settings. If a ‘night’ spectrum had zero effective exposure, a ‘day’ spectrum was extracted instead. NICER spectra were fitted using a simple absorbed power-law. In accordance with the official SCORPEON analysis manual, noise_norm, lhb_em and gal_nh parameters of SCORPEON model were frozen.4 The PSR B1259|$-$|63 spectra were approximated using simple absorbed power law using ‘cstat’ statistic.
2.4 GeV data
We performed an analysis of Fermi/LAT data with Fermitools (v. 2.2.0 released 21 June 2022) using the latest Pass 8 reprocessed data (P8R3) from the SOURCE event class. The binned likelihood analysis was performed for photons within the energy range 0.1–300 GeV that arrived between MJD 60 401 and 60 601 (|$-90$| to |$+110$| d around the periastron) within a |$20^\circ$|-radius region around PSR B1259|$-$|63’s position. The selected maximum zenith angle was |$90^\circ$|. The performed analysis relies on the fitting of the spectral and spatial model of the region to the observed data in a series of energy and time bins.
The adapted model of the region included templates for the Galactic and isotropic diffuse emission components provided by the Fermi/LAT collaboration, as well as all sources from the latest Fermi/LAT 4FGL-DR4 catalogue (Abdollahi et al. 2020), with the spectral templates selected according to the catalogue. At the initial stage of the analysis we assumed all spectral parameters of sources within |$15^\circ$| around PSR B1259|$-$|63 to be free parameters and fixed all spectral parameters of sources between |$15^\circ$| and |$20^\circ$| to their catalogue values. We performed the fitting of the described model to all the available data. For the subsequent analysis, we fixed all (except normalizations) free spectral parameters to their best-fitting values, and removed all of the weak sources detected with test-statistics |$\mathrm{ TS}\lt 1$| from the model.
For the next step of the analysis, we split the 0.1–3 GeV data over a series of 1-day and 1-week bins aiming to produce the light curve of PSR B1259|$-$|63 in the corresponding energy band (see Fig. 3, left panel). All upper limits presented were calculated using the IntegralUpperLimits module included in Fermitools for |$\mathrm{ TS}\lt 4$| cases and correspond to a 95 per cent confidence level. Aiming to study short time-scale variability of the system we also considered time bins of a variable duration. To achieve this, we defined time bin durations to accumulate 9 photons in the energy interval 0.1–3 GeV in a |$1^\circ$|-radius region around PSR B1259|$-$|63, similar to the approach used in Chernyakova et al. (2021) to detect short time-scale variability during the 2021 periastron passage. Alternatively, we considered ‘Bayesian blocks’ time binning,5 i.e. time bins during which the count rate within 0.1–3 GeV in a |$1^\circ$|-radius region around PSR B1259|$-$|63 position is approximately constant. We note a good overall agreement between the adapted approaches (see corresponding light curves in Fig. 3, right panel).
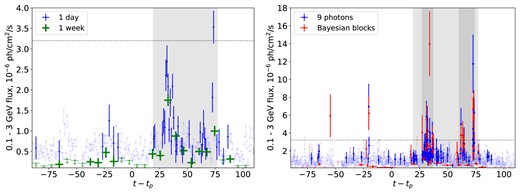
Fermi/LAT light curve of PSR B1259|$-$|63 in the 0.1–3 GeV energy band. The left panel shows daily and weekly time bins. The right panel presents time-variable bins – bins accumulating 9 photons in |$1^\circ$|-radius region around PSR B1259|$-$|63 and bins of a constant count-rate in |$1^\circ$|-radius circle (‘Bayesian blocks’ Scargle et al. 2013); see text for details. The horizontal dotted line illustrates the spin-down luminosity flux for PSR B1259|$-$|63. The light shaded region shows the period |$+19-+77$| d used to derive the spectrum of Fermi/LAT flare, see Fig. 4. Dark-shaded regions on the right panel additionally show the period of enhanced short time-scale variability (|$+27$| to |$+37$| d and |$+60$| to |$+74$| d).
The obtained light curves suggest the enhancement of the GeV emission during +19 to +77 d (MJD 60510–60568) after periastron. Below we refer to this period as the ‘Fermi/LAT flare’ during the 2024 periastron passage. To study the potential spectral-shape variability of the source during different periods of the periastron passage we built the spectrum of PSR B1259|$-$|63 for the periods |$(-20;0)$|, |$(0; +20)$| d around periastron, as well as during the Fermi/LAT flare period. These periods were selected to be similar to those used by Chernyakova et al. (2021) which allows us to make a direct comparison between the current and 2021 periastron passages. The spectra of the 2024 and 2021 periastron passages are shown in Fig. 4.
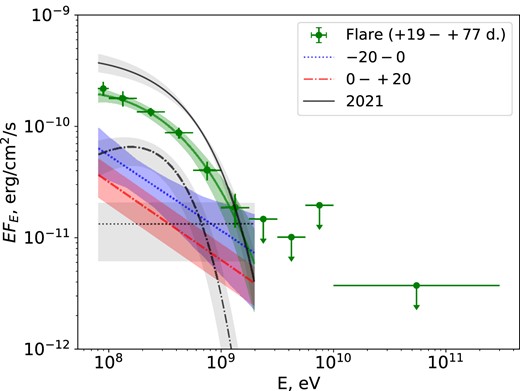
Best fits of Fermi/LAT spectra of PSR B1259|$-$|63 before (|$-20$| to 0 d, dotted line) and after (0 to |$+20$| d, dot-dashed line) the 2024 periastron passage with a power-law model. The solid line illustrates the best fit of the spectrum during the period of the flare (|$+19 \ \mathrm{ to}\ +77$| d). Data points show the Fermi/LAT spectrum during this period. Same line style black lines show the results from 2021 periastron passage (adapted from Chernyakova et al. 2021). Shaded regions correspond to |$1\sigma$| uncertainty regions around the best-fitting models.
We found that PSR B1259|$-$|63 is detected during all considered time periods with a test-statistic (TS) of |$\mathrm{ TS}\sim 17$| for |$(-20;0)$| d; |$\mathrm{ TS}\sim 6.5$| for |$(0; +20)$| d, and |$\mathrm{ TS}\sim 690$| for the period of the flare (|$+19\ \mathrm{ to} \ +77$| d). Due to a low detection significance of the source during |$(0; +20)$| d and |$(-20;0)$| d periods we fit the spectra during these periods with a power-law (PL) model, additionally fixing the power-law index for the |$(0; +20)$| d period to 2.7. For the flaring period the spectrum of PSR B1259|$-$|63 is significantly curved and can be described with a superexponential cutoff-power law (ECSPL) model. The best-fitting spectral parameters in the |$0.08{\!-\!}2$| GeV band are summarized in Table 1.
The best-fitting model parameters for Fermi/LAT observations of PSR B1259|$-$|63 for different periods around the 2024 periastron. The model column indicates the model used to fit the spectrum. The ECSPL model is defined as |$\mathrm{ d}N/\mathrm{ d}E = N_0 (E/\mbox{1 GeV})^\Gamma \exp (E/E_\mathrm{ c})^\beta$|. The power-law (PL) model corresponds to a ECSPL model with |$E_\mathrm{ c}=\infty$|. The TS column summarizes the test-statistics of the detection of PSR B1259|$-$|63 during the corresponding period. The parameters denoted by |$^\dagger$| were kept fixed during the fit due to a low detection significance of the source during this period.
| Period | Model | Norm |$N_0$| | Index, |$\Gamma$| | Cutoff, |$E_c$| | |$\beta$| | TS |
|---|---|---|---|---|---|---|
| days | |$10^{-9}$| ph/cm|$^2$|/s | MeV | ||||
| |$-$|20 to 0 | PL | |$(0.7\pm 0.4)\cdot 10^{-2}$| | |$2.7\pm 0.3$| | – | – | 17 |
| 0 to +20 | PL | |$(0.4\pm 0.2)\cdot 10^{-2}$| | |$2.7^\dagger$| | – | – | 6.5 |
| +19 to +77 | ECSPL | |$1.75\pm 0.7$| | |$1.5\pm 0.2$| | |$42\pm 8$| | |$0.49\pm 0.04$| | 690 |
3 RESULTS AND DISCUSSION
The 2024 periastron passage of PSR B1259|$-$|63 demonstrated a peculiar behaviour of the system from radio to GeV energies. The H|$\alpha$| EW (Figs 1 & 2) showed a general behaviour which was similar to previous periastra: the EW was fairly constant before the time of the first disc crossing; it increased and showed a local maximum around the first disc crossing before decreasing; the EW then increased and peaked after periastron, before decreasing again. However, there are notable differences this time. First, the increase around the first disc crossing was noticeably larger than it was in 2021, and second the first maximum in 2024 appears to be |${\sim} 1$| d earlier than in 2017. Unfortunately, the gaps in the data do not allow us to place a tighter constraint on this. Finally, the peak of EW after periastron is significantly larger than was ever observed before.
This difference in the EW would be inline with the pulsar interacting earlier with the circumstellar disc, either because of a larger disc, or due to a small shift in the disc orientation. The presence of the large disc up to |$t_\mathrm{ p}+29$| is also indicated by infrared observations (Fujita et al. 2024).
Such an assumption is further supported by the X-ray observations, see Fig. 2. The bright and narrow first X-ray maximum was observed at |$\sim -18$| d, i.e. a few days earlier than ever observed before. The second X-ray peak is characterized by a sharp rise at |${\sim} +15$| d, in line with previous observations, followed by a period of highly variable enhanced emission until at least |$+40$| d. Such a behaviour can be understood if, during the second passage, the pulsar perturbed the disc and/or dragged a large amount of the decretion disc’s material along with it. In this case the apex of the pulsar-stellar wind interaction cone could have remained relatively close to the pulsar for a longer time, i.e. in a higher magnetic field region resulting in enhanced X-ray emission. The strong quasi-random X-ray variability at |$+20$| to |$+40$| days can be connected to large-scale density variations in the perturbed disc which push the tip of the emission cone closer to/further from the pulsar.
Unfortunately our ATCA data does not cover the rise in X-ray emission during the first X-ray peak which, therefore, does not not allow us to study the radio/X-ray correlation during this period. We started our observations just before the first X-ray maximum, and the radio demonstrated a smooth decay until 11 d before periastron. The rapid radio increase after periastron (at |$\approx +14$| d) occurred with the rise of the X-ray emission, and closely matched the data from previous periastron passages. This time, however the X-ray/radio correlation disappeared right after the beginning of the X-ray flux decay |$\sim 20$| d after the periastron, contrary to the behaviour observed during the 2021 periastron passage, where the correlation was seen until |$\sim 30$| d after periastron.
The absence of a correlation can be connected to different populations of electrons producing radio and X-ray emission as suggested by Chernyakova et al. (2021). X-ray light curve allows two interpretations of the late-phases of the second X-ray peak: (i): a broad 2nd peak with occasional initial radio/X-ray coupling; (ii): the presence of the 3rd X-ray peak, similar to one observed in 2021 (Chernyakova et al. 2020), but appearing much earlier at |$\sim +20$| d.
The radio flux density in 2024 reached a historical maximum |$\approx$|16 d after periastron (see e.g. compilations of historical radio data in Chernyakova et al. 2021, and references therein). This maximum was followed by a rapid decay during which the radio emission dropped to a level comparable with the level of the pulsed emission at |$\sim 30$| d after the periastron, much earlier than previously observed. The indexes of the radio emission are presented in the fourth panel of Fig. 2 (green circles) along with the X-ray indexes (blue points) and the slope between the radio to X-ray (magenta squares). In 2024, the indexes of the radio data were much more chaotic than in 2021, where they were systematically softer than the X-ray ones.
The GeV-band emission demonstrated a sharp rise from |$\sim +27$| d, which peaked at |$\sim +30$| d, at a time comparable to the 2010 periastron and substantially earlier than observed for the 2021 periastron. Such an early rise of the GeV emission contradicts the precession disc model proposed by Chang et al. (2021) After a gradual decay of the emission a second rise was observed at |$\sim 60$| to |$+74$| d. A number of short down to 6 min duration) flares with energetics exceeding the spin-down luminosity up to a factor of |$\sim 5$| were observed during both periods of high GeV flux, see Fig. 3.
The interaction of the pulsar wind with the outflow of LS2883 led to the formation of a shock cone directed away from the massive star, with the axis lying along the line connecting the pulsar and LS 2883 (see fig. 5 in Chernyakova et al. 2017). In the model of Chernyakova et al. (2017) the GeV emission is explained as emission of the relativistic pulsar wind electrons flowing along the shock with a moderate Lorentz factor |$\gamma \sim 3$|. Similar to the hollow cone model described in Neronov & Chernyakova (2008) the GeV Fermi/LAT flare occurs when the pulsar wind/decretion disc interaction cone is oriented towards the observer. The short |$\sim 15$| min-long sub-flares with energetics significantly exceeding the spin-down luminosity are explained as bremsstrahlung radiation that occurs due to the entrance of the clumps of the decretion disc into the interaction cone.
In 2024, the Fermi/LAT flare occurred close to the end of the second X-ray peak, during the period of quasi-random X-ray variability. As discussed above, during this period the regular structure of the decretion disc was strongly perturbed by the pulsar. Still, the density of the material was sufficiently high to form a relatively thin emission cone and the rise of the GeV emission at |$+20$| to |$+37$| d.
The second rise of the GeV emission (|$+60$| to |$+74$| d) can be connected to the eventual disruption of the disc and the production of a large number of clumps which reach the interaction cone. This hypothesis is further supported by a larger number of short sub-flares seen during the second rise of the GeV emission, comparable to the first one (see Fig. 3). The Bayesian-blocks time binning light curve indicates the presence of 5 sub-flares with the mean flux exceeding the spin-down luminosity for the period |$+27$| to |$+37$| d and 7 sub-flares for the period |$+60$| to |$+74$| d. Such a behaviour can be indicative of a larger number of clumps reaching the interaction cone when the pulsar was significantly far from periastron.
Interestingly, the Bayesian analysis revealed the presence of short time-scale variability well before periastron at |$\sim -54$| and |$\sim -20$| d, with fluxes comparable to the spin-down luminosity. While the Fermi/LAT sensitivity does not allow us to firmly conclude on the exact flux level of these flaring events we note that pre-periastron flares with spin-down-exceeding luminosity are hard to interpret within the discussed model. We also note that pre-periastron flares with a similar luminosity were not observed during the 2010–2021 periastron passages.
The spectral behaviour of the system in the GeV band differs from the one observed during the 2017–2021 periastron passages. Contrary to previous periastra, in 2024, PSR B1259|$-$|63 is detected with a higher significance before periastron (|$-20$| to 0 d, |$\mathrm{ TS}\sim 17$|) and a lower significance after periastron (0 to |$+20$| d, |$\mathrm{ TS}\sim 6.5$|). The low significance of the detection during these time periods did not allow us to detect a spectral curvature contrary to previous passages. The flaring-period-averaged flux (|$+19$| to |$+77$| d) is also somewhat lower than the one seen in 2017 (see Fig. 4 and Table 1).
While detailed modelling of the PSR B1259|$-$|63 emission around 2024 periastron passage is beyond the scope of this work, we argue, that the observed changes in the GeV band spectrum can be connected to a difference in the particles’ acceleration efficiency in the presence of a denser/larger disc and/or by modified escape and cooling times.
ACKNOWLEDGEMENTS
The authors acknowledge support by the state of Baden-Württemberg through bwHPC. This work made use of data supplied by the UK Swift Science Data Centre at the University of Leicester. The Australia Telescope Compact Array (ATCA) is part of the Australia Telescope National Facility (https://ror.org/05qajvd42) which is funded by the Australian Government for operation as a National Facility managed by CSIRO. We acknowledge the Gomeroi people as the Traditional Owners of the ATCA observatory site. We thank Rajan Chhetri and Jamie Stevens for their assistance during the ATCA observations. Some of the observations reported in this paper were obtained with the South Africa Large Telescope (SALT) under program 2024-1-SCI-040 (PI: B. van Soelen). The authors thank the European Space Agency for the support in the framework of the PRODEX Programme, PEA 4000120711. The authors wish to acknowledge financial support from the Centre for Astrophysics and Relativity at Dublin City University.
DATA AVAILABILITY
The data underlying this article will be shared on reasonable request to the corresponding authors.
Footnotes
See Swift/XRT data analysis guide
Using astropy implementation of Scargle et al. (2013) algorithm with a false-alarm prior probability |$p_0=0.05$|.
