


ABSTRACT
Solar eruptions are sudden release of the magnetic free energy accumulated within a quasi-static evolutionary process of the corona. Interestingly, many solar eruptions are preceded by a short-term slow-rise phase, during which the pre-eruption structure rises at a speed significantly larger than that of the quasi-static evolution. Here we suggest an explanation for the slow-rise phase based on a recent high-accuracy magnetohydrodynamic simulation for initiation of solar eruption. The simulation shows that by continuously shearing a bipolar magnetic arcade, an internal current sheet forms gradually, and an eruption begins once magnetic reconnection is triggered at the current sheet. We find in the simulation that the overlying field presents a slow-rise phase before the reconnection sets in. In addition, the rising speed is significantly larger than that of the core field during this phase. This slow rise is a manifestation of the growing expansion of the arcade in the process of approaching a fully open field state, which is inherent to the formation of a current sheet before the eruption. We also show three flare events with slow-rise phases that are highly consistent with these key characteristics in the simulation: an expansion of the overlying coronal loops with speeds much larger than the quasi-static evolution speed, and for those events with filament eruption, the slow rise of filament is much smaller than that of the overlying loops. In this type of events, the eruption might be initiated through the mechanism as shown in the simulation, and the expansion of overlying coronal loops is a better indicator of the slow-rise phase.
1 INTRODUCTION
It is well known that solar eruptions like flares and coronal mass ejections (CMEs) can cause severe space weather events. Solar eruptions originate from violently release of the magnetic energy stored in the solar atmosphere, particularly in the active regions (ARs), where the magnetic field is concentrated. Therefore, the evolution of the magnetic field plays a key role in driving solar eruptions (Forbes et al. 2006; Chen 2011; Cheng, Guo & Ding 2017). The evolution of ARs is often associated with shearing, rotation, and converging motions of the magnetic field at their footpoints on the photosphere (Evershed. 1910; Brown et al. 2003; Yan, Qu & Kong 2008; Jiang et al. 2011). These motions can efficiently transport free magnetic energy into corona, and when the free energy is stored sufficiently, it will unavoidably lead to eruptions (Barnes & Sturrock 1972; Jiang et al. 2021; Bian et al. 2022).
The entire evolution of a typical solar eruption, in which a flare is accompanied with a CME, can be divided into three phases in soft X-ray (SXR) profile of the flare: a pre-flare phase, a rise phase (or impulsive phase) and a decay phase (Priest 1976). Correspondingly, the kinematic evolution of the accompanied CME can be divided into three phases based on its morphological movement process: a gradual pre-eruptive stage, an impulsive main-acceleration/eruption phase in the inner corona and a propagation phase with an almost constant speed in the solar wind (Zhang et al. 2001). It has been found that the different phases of the kinematic evolution of CMEs have a good one-to-one correspondence with the different phases of the flare’s SXR light curve in most events (Neupert et al. 2001; Zhang et al. 2001, 2004; Bein et al. 2012).
Attentions have been paid to the early kinematic evolution of the magnetic configurations that are to erupt imminently (Cheng et al. 2020), as this early evolution may shed important light on the initiation mechanism of the eruptions. To trace the early kinematic evolution of CMEs, there are some precursor signatures in observation, such as filament/prominence and hot channel. Filament and prominence are the same structure in different views, which is a cool and dense plasma suspended in the hot corona by the strongly sheared or twisted magnetic field (Mackay et al. 2010). It can be observed in cool extreme ultraviolet (EUV) passbands like 304 Å that a majority of CMEs are related to filament eruption (Munro et al. 1979; Webb & Hundhausen 1987). Hot channel is a manifestation of erupting magnetic structure, presumably a magnetic flux rope (MFR) that is heated by reconnection before and during the eruption, as often observed in 131 Å and 94 Å passbands (Cheng et al. 2011; Zhang, Cheng & Ding 2012). In details, through tracing the movement of precursor signatures of CME before the eruption, it is found that the pre-eruptive phase can be subdivided into a long quasi-static phase and a short slow-rise phase (Kahler et al. 1988; Joshi et al. 2017; Xing et al. 2018, 2024; Cheng et al. 2020).
The quasi-static phase refers to the process in which dynamical and inertial effects are negligible due to the significantly lower characteristic travel time of Alfvén waves in the corona as compared to that of the typical photospheric variations (Vemareddy & Wiegelmann 2014). The precursor evolves in this phase at a speed close to the evolution of the photospheric motion with magnitude at around (and often smaller than) 1 km s|$^{-1}$|. The quasi-static phase lasts for hours to days before an eruption (Hirayama 1985; Zuccarello et al. 2014; Xing et al. 2018), during which magnetic free energy is slowly accumulated in the corona. Naturally, this phase is controlled by the motion of photosphere, since at any moment within this phase, the coronal magnetic field is close to an equilibrium state as determined mainly by the photospheric field, which makes the static coronal field extrapolation from photospheric magnetograms viable (Wiegelmann & Sakurai 2021). Therefore, the mechanism of this quasi-static phase is quite clear (Kaithakkal & Solanki 2019). On the other hand, there have been many theories proposed for explaining the main-acceleration phase in which the eruptive structures rise sharply in a short period of a few tens of minutes, reaching hundreds to a few thousands of km s|$^{-1}$| (Zhang et al. 2001; Gallagher, Lawrence & Dennis 2003; Zhang & Dere 2006; Song et al. 2015). The frequently invoked mechanisms include the ideal magnetohydrodynamic (MHD) instability models (Török & Kliem 2005; Kliem & Török 2006; Aulanier et al. 2009) and magnetic reconnection models (Antiochos, DeVore & Klimchuk 1999; Moore et al. 2001; Archontis & Török 2008; Fan 2009; Syntelis, Archontis & Tsinganos 2017; Jiang et al. 2021). The slow-rise phase, which connects the quasi-static phase and the main-acceleration phase, remains comparatively more elusive regarding to the underlying mechanism. Typically, the slow-rise phase is featured by the speed of precursor signature of a few tens of km s|$^{-1}$|, which is obviously greater than the speed of quasi-static evolution, yet much smaller than that during the eruption (Vršnak 2019; Cheng et al. 2020; Xing et al. 2024).
It has been suggested that the slow rise is caused by gradual (slow) magnetic reconnection that helps to build up an MFR shortly before it runs into an instability and erupts (Sterling et al. 2007; Savcheva, Van Ballegooijen & DeLuca 2011; Cheng et al. 2020, 2023; Xing et al. 2024). In particular, Cheng et al. (2023) and Xing et al. (2024) suggested that this reconnection occurs below the growing MFR, presumably at a hyperbolic flux tube (HFT, Titov, Hornig & Démoulin 2002), which is essentially a tether-cutting-like configuration as depicted by Moore et al. (2001). The reconnection not only weakens the overlying field, but also causes the newly formed MFR to rise slowly, as driven by the upward magnetic tension from the newly-reconnected field lines (i.e. a slingshot effect). Since the magnetic reconnection at this phase is relatively slow, the energy released is not catastrophic, therefore resulting in a relatively slow rise of the MFR as compared to that during the eruption. Such an MFR-related reconnection model that combines the slingshot effect and outflow effect to explain the slow-rise phase may explain well many events associated with formation of an MFR before eruption (e.g. see an impressive example in Cheng et al. 2023). However, not all events have MFRs formed before eruption (e.g. see some statistical studies by Ouyang et al. 2017; Duan et al. 2019). Even the presence of a filament does not necessarily indicate that the underlying field is an MFR, as filament can also be supported by sheared flux with magnetic dips (DeVore & Antiochos 2000). Furthermore, the HFT magnetic reconnection process requires a special magnetic topology, which may not be available during the pre-eruption time in many events. There are also events in which no signature of reconnection is present in the slow-rise phase. Therefore, it needs to consider other mechanisms that are not based on pre-eruption MFR formation associated with slow reconnection.
In addition to the precursor signatures of filament and hot channel, which represent the core field of an eruptive configuration, the slow-rise phase is also reflected by the expansion of the overlying coronal loops in some events. Moreover, if there is no filament and hot channel, the overlying coronal loops would be the only indicator of the slow-rise phase. For example, by a careful analysis of a famous large flare that occurred on 2006 December 13, Imada, Bamba & Kusano (2014) found that the overlying coronal loops expand with a velocity of |${\sim} 10$| to 30 km s|$^{-1}$| in a few hours before the flare. Furthermore, the SXR and EUV intensities are gradually reduced in this slow-rise phase, suggesting no reconnection occurring before the flare.
In this paper, we suggest an alternative explanation for the slow-rise phase based on a recent MHD simulation of solar eruption initiation (Jiang et al. 2021). The simulation shows that when a bipolar magnetic arcade is continuously sheared, an internal current sheet forms gradually, and an eruption begins once reconnection is triggered at the current sheet. Jiang et al. (2021) argued that this scenario is a fundamental mechanism of solar eruption initiation in those events with sheared arcades rather MFRs before eruption. We find in this simulation that shortly before the eruption onset is a phase in which the expansion speed of the magnetic flux overlying the core field (that builds up the current sheet) becomes much larger than that during the quasi-static phase. Importantly, in this phase, the expansion speed of the overlying flux is also larger than that of the core field. This may explain the slow-rise phase in many events that is featured by evident faster expansion of the overlying coronal loops than the core structure like filaments and hot channels. We also show three flare events which are in line with these key characteristics of the slow-rise phase in the simulation. By tracing the evolution of different signatures before the flare onset, it is found that there is an expansion of the overlying coronal loops for all events and their speeds are larger than the quasi-static evolution speed. Moreover, for those events with filament eruption, the expanding speed of coronal loops is larger than the rising speed of filament. In the following, we first describe in Section 2 the slow-rise phase as revealed in the simulation. In Section 3, we present the observation results, which are compared with the simulation. Last conclusion and discussions are given in Section 4.
2 SLOW-RISE PHASE IN AN MHD SIMULATION
Jiang et al. (2021) performed an MHD simulation of solar eruption initiation: a bipolar field driven by slow shearing motion at the photosphere can form an internal current sheet in a quasi-static way, which is followed by fast magnetic reconnection (in the current sheet) that triggers and drives the eruption. Initially the magnetic field is a potential arcade, and to inject free energy into the coronal field, they applied rotational flows with the same direction to both two polarities at the bottom surface, mainly at the edge of the polarities, thus shearing the photospheric magnetic field along the PIL and creating a magnetic configuration with strong shear above the PIL. Such a way to shear the field along the PIL has been commonly used in many 3D simulations for energizing the coronal field before eruption (e.g. Amari et al. 2003; DeVore & Antiochos 2008; Lynch et al. 2008; Aulanier et al. 2009). It has the advantage of not modifying the photospheric magnetic field distribution, thus keeps the corresponding potential field energy unchanged, and only the free energy is increased as the field evolves driven by the flows. In simulation of Jiang et al. (2021), the flows are given with a rather small speed up to around 5 km s|$^{-1}$| and continuously applied throughout the simulation.1
This shearing process takes a time of 221 min to create the current sheet (Fig. 1a). At the moment, the total magnetic energy has increased to a value of around 0.9 times of the corresponding open field energy. After then, the magnetic reconnection sets in, marking the onset of eruption, and the kinematic energy rises impulsively by two orders of magnitude from the pre-eruptive phase to the eruption (Fig. 1b), and part of free magnetic energy is released. We note that before the eruption onset, the field is a sheared arcade without MFR, and during the eruption an MFR is formed, with its core as a product of reconnection of the low-lying, strongly-sheared field lines.
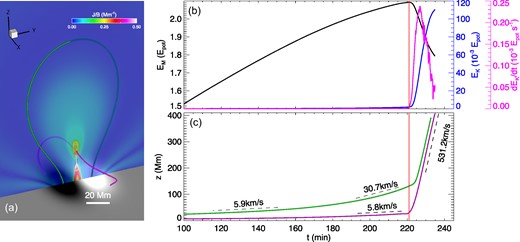
The time profiles of expansion of two typical field lines in the MHD simulation of eruption initiation by Jiang et al. (2021). (a) A snapshot of the eruption at time of |$t=221.5$| min. The bottom surface is shown by the magnetic flux distribution. The vertical slice shows the current density normalized by the magnetic field strength, thus emphasizing the current sheet and the newly formed MFR (the tear-drop shaped structure). The pink line shows the core field line that forms the MFR, while the green line shows the large-scale overlying field line. (b) Evolution of the magnetic energy (black line), the kinematic energy (blue line), and the temporal changing rate of kinematic energy (the pink line). All the energies are normalized by the initial potential field energy |$E_{\rm pot}$|. The red vertical line denotes the onset time of the eruption. (c) The time profile of the heights of the apex of the two field lines as shown in (a). The speeds at typical stages are denoted.
Here we will not repeat the details of this simulation (for which the readers are referred to Jiang et al. 2021), and only focus on the kinematic behaviour associated with the slow-rise phase before the eruption. We traced two characteristic field lines in the simulation; one is an initially low-lying field in the core of the simulated AR; the other is an overlying one representing the large-scale overlying loops. As shown in Fig. 1a, we use the purple line to represent the core field and the green line the larger overlying coronal loops. As can be seen in Fig. 1c, before the eruption onset time (i.e. |$t=221$| min, as denoted by the vertical red line), the core field line undergoes a quasi-static expansion with a small velocity of around 5 km s|$^{-1}$|, which is close to that of the surface driving flow. Thus, it seems difficult to say whether there is a slow-rise phase by observing the kinematics of the core field. However, the overlying field line, although initially also expands quasi-statically (with similar speed as that of the bottom driving), becomes much faster with a speed rising up to 30 km s|$^{-1}$| in around 30 min before the eruption onset. Therefore, this period is the slow-rise phase. The large-scale overlying field begins to be accelerated from around 160 min, an hour before the eruption of the core field, and its velocity is obviously greater than that of the core structure. This indicates that the slow rise of the overlying field is not driven by the expansion of the core field. The slow rise of the large-scale overlying loop is actually a manifestation of the growing expansion of a continuously sheared arcade in the process of asymptotically approaching a fully open field state (the Aly–Sturrock conjecture, Aly 1991; Sturrock 2005), which is inherent to the formation of a current sheet. When a magnetic arcade is sheared continuously, it first expands quasi-statically with a long time, and its energy increases continuously. In a perfect ideal MHD regime, the energy will ultimately reach its upper limit, i.e. the open field energy, in which the top of the arcade will extend outwards to infinity and a tangential discontinuity (i.e. a current sheet) will form above the neutral line at the bottom surface. To attain this open field state, the arcade must experience a sufficiently fast expansion after the quasi-static expansion. This explains why there is short period before the eruption, i.e. the slow-rise phase, during which the overlying loop expands much faster than the quasi-static evolution speed. Such a dynamic behaviour is found to be a generic property of a continuously sheared arcade (Mikic & Linker 1994) or continuously twisted flux tube (Amari et al. 1996; Török & Kliem 2003; Aulanier, Démoulin & Grappin 2005) with footpoints anchored on photosphere. We note that the slow-rise phase should not be sensitive to the type of shearing motions, provided that the motion can efficiently increase the degree of the coronal field non-potentiality, driving the field to approach the open field state in ideal MHD evolution. An important point thus needs to be emphasized is that the simulation should have very low resistivity such that the shearing-driven evolution before eruption is closely adhere to ideal MHD (see more details about this in the Method section of Jiang et al. 2021). Therefore, it is distinct from the mechanism that based on the pre-flare slow reconnection. In addition, in a recent simulation, Jiang et al. (2023) found that as long as it enters the slow-rise phase, the system will not relax back to a quasi-static process even the surface driving is turned off. That is to say, once the system enters the slow-rise phase, the system will unavoidably evolve to an eruption eventually.
Once reaching the onset time of the eruption, the core field is rapidly accelerated by the reconnection and reaches above 500 km s|$^{-1}$|. Such a strong acceleration is achieved mainly through the upward tension force of the newly reconnected field lines, as has been analysed by Jiang et al. (2021). Immediately afterwards, the overlying loops are pushed from below by the erupting core field, and therefore quickly attains the same speed of eruption.
3 SLOW-RISE PHASE IN OBSERVATIONS
We show three flare events from ARs 12524, 13110, and 12887, respectively, in which the slow-rise phase can be clearly observed and can be interpreted using our proposed mechanism. The solar dynamics observatory (SDO, Pesnell, Thompson & Chamberlin 2012) provides the various observations of the pre-eruption signatures. The atmospheric imaging assembly (AIA, Lemen et al. 2012) onboard SDO includes different EUV and UV passbands. The spatial resolution is 1.2 arcsec and time cadence is 12 s. We use 171 Å filtergram to check whether there are expanding coronal loops. The 304 Å filtergram is used to observe filaments and 1600 Å is used to confirm the location of flare ribbons. We also use data from the helioseismic and magnetic imager (HMI, Hoeksema et al. 2014) onboard SDO to get the photospheric vector magnetic field data (SHARP, Bobra et al. 2014). The spatial resolution is 1 arcsec and time cadence is 12 min. Besides, surface velocity at the photosphere are derived using the DAVE4VM method (Schuck 2008).
Fig. 2 shows the observations of different events (each column corresponds respectively to an event) at a time near the beginning of the slow-rise phase. Similar to that of the simulation, all these ARs show persistent shearing motion of days around the time of flares. Fig. 2(a2), (b2), and (c2) show snapshots of the surface flows, in which the shear flows can be seen. In the following, we will describe the events one by one.
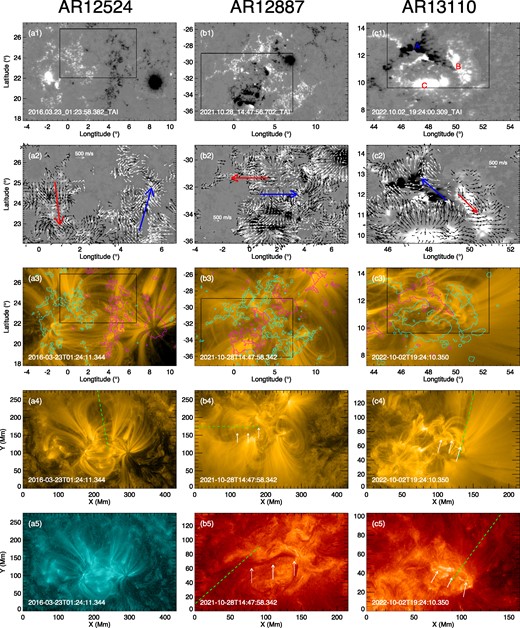
Observations of photospheric magnetic field and coronal structure of the three events, from left to right column, respectively. (a1), (b1), (c1): The photospheric magnetic flux distribution around the beginning of the slow-rise phase. The black box in each panel denotes the footpoint area of the coronal loops that experience slow-rise expansion. (a2), (b2), (c2): surface velocity field overlaid on the magnetogram with field of view as denoted by the black box in top panels. The velocity in region of |$B_z \gt 0~(\lt 0)$| is shown by black (white) arrows. The red and blue arrows are used to highlight the overall structure of the shearing flow. (a3), (b3), (c3): Coronal loops in AIA 171 Å, the field of view is the same as that of the top panels. The overlaid contours are shown for |$B_z = 200$| G (coloured in cyan) and |$-200$| G (pink). (a4), (b4), (c4): larger field-of-view images in AIA 171 Å for observation of the loop expansion. The green dashed line denotes the slit for making the time-distance plots as shown in Figs 3, 5, and 7. (a5), (b5), (c5): AIA 131 Å image of AR 12524, AIA 304 Å images of AR 12887 and AR 13110. The green dashed line denotes the slit for making the time-distance plots in Figs 5 and 7. The white arrows denote the location of the eruptive filaments in each AR. An animation is attached for each event, showing the evolution from pre-eruption to eruption phases.
The first event is a C1.1 flare that occurred on 2016 March 23 in AR 12524. The flare peaked at 03:54 ut, and no filament eruption is observed. Therefore, the slow rise can only be detected by inspection of the coronal loops. As AR 12 524 has a simple bipolar configuration, the connection of its coronal loops is clearly identified. As can be seen in Fig. 2(a4), there is a group of potential-field-like loops in the northern part of this AR. Comparing panel (a3) and (a1), one can see the legs of the set of loops are anchored in a weak and dispersion magnetic field. During a period of around two hours before the eruption, this set of coronal loops experiences continued expansion (which can be seen in the attached animation). To estimate the speed of this expansion, we track the movement of the top of the loop set along its main direction of rising, which is marked by the green dashed line in Fig. 2(a4). In Fig. 3, we show the time-distance map of the slit, along with the GOES SXR flux and AIA 131 Å flux (Fig. 3a) which are used to determine the onset of the flare. Since the GOES SXR flux is taken for the full disc and may be interfered by other regions, the source-integrated AIA 131 Å flux as restricted within the studied AR can better represent the target flare emission, from which one can determine more accurate the onset time of the flare. Clearly, the onset time of flare is around 03:00 ut, as denoted by the dark dashed line. Note that in about an hour before the flare onset, the expansion speed of the coronal loops as traced is around 10 km s|$^{-1}$|. In comparison, we also calculated the velocity at the photosphere, which is shown in Fig. 2(a2). Thus, the pre-flare expansion of the coronal loops shows that it is a slow-rise process, since its speed is at least an order of magnitude larger than a quasi-static evolutionary speed determined by the photospheric motions. We also note that the real speed of expansion is underestimated due to the projection effect, as the actual rise direction of these loops may not be perpendicular to the line of sight. Fig. 4 shows the footpoints of these expanding loops during the flare in 1600 Å, 171 Å, and 304 Å images, whose field of view is denoted by the black box in Fig. 2(a). Since the flare is rather weak, the flare ribbons are not clear until at 03:22 ut. They can be seen simultaneously at both the two footpoint regions of these loops. As time goes on, the north-east ribbon begins to move downwards and the ribbons are getting brighter in both regions until 04:00 ut. It likely indicates that this set of coronal loops are involved with the formation of current sheet before the flare and reconnection during the flare.
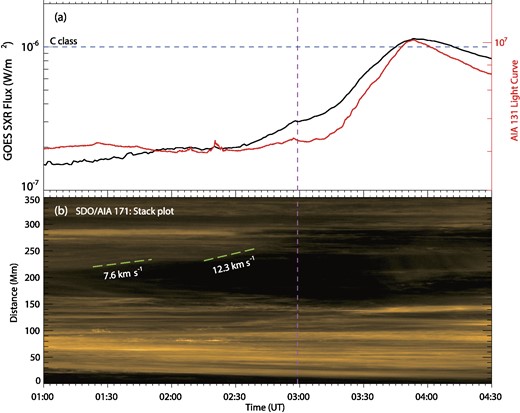
Slow rise of the erupting coronal loops in AR 12524. (a) GOES SXR flux and AR-integrated AIA 131 Å light curve observed in the time period around the flare. The horizontal dashed line denotes the level of flux that is defined for flare reaching C class. The vertical dashed line denotes the onset time of flare. (b) Time-distance stack plot for the slit as shown in Fig. 2(a4). The rising of the loops is denoted by the green marks and the average speeds by the numbers.
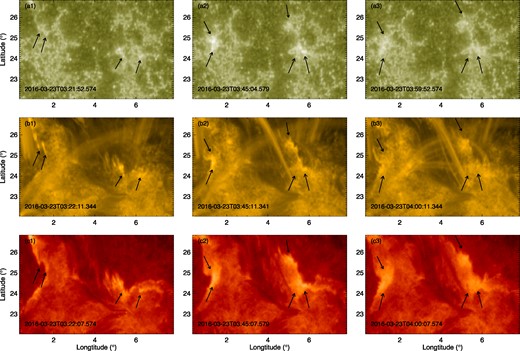
Observation of the flare of AR 12524 in AIA 1600 Å (a1–a3), AIA 171 Å (b1–b3), and AIA 304 Å (c1–c3) bands. The field of view is same as Fig. 2 (a2). The black arrows denotes the position of the flare ribbon.
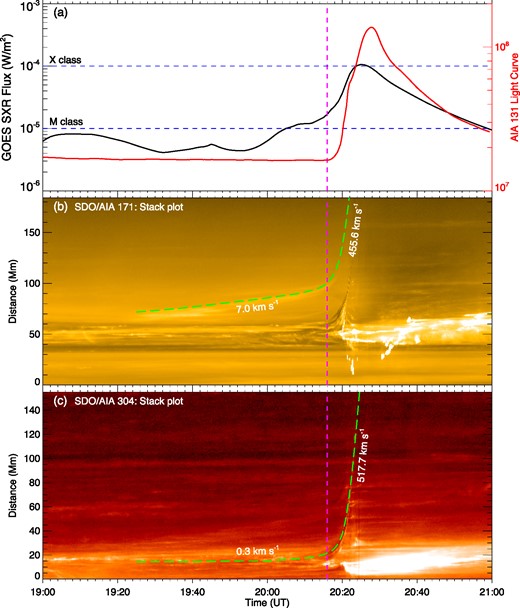
The second event is an X1.0 flare that occurred on 2021 October 28 in AR 12887. The AR has a multipolar field and produced many flares in a few days, including two M-class flares and an X-class flare. This X1.0 flare (peaked at 15:35 ut and accompanied by a CME) is also the first on-disc X-class flare in solar cycle 25 (Duan et al. 2023). In the flare of AR 12887, there is a filament eruption, by which we can track the kinematic evolution of the core field. As shown in Fig. 2(b5), we trace the filament along the green dashed line, along which the rise of the filament before and during eruption can be seen most clearly. Still, there is a group of coronal loops overlying the filament showing slow expansion before the eruption, as can be seen in the attached animation. In Figs 5(b) and 5(d), one can see from 14:50 ut, the coronal loops begin to rise slowly, with a speed of around 8.4 km s|$^{-1}$|, which is significantly larger than that of the filament (which is around 0.6 km s|$^{-1}$| and only became apparent after 15:03 ut). These speeds are also subjected to the projection effect. Duan et al. (2023) have studied this event and obtained a more precise speed of the filament, by using a triangulation approach (Thompson 2009), which combines the SDO/AIA and STEREO/EUVI observations to eliminate the projection effects. The average speed they get between 15:00 ut and 15:20 ut is 5.9 km s|$^{-1}$|. For the overlying loops, since the observation by STEREO is not sufficient to use the triangulation approach, we estimate the real speed in an approximate way. We first search the field lines in an extrapolated coronal magnetic field model (which is the non-linear force-free field extrapolation as has been performed by Duan et al. 2023) that match the set of loops. It is found that these field lines are approximately in a plane that has an angle of around |$30^{\circ }$| from the line of sight. Thus the actual speed of these overlying loops is already close to 20 km s|$^{-1}$| from 14:50 ut. Therefore, the slow-rise phase of this event is more clearly identified from the expansion of the overlying loops than the rise of the filament. In particular, in the slow-rise phase, the rise of the filament, which represents the core field, is much slower than the expansion of the overlying field. Once the eruption starts, the filament is impulsively accelerated to a speed of around 410 km s|$^{-1}$|, becoming much faster than the expansion of the overlying loop (which is 261 km s|$^{-1}$|).
Slow rise of the erupting coronal loops of AR 12887. (a) GOES SXR flux and AR-integrated AIA 131 Å light curve observed in the time period around the flare. The horizontal dashed line denotes the level of flux that is defined for flare reaching C, M, and X class. The vertical dashed line denotes the onset time of flare. (b) Time-distance stack plot for the slit as shown in Fig. 2 (b5). The rising of the coronal loops are tracked by the green dashed line, and the average speeds of the slow rise phase and the eruption phase are denoted by the numbers. (c) Time-distance stack plot for the slit as shown in Fig. 2 (b4), which shows the rise of the filament with the same format of panel (b).
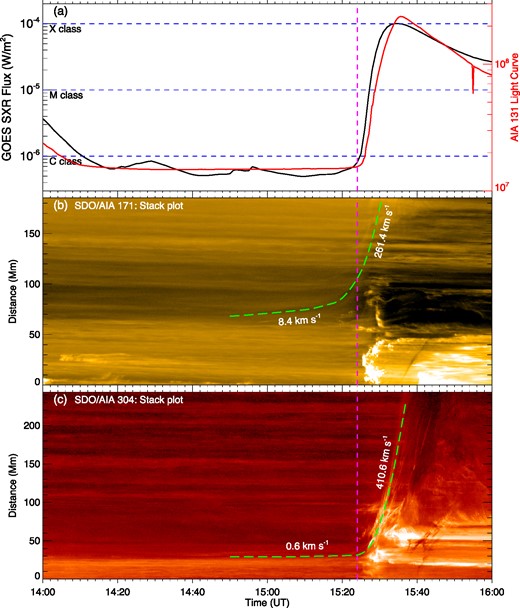
The third event comes from AR 13110, which is also a very active AR that produced two M class flares and one X class flare in two days around 2022 October 2. We focus on an M5.8 class flare that occurred on 2022 October 2 (started at 20:10 ut, peaked at 20:16 ut), accompanied by a CME. The configuration of coronal loops of AR 13 110 is somewhat more complex than that of AR 12887, but still there are expanding loops overlying a filament before its eruption. In Fig. 2(c1), the main magnetic polarities are marked as A, B, and C. The filament is aligned with the PIL between polarities A and B. The coronal loops overlying the filament not only connect polarities A and B (referred to as AB loops), but also polarities A and C (referred to as AC loops). In Fig. 6, we show the base difference images of AIA 171 Å (by subtracting the image at 19:00 ut) to inspect the expansion of these coronal loops. The AB loops are marked by the red arrows and AC by the blue arrows, while the filament is the inverse-S shaped structure marked by the green arrows. All these loops present clearly expanding motion before the eruption. In Fig. 7, we estimate the expansion speed of the loops as well as the speed of the filament. The source-integrated AIA 131 Å flux is also used to confirm the accurate onset time of the flare, which is 20:16 ut. As can be seen in Fig. 7(b), the expansion of the loops shows that there is a period of slow rise with about one hour. The expansion speed, as calculated along the green line in Fig. 2(c4), is around 7 km s|$^{-1}$|. The speed of the filament, which is calculated along the green line in Fig. 2(c5) (as the filament motion is clearest along this direction), is only 0.3 km s|$^{-1}$|. Therefore, the slow-rise phase is similar that in the flare of AR 12887, that is, the slow-rise phase can be more clearly identified from the expansion of the overlying loops than the rise of the filament. Once the eruption starts, the filament is accelerated rapidly, reaching around 517 km s|$^{-1}$| and becoming much larger than the expansion of the overlying loop (which is 455 km s|$^{-1}$|).
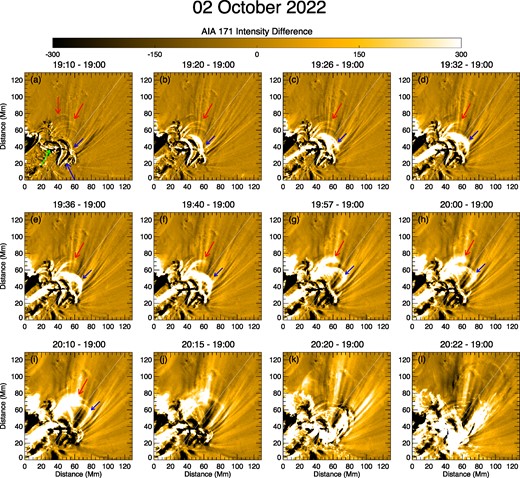
A sequence of base-difference images in AIA 171 Å for the temporal evolution of the coronal loops in the flare event of AR 13110. The green arrow denotes the location of filament, and the red and blue arrows show the position of two sets of overlying loops that shows slow-rise expansion.
Slow rise of the erupting coronal loops of AR 13110. The format of the plots is identical to that in Fig. 5.
4 CONCLUSION AND DISCUSSION
In summary, based on an MHD simulation of eruption initiation, we suggest a viable explanation for the slow-rise phase, which is different from the previous proposed mechanism based on pre-flare slow reconnection below a growing MFR. The simulation shows that a simple magnetic arcade, as driven by continuous shearing motion at the photosphere, will ultimately produce an eruption by reconnection at a current sheet formed within the core field of the arcade. In a short period before the onset of eruption (which is also the start of the reconnection), the enveloping field experiences an expansion with speed much larger than the quasi-static expansion speed. Therefore, it may explain the slow-rise phase in events that has no process of formation of a pre-eruption MFR associated with slow reconnection.
Moreover, in such a slow-rise phase, the expansion of the enveloping field is significantly faster than the rising of the core field. We have studied three representative flare events from C-class to X-class ones, for which the slow-rise phase shows behaviour similar to the simulation. For all the events, we observe the slow expansion of enveloping coronal loops before the eruption. In those events with core field as traced by a filament, the expansion speed of the coronal loops is much larger than the rise of the filament. This suggests that the expansion of the coronal loops in the slow-rise phase is not pushed by the core field. This is an important difference from the slow-rise phase mechanism centered around the dynamics of a MFR. If in the slow-rise phase the dynamics are controlled by the MFR itself, the expansion of its overlying loops ought to be driven by the MFR, and thus their expansion speed cannot be faster than that of the driver, i.e. the MFR. Indeed, after the start of eruptions in the events, the filaments immediately attained a higher speed than the overlying loops, since the latter is driven to move by the former during the eruption. We also note in some events that the slow-rise phase can likely be explained by the MFR-based mechanism as shown by Cheng et al. (2020), the expansion of coronal loops is found to be slower than the core field as traced by filaments or hot channels. Also, the slow-rise phase of our studied events is not driven directly by the photospheric motion since that driving simply results in a quasi-static expansion of the loops. It is actually a manifestation of the growing expansion of a continuously sheared arcade in the process of asymptotically approaching a fully open field state, which is inherent to the formation of a current sheet.
Last, we note that in some cases, for example, as shown in our analysed events, the slow expanding of overlying coronal loops is observed clearly well before that of the core field (as traced by either filament or hot channel), it could be a better indicator about whether an AR enters the slow-rise phase and is to erupt imminently. This is particularly useful when neither filament nor hot channel is seen.
ACKNOWLEDGEMENTS
This work is supported by National Natural Science Foundation of China (NSFC) U2031108, and Yunnan Key Laboratory of Solar Physics and Space Science under the number YNSPCC202213. CJ acknowledges support by NSFC42174200, Guangdong Basic and Applied Basic Research Foundation (2023B1515040021), and Shenzhen Science and Technology Program (grant no. RCJC20210609104422048). Data from observations are courtesy of NASA/SDO. We are very grateful to the referee for the meaningful comments and suggestions.
DATA AVAILABILITY
All the data generated for this paper are available from the authors upon request.
Footnotes
For the aim of reducing the computational time, this velocity used in the simulation is larger than the real value in the photosphere, but it is still smaller than the coronal Alfvén speed by at least two orders of magnitude, and also much smaller than the typical slow-rise speed.
