


ABSTRACT
We have critically reviewed the literature pertaining to reactions that are significant for the chemistry of hydrogen-, deuterium-, and helium-bearing species in the homogeneous early Universe. For each reaction rate coefficient, we provide a fit in the modified-Arrhenius form, specifying the corresponding uncertainty and temperature range. This new network, limited to 21 reactions, should be the most reliable to date. Combined with accurate state-to-state rate coefficients for inelastic and reactive collisions involving H2 and HD, it allows us for the first time to follow the evolution of the abundances of atomic and molecular species, level populations of H2 and HD, and the ortho:para ratio (OPR) of H2, in a self-consistent fashion during the adiabatic expansion of the universe. The abundances of H2 and HD change only marginally compared to previous models, indicating that the uncertainties on the main reaction rate coefficients have essentially been removed. We also find that the adiabatic expansion has a dramatic effect on the OPR of H2, which freezes-out at redshifts z ≲ 50. In contrast, at higher redshifts, the populations of the rotational levels of H2 and HD are predicted to be fully thermalized at the temperature of the cosmic background radiation field, a result that conflicts with some recent, independent calculations. This new network allows the chemistry of primordial gas to be followed during the early phase of collapse towards Population III star progenitors.
1 INTRODUCTION
Elucidating how the first stars, called Population III (Pop III), formed is critical to a comprehensive understanding of the transition from a metal-free, homogeneous Universe to a highly structured and chemically complex one. Pop III stars formed at redshifts z ≳ 15 in dark matter minihaloes located at the intersections of dark matter filaments (see Bromm & Yoshida 2011; Yoshida 2019, for a review). For star formation to take place, the mass of the mini-haloes (∼106 M⊙) must overcome a critical value to ensure both gravitational collapse and efficient cooling (Tegmark et al. 1997; Bromm & Larson 2004; Yoshida et al. 2006; Greif 2015; Lenoble, Commerçon & Rosdahl 2024). Although observing Pop III stars is still highly challenging, indirect constraints are obtained e.g. from stellar or galaxy archaeology (Lee, Jeon & Bromm 2024). The most recent observations with the JWST show that the abundance of bright galaxies at redshifts z > 9 is unexpectedly high (Finkelstein et al. 2023), a result which could indicate that the stellar initial mass function (IMF) of Pop III stars is top-heavy, characterized by a high fraction of high-mass stars compared to the classical Salpeter IMF prevailing at lower redshifts (Ishigaki et al. 2018; Hartwig et al. 2022; Finkelstein et al. 2023). The mass of the Pop III progenitors is of the order of the Jeans mass, which scales as |$n_{{\rm H}}^{-1/2} T^{3/2}$| with nH and T the hydrogen nuclei density and gas kinetic temperature, respectively. The temperature of the gas results from a competition between heating by PdV work and molecular cooling, primarily by H2 and HD. Detailed calculations show that, in the initial phase of gravitational collapse, the gas temperature first increases to a value of the order of 2000 K and then falls to a minimum value of the order of ≈200 K (Flower & Pineau des Forêts 2001; Yoshida et al. 2006). The cooling efficiency by excitation of H2 is a well-studied process (Hollenbach & McKee 1979; Le Bourlot, Pineau des Forêts & Flower 1999; Yoshida et al. 2006) and is known to be sensitive to the level population of H2 until local thermodynamic equilibrium (LTE) is reached at densities nH ≳ 105|$\, \text{cm}^{-3}$| (Coppola et al. 2019; Flower et al. 2021). A recent determination of the H2 cooling function (Flower et al. 2021), using state-of-art excitation cross-sections and computed self-consistently with the OPR of H2, shows deviations by one order of magnitude at temperature below 1000 K compared to earlier estimates (Glover & Abel 2008; Glover 2015).
To correctly account for the OPR and level populations of H2 in an expanding universe, the chemical content of the gas must be evaluated. Molecular abundances in the primordial gas have long been a topic of astrophysical research (Peebles 1968; Zeldovich, Kurt & Syunyaev 1968; Tegmark et al. 1997; Galli & Palla 1998, 2013; Stancil, Lepp & Dalgarno 1998; Flower & Pineau des Forêts 2000; Hirata & Padmanabhan 2006; Alizadeh & Hirata 2011 ). One of the main motivations of these studies was to determine the abundance of molecular hydrogen, which is the main coolant during the gravitational contraction of condensations of the primordial medium (e.g. Lepp & Shull 1984; Flower & Pineau des Forêts 2001; Glover & Abel 2008). In contrast, the cooling of the homogeneous primordial gas is dominated by its adiabatic expansion and not by radiative transitions in molecules, notably H2, which actually lead to heating of the medium when the kinetic temperature becomes less than the black-body radiation temperature (Puy et al. 1993; Flower & Pineau des Forêts 2000).
The most complete study of the chemical evolution of the primordial medium is probably that by Walker, Porter & Stancil (2018, hereafter W18) who calculated not only the abundances of atomic and molecular species but also, in the cases of H2, HD, and H|$_2^+$|, the distributions of population amongst their rovibrational levels; this approach enables the ratio of populations of specific levels, such as v = 0, j = 1, and j = 0, to be determined. In particular, this ratio becomes equal to the relative abundance of ortho- and para-H2 in the limit of small redshifts, z.1 However, as will be explained in Section 3, the approach adopted by W18 leads to incorrect values of the OPR when freeze-out occurs, at z ≲ 20.
In the following Section 2, we present the chemistry that we have adopted in order to calculate the abundances of atomic and molecular species in the primordial medium. In Section 3, we consider the computation of the populations, n(v, j), of individual rovibrational levels, (v, j), of H2 and HD. The results of our calculations are presented and discussed in the following Section 4, where comparison is made with the calculations of W18. Our conclusions are summarized in Section 5.
2 A NEW CHEMICAL NETWORK
Since the reference work by Galli & Palla (1998; hereafter GP98), there has been significant progress in the theoretical and/or experimental determination of key reaction rate coefficients for the early Universe chemistry. In the last decade, a number of primordial chemical networks were thus significantly revised and updated (Coppola et al. 2013; Glover 2015; Walker et al. 2018). In this work, we started from the GP98 minimal network, on which the work of Flower & Pineau des Forêts (2000; hereafter FP00) was based, and all reaction rate coefficients have been updated from a comprehensive literature survey. A few additional reactions were checked and shown to be unimportant at the investigated redshifts, as detailed in Section 4.2 below. It should be noted that our final network is suitable for the (post-recombination) adiabatic expansion phase of the Universe where the baryon density is lower than |$\sim 100\, \text{cm}^{-3}$|. Indeed, other chemical reactions take over in the primordial haloes, such as the three-body H2 formation reaction (H + H + H → H2 + H) which become efficient as soon as the density exceeds ∼108 |$\, \text{cm}^{-3}$| and the gas gets fully molecular.
We describe below the revision of the hydrogen, deuterium, and helium chemistry (lithium chemistry is neglected). All reaction rate coefficients were fitted using the standard modified-Arrhenius (or Koij–Arrhenius) equation:
where α is in cm3s−1 or s−1 and γ is in Kelvin. Fits were performed over the (kinetic or radiation) temperature range 10–10 000 K except otherwise stated. The list of reactions and their coefficients α, β, and γ are given in Table 1. It should be noted that in contrast to more complicated polynomial fits, the modified-Arrhenius law guarantees, in most cases, a physical behaviour of the rate coefficients outside the fitted temperature range. Moreover, because solvers of ordinary differential equations can be sensitive to the continuity of the rate coefficients, piecewise fits are not recommended. We also stress that the typical accuracy of theoretical and experimental rate coefficients (|$\pm 20~{{\ \rm per\ cent}}$| at best) does not justify, in general, sophisticated fitting functions.
Reaction rate coefficients of our network, in the standard form k(T) = α × (T/300)βexp (− γ/T) where α is in |$\, \text{cm}^{3}$||$\, \text{s}^{-1}$| or s−1 and γ in Kelvin. Numbers in parentheses are powers of 10.
| Label | Reaction | α | β | γ | Notes (see text) | References |
|---|---|---|---|---|---|---|
| H1) | H+ + e− → H + ν | 3.22(−12) | −6.75(−1) | 0.00 | Case-B | Flower & Seaton (1969) |
| H2) | H + ν → H+ + e− | 1.18(7) | 1.00(0) | 1.58(5) | Hummer & Seaton (1963) | |
| H3) | H− + ν → H + e− | 1.23(4) | 2.35(0) | 8.75(3) | McLaughlin et al. (2017) | |
| H4) | H + e− → H− + ν | 2.45(−16) | 8.46(−1) | 0.00 | Detailed balance | McLaughlin et al. (2017) |
| Inaccurate fit for T > 104 K | ||||||
| H5) | H− + H → H|$_2^+$| e− | 3.57(−9) | −3.12(-1) | 13.8 | Kreckel et al. (2010) | |
| Inaccurate fit for T < 10 K | ||||||
| H6) | H− + H+ → H + H | 1.89(−7) | −4.42(-1) | 0.00 | Nkambule et al. (2016) | |
| H7) | H + H+ → H|$_2^+ + \nu$| | 6.52(−19) | 1.75 | 0.00 | Inaccurate fit for T < 50 | Zammit et al. (2017) |
| Inaccurate fit for T > 104 K | ||||||
| H8) | H|$_2^+$| + ν → H + H+ | 3.87(6) | 5.70(−1) | 3.29(4) | H|$_2^+$|(v, j) at LTE | Zammit et al. (2017) |
| H9) | H|$_2^+$| + H → H2 + H+ | 8.93(−10) | 0.00 | 0.00 | H|$_2^+$|(v = 0, j = 0) | Ghosh et al. (2021) |
| H10) | H2 + H+ → H|$_2^+$| + H | 2.43(−10) | 0.00 | 2.14(4) | H2(v = 0, j = 0) | Savin et al. (2004) |
| D1) | D+ + e− → D + ν | 3.22(−12) | −6.75(-1) | 0.00 | Same as H1) | Flower & Seaton (1969) |
| D2) | D + ν → D+ + e− | 1.18(7) | 1.00(0) | 1.58(5) | Same as H2) | Hummer & Seaton (1963) |
| D3) | D+ + H → D + H+ | 2.18(−9) | 3.55(−1) | 0.00 | Inaccurate fit for T < 10 K | Savin (2002) |
| D4) | D + H+ → D+ + H | 2.18(−9) | 3.55(−1) | 4.30(1) | Detailed balance | Savin (2002) |
| D5) | D+ + H2 → H+ + HD | 1.50(−9) | 0.00 | 0.00 | H2(v, j) at LTE | Honvault & Scribano (2013a) |
| D6) | HD + H+ → H2 + D+ | 8.57(−10) | 0.00 | 4.05(2) | HD(v, j) at LTE | González-Lezana et al. (2022) |
| He1) | He+ + e− → He + ν | 9.08(−13) | −5.00(-1) | 0.00 | Hummer & Storrey (1998) | |
| He2) | He + ν → He+ + e− | 4.56(7) | 1.00(0) | 2.85(5) | Detailed balance | Hummer & Storrey (1998) |
| He3) | He + H+ → HeH+ + ν | 1.45(−19) | −4.52(-1) | 1.30(1) | Inaccurate fit for T < 10 K | Courtney et al. (2021) |
| He4) | HeH+ + ν → He + H+ | 4.80(4) | −7.67(-1) | 2.23(4) | HeH+(v, j) at LTE | Miyake et al. (2011) |
| He5) | HeH+ + H → He + H|$_2^+$| | 1.04(−9) | 2.36(−1) | 2.42(1) | HeH+(v, j) at LTE | Esposito et al. (2015) |
2.1 Hydrogen chemistry
2.1.1 H1) Hydrogen recombination
The hydrogen recombination is a crucial process to compute the energy spectrum and temperature anisotropy of the cosmic microwave background (CMB) but also for modelling primordial chemistry. Since the pioneering works in the late 1960s (Peebles 1968; Zel’dovich, Kurt & Syunyaev 1969), several refinements have been introduced in recombination physics thanks to progress in atomic and radiative transfer physics (see Glover et al. 2014, and references therein). Here, as in other primordial chemical networks, we have employed the so-called Case B approximation where only radiative recombinations to an excited state of H(n ≥ 2) are taken into account. The direct recombination of protons with electrons to the ground state of H(n = 1) becomes indeed very inefficient at z ∼ 1000 because the emitting ionizing photons (with energies larger than 13.6 eV) are quickly re-absorbed by neighbouring H(n = 1) atoms. While highly sophisticated multilevel recombination models are necessary to model CMB data from e.g. the Planck satellite, the case-B approximation is adequate to simulate the ionization history in chemical models, as we will see in Section 4. In practice, case-B recombination rate coefficients (i.e. summed over all states with n ≥ 2) were computed using the program ACQD (Flower & Seaton 1969) in the temperature range 1–2 × 10⁴ K. The agreement with other results e.g. those of Ferland et al. (1992) is excellent, as shown in Fig. 1 where our power-law fit (γ = 0) was found to reproduce the ACQD data (over 10–10 000 K) to within 20 per cent.

2.1.2 H2) Hydrogen photoionization
The photoionization rate coefficient of ground-state H(n = 1) atoms was obtained by integrating the cross-sections of Hummer & Seaton (1963) over black-body radiation fields:
where Fν(Tr) is the black-body or Planck function, h the Planck constant, σ(ν) the ‘exact’ photoionization cross-section from Hummer & Seaton (1963; see their equations 2.3–2.4) and ν1 = |E1|/h with E1 the electron energy of H(n = 1), i.e. −13.6 eV (−1.58 × 10⁵ K). Because kI(Tr) is entirely negligible below Tr = 1000 K, radiation temperatures Tr were selected in the range 103–104 K.
Alternatively, kI(Tr) can be computed using the detailed balance principle, assuming that heavy-particle, electron and radiation temperatures are all equal (Tk = Te = Tr = T) (see Appendix A). In the case of H(n=1), detailed balance writes as
where g(H+) = 1, g(H(n = 1)) = 2, χ = |E1| (see equation A1) and kR(T) is the rate coefficient for the reverse process, i.e. direct recombination to H(n = 1). The rate coefficient kR(T) was obtained using again the program ACQD in the temperature range 103–104 K and kI(T) was recomputed using equation (3). The agreement with equation (2) was found to be excellent, as expected.2 Finally, because kR(T) follows a T−1/2 temperature dependence, and in accordance with equation (3), the photoionization rate kI(Tr) from equation (2) was fitted over the temperature range Tr = 103–104 K by fixing β = 1.0 and γ = 1.58 × 10⁵ K. The corresponding fit was found to reproduce kI(Tr) to better than 20 per cent.
2.1.3 H3) H− photodetachment
Accurate photodetachment cross-sections for H− were derived by McLaughlin et al. (2017) using quantum R-matrix calculations combined with other theoretical and experimental results for photon energies in the range 0.754–105 eV (see their fig. 2 for a compilation of data). We derived the corresponding photodetachment rate coefficients kI(T) by integrating these cross-sections (provided as supplementary data in McLaughlin et al. 2017) over black-body radiation fields, with radiation temperatures Tr in the range 20–105 K, as in equation (2). The modified-Arrhenius fit was performed by fixing the fitting coefficient γ to the electron affinity of hydrogen, i.e. 0.754 eV or 8.75 × 10³ K. The fit accuracy was found to be better than 40 per cent for temperatures below 10 000 K.
2.1.4 H4) H− radiative attachment
The H− radiative attachment rate coefficient kR(T) was obtained using the detailed balance relation equation (A1):
where g(H−) = 1, g(H(n = 1)) = 2, and χ = 0.754 eV (8.75 × 10³ K) and where kI(T) is the modified-Arrhenius fit for the reverse process H3). As a result, kR(T) follows a power law and is almost proportional to T (β = 0.846, see Table 1). In Fig. 2, our power law is compared to the attachment rate coefficient computed by McLaughlin et al. (2017) where stimulated radiative attachment is neglected (as provided in their supplementary data). The agreement is found to be good up to 104 K, as expected. We note that at higher temperature and full thermal equilibrium (Tr = Tk), stimulated radiative attachment would enhance the rate coefficient of McLaughlin et al. (2017) by up to a factor of 2 at 105 K. Beyond ∼3 × 10⁵ K, however, the stimulated rate coefficient falls off as T−3/2 (see fig. 9 in McLaughlin et al. 2017). As a result, our power-law fit must not be employed for temperatures above a few 104 K. Finally, the agreement with the fit of GP98 is good, except above 104 K where their fitting function induces an exponential drop of the rate coefficient.

2.1.5 H5) Associative detachment of H and H−
Accurate cross-sections for the associative detachment of H and H− were measured at high energy resolution by Kreckel et al. (2010) using a merged-beam apparatus in the collision energy range 3.7 meV−1 eV. These cross-sections were found to be in very good agreement with the best available theoretical results (Cízek, Horácek & Domcke 1998), as shown in fig. 2 of Kreckel et al. (2010). We have refitted the analytical fit function provided in table S1 of Kreckel et al. (2010) that accurately reproduces the theoretical rate coefficient in the temperature range 10−1–105 K. We note that the measurements and calculations of Kreckel et al. (2010) were extended above 1 eV by Miller et al. (2011), confirming the good accuracy of their analytic fit for plasma temperatures up to 104 K. The analytical function of Kreckel et al. (2010) is plotted in Fig. 3 (blue empty squares), along with other experimental results based on flowing afterglow (orange circle) and ion-trap (black filled squares) techniques. The agreement between the results of Kreckel et al. (2010) and the ion-trap measurements is very good while the flowing afterglow value at 300 K lies a factor of ∼2 below (a discussion can be found in Miller et al. (2011)). Our fit is shown to satisfactorily reproduce (to within 20 per cent) the analytical function of Kreckel et al. (2010) in the range 10–10 000 K, while it significantly underestimates (overestimates) the actual rate coefficient at lower (higher) temperatures. We also note that below 104 K the rate coefficient is larger than the Langevin value (1.33 × 10⁻⁹ cm3 s−1), suggesting that the actual H|$_2^-$| potential is more attractive than the polarization asymptotics. Finally, the piecewise fit of GP98 is found to significantly underestimate the data from Kreckel et al. (2010) in the range 10–104 K, by a factor of up to 3 at ∼100 K.
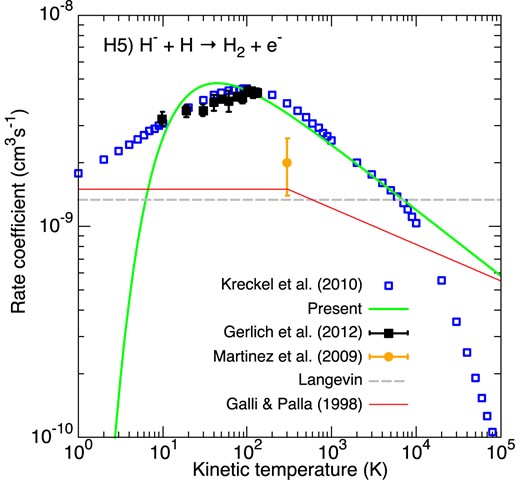
Rate coefficients for the associative detachment of H and H−. Blue empty squares correspond to the recommended theoretical rate coefficient of Kreckel et al. (2010). The black filled squares denote the ion-trap measurements of Gerlich (2012) while the filled circle represents the 300 K measurements of Martinez et al. (2009). The Langevin rate constant is plotted as a dashed grey line. The green line gives our modified-Arrhenius fit. The fit of GP98 is denoted by the thin red line.
2.1.6 H6) Mutual neutralization of H− and H+
Accurate quantum cross-sections for the mutual neutralization of H− and H+ were computed by Nkambule et al. (2016) in the energy range 1 meV−100 eV. These cross-sections were found to agree well with the merged-beam results of Peart & Hayton (1992), in particular at energies above 20 eV (see fig. 6 in Nkambule et al. 2016). A good agreement (within ∼20 per cent) is also observed with the older calculations of Fussen & Kubach (1986). The branching ratios between the final states H(n = 1) + H(n = 2) and H(n = 1) + H(n = 3) were measured by Nkambule et al. (2016) and the agreement between theory and experiment was found to be satisfactory up to ∼100 eV. We have extrapolated the theoretical cross-sections of Nkambule et al. (2016) down to 0.01 meV using the 1/E Wigner’s law for the Coulomb interaction and we have derived the corresponding rate coefficient over the temperature range 10–105 K. Our power-law fit was found to nicely reproduce (to within 12 per cent), the computed rate coefficients up to 10 000 K. The rate coefficient then reaches a minimum at about 30 000 K where it starts to increase.
2.1.7 H7) Radiative association of H and H+
Radiative association is a challenging process to measure in the laboratory because, even at very low gas pressures, it is difficult to distinguish between stabilization by radiation or by collision with a third particle. The role of theory is thus predominant. Accurate quantum state-resolved rate coefficients for the radiative association of H(n) and H+ were computed by Zammit et al. (2017) in the temperature range 10–105 K. In the case of H(n = 1) + H+, the agreement with the older calculations of Stancil, Babb & Dalgarno (1993) was found to be excellent. Tabulated data for stimulated radiative association rate coefficients were provided by Mark Zammit (private communication). Our fit for H(n = 1) was performed over the restricted temperature range 100–10 000 K where the rate coefficient closely follows a power-law temperature dependence, as shown in Fig. 4. We can observe that below 50 K, the rate coefficient flattens due to the increase of the cross-section at collision energies lower than ∼3 meV (see fig. 5 of Zammit et al. 2017). In this regime, our fit significantly underestimates the actual rate coefficient, by up to a factor of 8 at 10 K. We can notice that the fit of GP98 works better, especially below 50 K, at the cost of a complicated polynomial form. We also note that the rate coefficient of Zammit et al. (2017) reaches a maximum at ∼5 × 10⁴ K and then decreases. Overall, our fit reproduces the rate coefficients of Zammit et al. (2017) to within 25 per cent between 100 and 10 000 K.

2.1.8 H8) Photodissociation of H2+
Accurate state-selected photodissociation cross-sections for H|$_2^+(1s\sigma _g,v, j)$| were also computed by Zammit et al. (2017) for a range of H|$_2^+$| rovibrational levels and photon energies. These cross-sections were found to be in good agreement with the old measurements by von Busch & Dunn (1972) (after averaging over the experimental H|$_2^+$| vibrational distribution) and almost identical to the older theoretical results of Saha et al. (1980; see fig. 2 of Zammit et al. 2017). Total cross-sections averaged over LTE distributions of H|$_2^+$| rovibrational levels in the temperature range Trovib = 10–104 K and for photon energies in the range 20 meV−40 eV were provided by Mark Zammit (private communication). We derived the rate coefficients by integrating these LTE cross-sections over black-body radiation fields, with radiation temperatures Tr = Trovib in the range 10–104 K. The modified-Arrhenius fit was performed over the restricted temperature range 1000–10 000 K where the rate coefficient is significant i.e. larger than 10−8 s−1, with an accuracy better than 10 per cent.
2.1.9 H9) Charge exchange between H2+ and H
This important exothermic reaction has not been extensively studied so far. Experimentally, there is to our knowledge one single measurement of the rate coefficient at 298 K by Karpas et al. (1979) using the ion-cyclotron resonance (ICR) technique. Theoretically, the quantum dynamics of H + H|$_2^+(v=0, j=0)$| has been studied only recently by Ghosh et al. (2021) and Sanz-Sanz, Aguado & Roncero (2021). The wave packet method was employed in both studies and the rate coefficient was calculated by Ghosh et al. (2021) in the temperature range 250–1000 K. As shown in Fig. 5, there is only order-of-magnitude agreement between experiment and theory. Further studies are highly desirable. This will involve, in particular, to extend calculations to higher rovibrational states and collision energies. Meanwhile, we have selected a constant value of 8.93 × 10⁻¹⁰|$\, \text{cm}^{3}$||$\, \text{s}^{-1}$| which is the average of the values computed by Ghosh et al. (2021). It is a factor of ∼2 lower than the Langevin value of 1.9 × 10⁻⁹|$\, \text{cm}^{3}$||$\, \text{s}^{-1}$|, which is consistent with charge exchange reactions being usually slower than the Langevin rate. We can notice that it is also in good agreement with the choice of GP98 based on the measurement of Karpas et al. (1979).
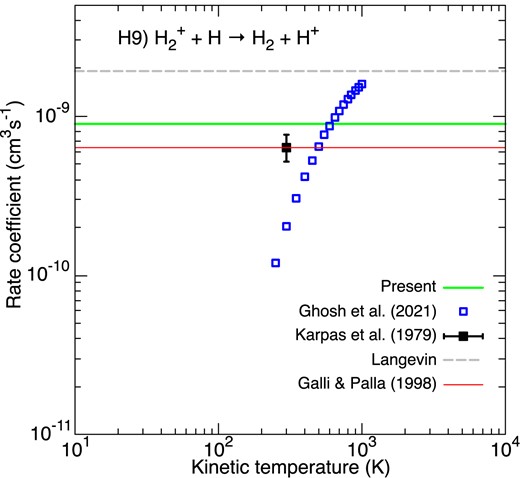
Rate coefficients for the charge exchange reaction between H|$_2^+$| and H. Blue empty squares correspond to the theoretical rate coefficients of Ghosh et al. (2021). The black filled square represents the room temperature measurement of Karpas, Anicich & Huntress (1979). The Langevin rate constant is plotted as a dashed grey line. The green line gives our temperature-independent rate coefficient. The fit of GP98 is denoted by the thin red line.
2.1.10 H10) Charge exchange between H2 and H+
Quantum coupled-channel calculations were carried out by Krstić (2002) for the endothermic (with a threshold of 1.83 eV) charge transfer of H+ on H2, i.e. the reverse of reaction H9). Cross-sections were computed in the energy range 0.6–9.5 eV and they were then used by Savin et al. (2004) to derive the rate coefficient for H2 (v = 0, j = 0) in the temperature range 102–3 × 10⁴ K. These authors also presented a review of the various rate coefficients presented in the literature for reaction H10) (see their fig. 1). They showed that a number of recommended rate coefficients significantly differ from one another (both in magnitude and temperature dependence) and they attributed part of the discrepancies to the improper use of detailed balance. We have here refitted the polynomial function of Savin et al. (2004) that reproduces their theoretical rate coefficient to better than 4 per cent over 102–3 × 10⁴ K. Our fit was found to reproduce the analytical function of Savin et al. (2004) to within 10 per cent in the range 200–10 000 K. We note that more recent experimental and theoretical cross-sections were presented by Urbain et al. (2013) for this important reaction but for impact energies in the range 15–5000 eV, i.e. corresponding to temperatures above 104 K. Further studies are needed, in particular to extend calculations to higher rovibrational states.
2.2 Deuterium chemistry
2.2.1 D1) Deuterium recombination
The rate coefficient of reaction H1) was employed, assuming H/D isotope effects are negligible for the hydrogen recombination process.
2.2.2 D2) Deuterium photoionization
The rate coefficient of reaction H2) was employed, assuming H/D isotope effects are negligible for hydrogen photoionization.
2.2.3 D3) Charge exchange between D+ and H
By using the theoretical cross-sections of Igarashi & Lin (1999) and Zhao, Igarashi & Lin (2000) and extending these data up to energies of 103 eV, Savin (2002) evaluated the rate coefficient of reaction D3) for temperatures from 1 to 2 × 10⁵ K. He also compared these cross-sections to calculations from other groups and the agreement was generally good. However, the rate coefficients were found to differ from those of Galli & Palla (1998) above 300 K, by up to 40 per cent, as reported in Fig. 6. Due to the strongly non-Arrhenius behaviour of the rate coefficient below ∼20 K, reaction D3) was fitted using a power-law temperature dependence, with an accuracy better than 20 per cent down to 20 K. At 10 K, the accuracy of the fit is lower (32 per cent) but still adequate for the purposes of modelling.

2.2.4 D4) Charge exchange between D and H+
As for the reverse reaction D3), the rate coefficients of Savin (2002) for reaction D4) were evaluated from the theoretical cross-sections of Igarashi & Lin (1999) and Zhao et al. (2000). We note that in contrast to reaction D3), there is a couple of experimental measurements for reaction D4) which are in good agreement with the available theoretical results (Savin 2002). Here, the rate coefficient was obtained using detailed balance applied to the fit of reaction D3) with an endothermicity of 3.7 meV (43 K; Igarashi & Lin 1999). The agreement with the rate coefficients of Savin (2002) is very good, as shown on Fig. 6.
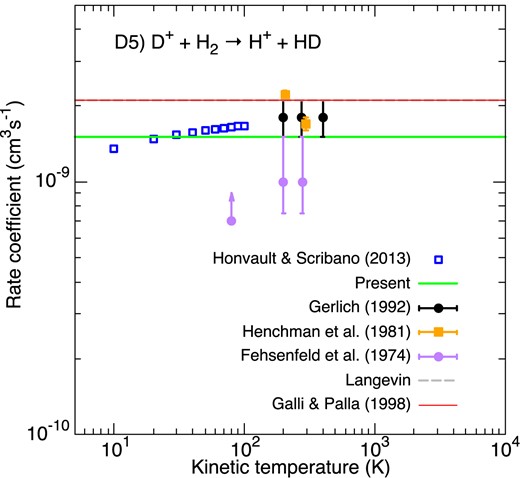
Rate coefficients for the formation of HD via D+ + H2. Blue empty squares correspond to the theoretical rate coefficient of Honvault & Scribano (2013a). The black circles denote the ring electrode trap results of Gerlich (1992) while the purple circles and orange squares are those from the flowing afterglow and SIFT measurements of Fehsenfeld et al. (1974) and Henchman, Adams & Smith (1981), respectively. The Langevin rate constant is plotted as a dashed grey line. The green horizontal line gives our selected constant value. The fit of GP98 is denoted by the thin red line (superposed with the Langevin rate constant).
2.2.5 D5) Formation of HD via D+ + H2
This exothermic reaction has been studied extensively both theoretically and experimentally as a prototype for dynamical studies of ion–molecule reactions. Accurate cross-sections and rate coefficients were computed at low energies by Honvault & Scribano (2013a) (see correction in Honvault & Scribano 2013b) using quantum time-independent calculations. The cross-sections were found in good agreement with previous calculations and also with those measured by Gerlich (1992). We present in Fig. 7 a comparison between the theoretical thermal rate coefficients of Honvault & Scribano (2013b) and the experimental values of Fehsenfeld et al. (1974), Henchman et al. (1981), and Gerlich (1992). The experimental rate coefficients are shown to agree within a factor of ∼2 in the temperature range 200–400 K. We note, however, that data are missing at higher temperature. Merged-beam cross-sections measured by Gerlich (1992), plotted as rate coefficients, actually show a decline (by a factor of ∼ 2) above 0.1 eV (see his fig. 64), suggesting a decrease of the rate coefficient above 1000 K. Further studies are thus needed in the high energy regime. Meanwhile, we have selected a constant value of 1.5 × 10⁻⁹ cm3 s−1 as representative of the available theoretical and experimental rate coefficients. We note that this value is close to the Langevin value of 2.1 × 10⁻⁹ cm3 s−1, which was adopted by GP98.
2.2.6 D6) Destruction of HD by H+
Reaction D6) is the reverse of reaction D5) but it was much less studied in the literature due to its endothermicity (464 K) and the corresponding small rate coefficient at low temperature. The only available experimental rate coefficients are those of Henchman et al. (1981), as reported in Fig. 8. Very recently, reaction D6) was studied theoretically by González-Lezana et al. (2022) using a statistical quantum method. The agreement with the two experimental points at 205 and 295 K is good and a modified-Arrhenius fit was able to reproduce the theoretical thermal rate coefficient to within 30 per cent over 10–3000 K, as shown in Fig. 8. We note that the results of González-Lezana et al. (2022) are also in good agreement with the more exact (but less extensive) quantum time-independent calculations of Lepers, Guillon & Honvault (2021), including state-to-state cross-sections. The fit of GP98 is found to agree well.
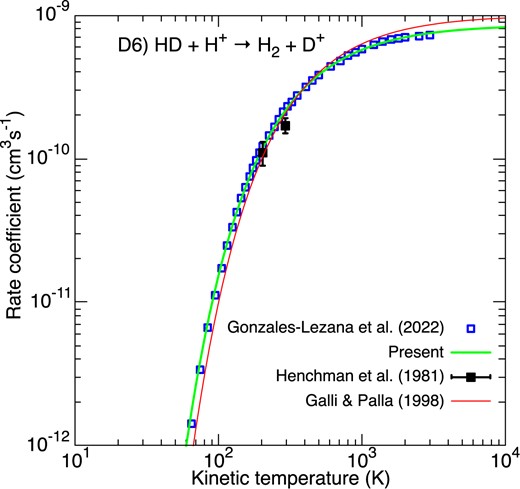
Rate coefficients for the destruction of HD via HD + H+. Blue empty squares correspond to the theoretical rate coefficient of González-Lezana, Hily-Blant & Faure (2022). The black squares denote the SIFT measurements of Henchman et al. (1981). The green line gives our fit. The fit of GP98 is denoted by the thin red line.
2.3 Helium chemistry
2.3.1 He1) Helium recombination
This process is important for chemical models starting at z ≳ 1700, when helium has not yet recombined. Since our chemical network is limited to temperatures lower than 10 000 K (z ≲ 3700); however, we assume that He2 + has recombined (in Saha equilibrium) at z ∼ 6000, and He+ recombination only is considered. As for hydrogen, the helium recombination has been investigated in detail by several groups over the years (see Chluba, Fung & Switzer 2012, and references therein). Switzer & Hirata (2008) have shown that the inclusion of intercombination lines and of the continuum absorption of hydrogen leads to an acceleration of He+ recombination at z ∼ 1700, much earlier than in previous models (see their Fig. 14). Here, as in other primordial chemical networks, we have assumed direct recombination to the He ground state 1s2 (1S), i.e. Saha equilibrium, resulting in an even earlier recombination at z ∼ 2200 (see Fig. 12 below). The impact on chemistry is negligible since the abundances of primordial molecules become significant at much lower z, as we will see below. The theoretical rate coefficient of Hummer & Storey (1998) was adopted (from their table 5), which covers the electron temperature range 10–2.5 × 10⁴ K. Our power-law fit (γ = 0) was found to reproduce their data to within 2 per cent up to 10 000 K. We note that helium recombination rate coefficients were extended up to 109 K by Nahar (2010) and the agreement with the results of Hummer & Storey (1998) was found to be very good. Above ∼3 × 10⁴ K, Nahar (2010) also found dielectronic recombination to dominate over radiative recombination, leading to a strong peak of the rate coefficient at T ∼ 3.2 × 10⁵ K, beyond which the rate coefficient falls smoothly again. In this regime, a good agreement with experimental recombination spectra was noted by Nahar (2010).
2.3.2 He2) Helium photoionization
The helium photoionization rate coefficient kR(T) was obtained using the detailed balance relation equation (A1):
where g(He+) = 2, g(He) = 1, and χ = 24.6 eV (2.85 × 10⁵ K), and where kR(T) is the rate coefficient for He+ recombination (reaction He1). Equation (5) was thus directly applied to the fit of reaction He1) (see Table 1). As a check, we also computed kI(T) by integrating the He(1s2) photoionization cross sections of Yan, Sadeghpour & Dalgarno (1998) (provided in their table 2) over black-body radiation fields. The agreement with equation (5) was found to be excellent, as expected.
2.3.3 He3) Radiative association of He and H+
The recent detection of HeH+ in the planetary nebula NGC 7027 (Neufeld et al. 2020) has stimulated new calculations of the rate coefficients for its formation and destruction. In the early Universe, the dominant formation process involves the radiative association between He and H+. No measurement exists but rovibrationally-selected rate coefficients were computed recently by Courtney et al. (2021) for this process. These authors also provided LTE and non-LTE (in the zero-density limit) rate coefficients in the kinetic temperature range Tk = 1–104 K, with both Tr = 0 and Tr = Tk. For the non-LTE cases, good agreement with the older calculations of Zygelman, Stancil & Dalgarno (1998) was found. As displayed in Fig. 9, our fit for the LTE case (Tr = Tk) nicely reproduces the data of Courtney et al. (2021)3 down to 10 K (to within 15 per cent). At lower temperature the theoretical rate coefficient decreases slowly while our modified-Arrhenius fit with γ = 13 K (see Table 1) predicts a strong drop. We also note that stimulated radiative association becomes significant for Tr ≳ 200 K, as shown in fig. 1 of Courtney et al. (2021). Finally, we can notice (Fig. 9) that the fit of GP98 largely overestimates the data of Courtney et al. (2021), by up to a factor of 10 at 10 K.

2.3.4 He4) Photodissociation of HeH+
Experimental data for the photodissociation of molecules are very scarce. In the case of HeH+, one measurement was performed by Pedersen et al. (2007) at 32 nm (38.7 eV) using a fast ion beam crossed with a free-electron laser. Qualitative agreement with theory was observed in this XUV-wavelength regime (see Loreau et al. 2011, and references therein). For photons with much greater wavelengths, photodissociation of HeH+ is dominated by pure rovibrational transitions in the X1Σ+ electronic ground state, leading to the He + H+ dissociation channel. The dissociation energy from the ground rovibrational level of HeH+ is 1.845 eV (Stanke et al. 2006). Accurate photodissociation cross sections were computed for an extensive set of HeH+ rovibrational levels by Miyake, Gay & Stancil (2011). LTE cross-sections were also obtained by these authors assuming a Boltzmann distribution of rovibrational levels at temperatures between 500 and 12 000 K. We derived the rate coefficients by integrating these LTE cross-sections over black-body radiation fields, with radiation temperatures Tr in the range 500–12 000 K. A modified-Arrhenius fit of the rate coefficients was then performed over the restricted temperature range 1000–10 000 K where the rate coefficient is significant i.e. larger than 10−8 s−1, with an accuracy better than 6 per cent. We note that the other dissociation channel He+ + H (via the A1Σ+ electronic state) becomes competitive only at radiation temperatures above 10 000 K (see fig. 2 in Miyake et al. 2011) and was thus neglected.
2.3.5 He5) Destruction of HeH+ by H
The proton transfer between HeH+ and H is a simple triatomic example of exothermic and barrier-less reactions. It was studied in the laboratory by Rutherford & Vroom (1973) using crossed beam techniques and absolute cross-sections were reported by these authors in the energy range 0.2–4 eV. A good agreement with the quantum time-independent calculations of Esposito et al. (2015) was observed, provided that the absolute experimental values are rescaled by a constant factor of 2.4. Esposito et al. (2015) also performed quasi-classical calculations in order to extend their results at higher collision energy (above 1.25 eV) and for higher HeH+ rovibrational states (above v = 0, j = 5). They were thus able to derive and fit the thermal reaction rate coefficient up to 15 000 K, as reported in Fig. 10, where we can observe that the agreement with the single experimental value measured by Karpas et al. (1979) at 298 K is excellent. We note that the rate coefficient shows a broad maximum at ∼6000 K close to the Langevin value. Our modified-Arrhenius fit reproduces the polynomial fit provide by Esposito et al. (2015) to within 25 per cent up to 10 000 K. The constant value of GP98, based on the measurement by Karpas et al. (1979), is much larger than the data of Esposito et al. (2015) below 300 K, by up to a factor of ∼20 at 10 K. It is however unclear why the reactivity decreases so rapidly below ∼300 K and further theoretical and experimental studies, in particular at low-temperature, are desirable. We note in this context that new quantum time-independent calculations are in progress (Yohann Scribano, private communication).
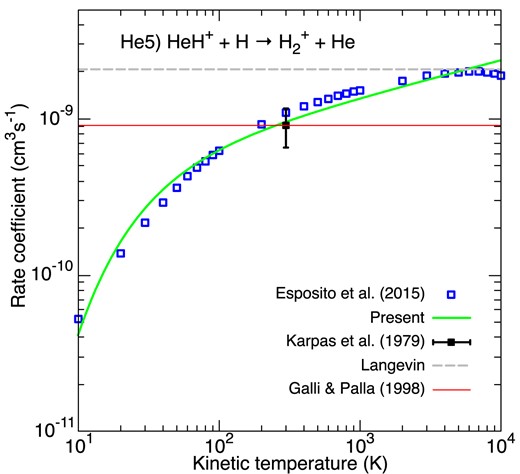
Rate coefficients for the destruction of HeH+ via HeH+ + H. Blue empty squares correspond to the theoretical rate coefficient of Esposito, Coppola & De Fazio (2015). The black square denotes the crossed beam measurements of Karpas et al. (1979). The Langevin rate constant is plotted as a dashed grey line. The green line gives our fit. The fit of GP98 is denoted by the thin red line.
3 ABUNDANCES AND LEVEL POPULATIONS
The temporal evolution of the number density n(X) of each chemical species is followed during the expansion by solving the differential equation (see equation 6 of FP00):
where N(X) is the net rate of formation (or destruction, if negative) of chemical species X per unit volume and a(t) is the scale factor (a(t) = (1 + z)−1). The rate of expansion of the Universe is determined by
with
The cosmological parameters are taken from Planck Collaboration VI (2020): H0 = 67.4 km s−1 Mpc−1, Ωb = 0.0493, Ωm = 0.315, Ωr = 9.27 × 10⁻⁵, and ΩΛ = 0.685. Neglecting the contribution of Ωr, the expansion parameter approximates to
where |$t_{\Lambda } = 2/(3H_0 \Omega _{\Lambda }^{0.5})$|. The use of equation (8) for H(t), rather than equation (2) of FP00 (Einstein–de Sitter universe), has consequences for the dynamical (adiabatic expansion) time-scale and hence for the evolution of the OPR of H2 (see below).
The rates of chemical reactions relating to H-, D-, and He-bearing species was updated following Section 2. The full set of coupled differential equations which is solved is given in section 2 of FP00. We note that in this approach, four ‘fluids’ are considered: neutrals, positive ions, electrons, and photons. The variation with time of the four temperatures are given by Flower & Pineau des Forêts (2000) in their equations (1), (3), (4), and (5), respectively. In practice, neutrals, positive ions, and electrons have almost identical temperatures. On the other hand, we adopt a more recent determination of the primordial deuterium abundance, nD/nH = 2.53 × 10⁻⁵ (Cooke, Pettini & Steidel 2018).
With a view to establishing the impact of the OPR of H2 on the thermodynamic evolution of the primordial gas, the population of the rovibrational levels of H2 must be computed explicitly. In order to compute the population densities of the rovibrational levels of H2, an equation similar to equation (6) must be solved for each level ni = (v, j) of H2:
where
with N the number of H2 levels taken into account (see below), Pji and Pij the populating and depopulating rates:
In the above equation, Bν(Tr) is the Planck function, Aij and Bij are the H2 Einstein coefficients for (quadrupole) spontaneous and stimulated emission, respectively, and the Cij are the rates for inelastic and exchange collisions of H2 with the perturbers H, He, H2, H+, and e− (see Flower et al. 2021, for more detailed information on the sources of these data). In particular, for collisions with H+, the recent state-to-state rate coefficients of González-Lezana et al. (2021) were adopted. We note that state-to-state exchange collisions with both H+ and H can lead to a change of the total nuclear spin of H2 and hence to ortho-para conversion. On the other hand, the contribution of chemical reactions (formation and destruction of H2) is not state-selective in our approach.
In contrast to H2, HD has a small but finite dipole moment and hence dipolar radiative transitions are allowed. Such transitions are intrinsically faster than the quadrupole transitions which characterize H2, and the radiative lifetime of the (v = 0, j = 1) level, which is somewhat less than a year, is ten orders of magnitude less than the age of the Universe. Results illustrating these points are presented in Section 4 below. The dynamical term, −3da/(adt), can thus be neglected. Collisions of HD with the neutral perturbers H, He, H2 were taken into account following the analysis of Flower et al. (2000).
4 RESULTS
Following the procedure described in Section 3, we have computed the variation with z of the abundances of the chemical species and the population densities of the lower rovibrational levels of H2 and HD. Eighteen levels of H2 (up to 1.0 × 10⁴ K above the ground state, i.e. v = 0, j = 0 to 10 and v = 1, j = 0 to 6) were taken into account and, in the case of HD, rotational levels j = 0 to 9 of the vibrational ground state. In view of the larger radiative rates applicable to HD, only the steady-state level populations were computed at each value of z. Results for z < 20 are not presented because at these redshifts the kinetic temperature is lower than 10 K, as shown Fig. 11.
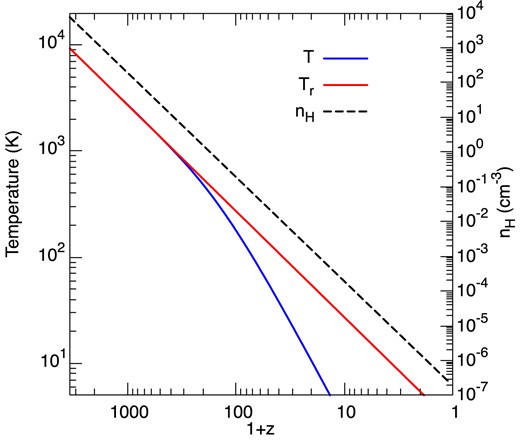
The black-body radiation temperature, Tr, gas kinetic temperature, T, and hydrogen nuclei density, nH, as functions of the redshift, z.
4.1 Recombination
In Fig. 12, the free electron fraction is plotted as function of redshift. Our result is compared to the simple Saha equilibrium solution and to that obtained with the recombination code Recfast++ (Chluba & Thomas 2011).4 This code is based on the three-level atom model of Peebles (1968) and it has been shown to describe the electron fraction to within |$\sim 0.1~{{\ \rm per\ cent}}$| compared to a full multilevel computation (Hart & Chluba 2018). The agreement between our result and the Saha solution is excellent at high z while for z ≲ 1000, the present electron fraction is found to freeze-out at a value of ∼2 × 10⁻⁴. Similarly to the OPR of H2, this freeze-out occurs at low density when the hydrogen recombination time becomes longer than the Hubble time. The Recfast++ calculation shows that both He and H recombinations are significantly delayed with respect to our calculation, due to additional specific processes (Glover et al. 2014). At redshifts where molecular abundances become significant (z ≲ 500, see below); however, our electron fraction closely approaches the Recfast++ curve. This shows that our simple case-B treatment of hydrogen recombination is adequate for the present application.
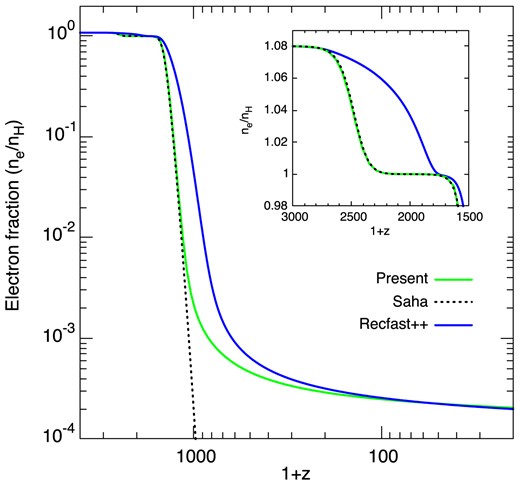
Electron fraction as function of the redshift. The inset zooms into the region of He recombination.
The recombination of H and He also produces a non-thermal photon excess in the Wien tail of the CMB. These photons can enhance the photodestruction of atoms and molecules and such effects were investigated by Hirata & Padmanabhan (2006) and Coppola et al. (2013) in the case of the H− photodetachement and H|$_2^+$| photodissociation processes. Coppola et al. (2013) found the abundances of H−, H2, and HD to be reduced (by a factor of ∼3) for z < 100, compared to models where the non-thermal photons are neglected. However, calculations of z-dependent non-thermal spectral features, and their overlap with photodestruction cross-sections, are complex and significant only for z < 100. Accordingly, and following W18, with whom we compare results, we also neglected these ‘distortion’ photons.
4.2 Atomic and molecular abundances
In Fig. 13 are plotted the fractional abundances, n(X)/nH, where nH = n(H) + 2n(H2) + n(HD) + n(H+), of significant species, X. Our results are broadly in agreement with those of W18, with the exceptions of HeH+ whose abundance continues to grow at z ≲ 300 and approaches freeze-out only at redshifts z < 20 (see below). A similar increase of the HeH+ fractional abundance can be observed in fig. 2 of Galli & Palla (2013) and figs 6 and 7 of Courtney et al. (2021), presumably because of similar formation and destruction rates. In order to test the impact of the destruction rate of HeH+ by H, we have additionally run our chemistry with the Langevin rate constant (kL = 2.09 × 10⁻⁹) for reaction He5), instead of the rate coefficient computed by Esposito et al. (2015). In this case, the HeH+ abundance (dashed line in Fig. 13) is almost constant and close to 10−15 at redshifts z < 300. The impact on the other abundances is, however, negigible. It should be noted that the dissociative recombination (DR) of HeH+ with electrons is neglected in our network, as in the minimal network of GP98. We have checked that including the recent experimental rate coefficient from Novotný et al. (2019) for the DR of HeH+ does not decrease significantly the HeH+ abundance, except at redshifts z ≲ 15. We stress that, because the temperature dependence of the thermal rate coefficient (Novotný et al. 2019, see their fig. 4) is poorly fitted with a modified-Arrhenius form, special care is required and a specific fit is recommended for this reaction (see Appendix B). We also note that the state-specific measurements of Novotný et al. (2019) were nicely reproduced by the calculations of Čurík, Hvizdoš & Greene (2020), confirming the non-monotonic low-temperature behaviour of the DR rate coefficient.
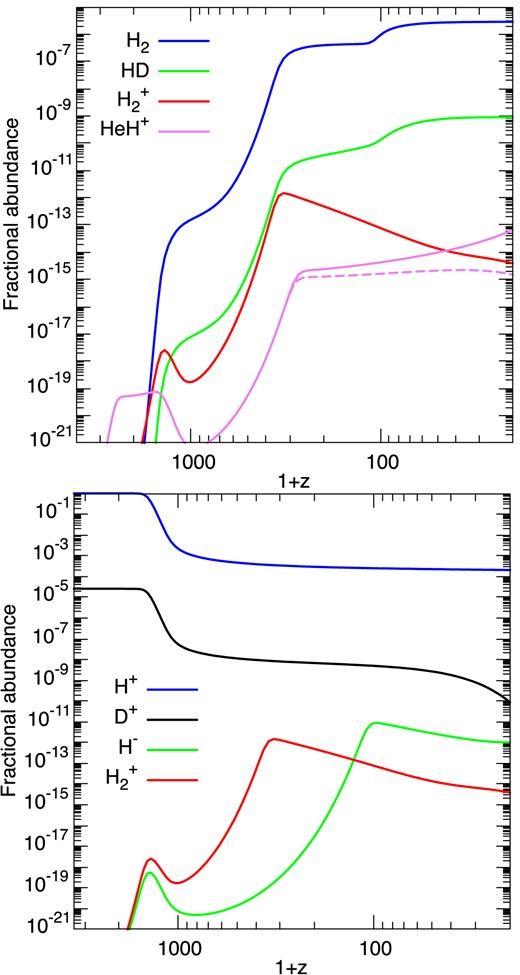
The fractional abundances, n(X)/nH, of significant atomic and molecular species, X, computed as functions of the redshift, z. The violet dashed line in the upper panel shows the HeH+ abundance when the Langevin rate constant is used for the destruction of HeH+ by H (reaction He5).
Similarly, we have tested the impact of the DR of H|$_2^+$|, which is also neglected in our network. Using the theoretical thermal rate coefficient of Epée Epée et al. (2016), we have found that this reaction (with again a strongly non-monotonic temperature dependence) has a negligible impact on the H|$_2^+$| abundance at redshifts z ≥ 20. We have also checked that our poor fit for reaction H7) (radiative association of H and H+) below 50 K has only a moderate impact (less than a factor of 2) on the H|$_2^+$| abundance, provided that z ≥ 20. The strong decrease of H|$_2^+$| is thus due to the charge exchange reaction with H (reaction H9), which forms H2 at redshifts z > 100. We can also observe in the lower panel of Fig. 13 that the peak of the H|$_2^+$| abundance is followed by a peak of the H− abundance, which corresponds to the final jump in the abundance of H2.
Finally, we tested the impact of the reaction HD + H → H2 + D and its reverse reaction H2 + D → HD + H, also ignored in our network. The rate coefficients were taken from the quantum study of Desrousseaux, Coppola & Lique (2022) and the experimental evaluation of Michael, Su & Sutherland (2004), respectively, and the two reactions were found to be negligible except at redshifts 400 < z < 1300 where the HD abundance was reduced by up to a factor of 3 at z ∼ 1000.
In general, the impact of our revised chemistry is found to be modest with respect to previous models, especially for the H2 and HD abundances, suggesting that the rate coefficients for the major formation and destruction chemical routes in the (homogeneous) early Universe have converged and reached a sufficient level of accuracy and precision. The largest remaining uncertainty likely concerns the charge exchange between H|$_2^+$| and H (reaction H9), the reverse process (reaction H10).
4.3 H2 and HD populations
The level populations of HD and H2 are shown at a redshift z = 295 in Fig. 14. As is evident from the left-hand panel, the populations of the levels of H2 up to at least 104 K (0.86 eV) above the ground level are thermalized at the background radiation temperature Tr = 792 K. This disagrees with fig. 15 of W18,5 who find that the low-energy levels are thermalized by the CMB, although with populations that are about six orders of magnitude below their expected values. In contrast, high-energy levels have the values expected in equilibrium. Coppola et al. (2011) have shown that, at low z, the vibrational level populations of H2 are determined by a balance between radiative, formation and destruction rates. Under these circumstances, the level populations become dependent on assumptions regarding the state-specificity of the reactive processes. However, the attribution of the six-orders-of-magnitude shift between the low- and high-energy level populations to some memory of the formation mechanism seems improbable (see below). Indeed, we have tested the impact of chemical pumping on the level populations of H2 by using a simple steady-state model of excitation, including all 302 bound levels of H2 i.e. up to v=14, j=4. Simple but physical prescriptions (based on enthalpy change) were used for the formation and destruction rates and strong deviations from LTE were found for highly excited and weakly populated levels of H2 (those lying more than ∼30 000 K above the ground state). However, all lower levels were found to be accurately thermalized at the CMB temperature, indicating that highly excited levels have no influence on the low-lying levels investigated here. Finally, it should be noted that non-Boltzmann level populations in H|$_2^+$| and H2 were also found by Hirata & Padmanabhan (2006) and Alizadeh & Hirata (2011), respectively. However, in both studies, spectral distortions to the CMB were included so that it is difficult to disentangle the roles of reactive and radiative processes.
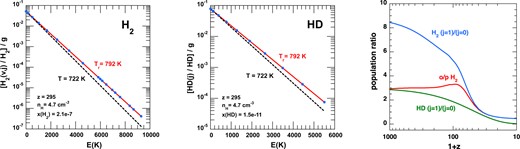
Left and middle: Boltzmann plots of the normalized populations, ni/n(X), of the energy levels i of X = H2 and X = HD, divided by their statistical weights, gi, at z = 295 (T = 722 K, T r = 792 K), as functions of their excitation energies, Ei. The red and black dashed lines are the LTE solutions at T = 722 K and Tr = 792 K, respectively. Right: The values of the OPR of H2 ratio, and the ratios of the populations of the two lowest rotational levels of H2 and HD, computed as functions of the redshift, z.
In the case of HD, our calculations show that the level populations are also thermalized with the radiation field (Fig. 14, middle panel). This is in disagreement with the results of W18 (their fig. 14) in which the population of some rovibrational levels are underpopulated relative to a Boltzmann distribution This situation could arise only through the intervention of inelastic or reactive collision processes. However, the rates for radiative, inelastic (with H, the main collider), and reactive collisions are, respectively, of the order of 10−7|$\, \text{s}^{-1}$| (and up to 10−5|$\, \text{s}^{-1}$|), |$\lt {\, \rm 10^{-9}}$||$\, \text{s}^{-1}$| (at z = 295), and <10−11|$\, \text{s}^{-1}$| (see Fig. B1 and Appendix B). The HD reaction rates are even slower in W18 with rates below 10−13|$\, \text{s}^{-1}$| at z = 300 (their figs 8, 9, and 11, together with their equation (4) for nH(z)). On this basis, radiative transitions are the fastest and one expects the HD level populations to be thermalized at the temperature of the black-body radiation field, which is exactly the result of our own calculations.
For H2 in its ground vibrational state, the corresponding rates of intra-para or intra-ortho radiative, inelastic collisions (with H or He), and reactive collisions are >10−11|$\, \text{s}^{-1}$| (and up to 10−6|$\, \text{s}^{-1}$|), <10−12|$\, \text{s}^{-1}$| (at z = 295), and <10−13|$\, \text{s}^{-1}$| (see Fig. B1 and Appendix B). Thus, in the case of the ground vibrational state of H2, one also expects the populations of the para or ortho levels to be thermalized at the temperature of the black-body radiation field (the ortho:para ratio is considered in the following Section).
We note that higher rovibrational levels of HD and H2 tend to be even more dominated by radiative processes, in view of the ν3 (dipole) or ν5 (quadrupole) frequency-dependence of the A values. Furthermore, any memory of state-specific formation processes would be very short, compared with the time-scale for destruction processes and adiabatic expansion, except for highly excited and weakly populated levels where the destruction rates exceed the radiative rates (Coppola et al. 2011).
4.4 Ortho:para freeze-out
While the level populations of H2 are thermalized with the radiation field at z = 295, this is no longer the case at lower redshifts when Pop III progenitors form because the expansion time-scale becomes smaller that for ortho:para conversion reactions. The dynamical (cosmic expansion) term in equation (6) can be ignored only if the associated time-scale, τexp ∼ 1/3H(t), is significantly longer than the time-scale to reach a chemical and level population steady-state. In the case of H2, the radiative lifetime of the lowest ortho-level (v = 0, j = 1), which decays to the lowest para-level (v = 0, j = 0), exceeds the age of the Universe by about three orders of magnitude. Therefore, the ortho:para conversion proceeds exclusively through proton exchange which is dominated by reactive collisions with H+ (see Fig. 13) at redshifts below z ≈ few 100. The associated timescale is τop ∼ 1/(kopn(H+)) ∼4000/(1 + z)3 Gyr, where a fractional abundance n(H+|$)/n_{{\rm H}}= 2{\, \times 10^{-4}}$| was adopted and |$k_\text{op}\sim 2{\, \times 10^{-10}}\, \text{cm}^{3}\, \text{s}^{-1}$| from González-Lezana et al. (2022). Both the ortho:para conversion and the expansion time-scales increase with time from the big bang, but as the density of the gas decreases, owing to its expansion, τop comes to exceed τexp at z ≈ 50. The only levels of H2 which then retain a significant population are v = 0, j = 1, and v = 0, j = 0, and hence the OPR ‘freezes-out’ at the corresponding value of n(v = 0, j = 1)/n(v = 0, j = 0).
This is illustrated in Fig. 14 (right-hand panel) which compares the OPR of H2 with the n(v = 0, j = 1)/n(v = 0, j = 0 population ratio. It may be seen that the latter is close to its high temperature statistical value of 9 at high z, well above the actual OPR (≈3) and that the two ratios converge to the same value of ≈0.4 for z ≲ 50. In chemical steady state, on the other hand, the ortho:para ratio tends towards zero, as in fig. 19 of W18, because there is no restriction on the time available for transfer of population from v = 0, j = 1 to v = 0, j = 0. Similar considerations apply to H|$_2^+$|, which, like H2, displays the ortho–para (nuclear spin) dichotomy. We note that the dynamical time calculated from equations (7)–(9) exceeds that calculated by Flower et al. (2021), who used equation (2) of FP00, resulting in delayed freeze-out and hence a lower value of the ortho:para ratio.
In contrast to H2, the expansion does not determine the relative populations of the two lowest rotational levels of HD (see Fig. 14) as the time-scale for population transfer always remains below the dynamical time-scale.
5 CONCLUDING REMARKS
We have studied the chemistry during the adiabatic expansion of the primordial gas, using the results of our determinations of the rate coefficients for atomic and molecular reactions and recent values of the relevant cosmological parameters. The molecular abundances, especially those of H2 and HD, were found in good agreement with previous studies, suggesting that the dominant (thermal) reaction rate coefficients have now reached such an accuracy that they are no longer a limiting factor. Two important reactions that need further investigations are the charge exchange process between H|$_2^+$| and H and its reverse reaction. In particular, the state-to-state (rovibrationally resolved) reaction dynamics of these two reactions should be investigated in order to revisit the rovibrational chemistry of H|$_2^+$|, H2, and HD and re-examine deviations from Boltzmann distributions.
On the other hand, significant differences were found with the results of a detailed study by W18, particularly with regard to the variations with redshift, z, of the populations of the energy levels of H2 and HD. At redshifts larger than ≈100, we find the rovibrational levels population to be thermalized at the temperature of the cosmic background radiation field, whereas W18 found large deviations from thermal equilibrium. The reason for the discrepancy is unclear. Furthermore, our calculations show that, at z below ≈50, expansion has a significant effect on the OPR of H2, an aspect which was overlooked in W18.
While the chemical conditions during the adiabatic contraction that occurs in the initial phase of collapse have negligible impact on the thermodynamics of the gas (Omukai 2000; Flower & Pineau des Forêts 2001), this is no longer the case when molecular cooling dominates over compression work. Then, cooling by H2 is expected to depend on the OPR of H2 and the present calculations demonstrate the need for self-consistent calculations of the level populations and chemical abundances (including ortho:para conversion), taking into account the dynamics of the gas. A more complete network (including e.g. the three-body H2 formation) appropriate to the high-density reached during the collapse towards Pop III stars will be published in a future work. In this context, we finally note that the first application of our network to simulations of early structure formation, but restricted to densities lower than ∼105 cm−3, was published very recently by Lenoble et al. (2024).
ACKNOWLEDGEMENTS
We thank M. Gontel for his work on the early stages of the chemical network, and we acknowledge F. Lique and the financial support from the European Research Council (Consolidator Grant COLLEXISM, Grant Agreement No. 811363). M. Zammit is acknowledged for recalculating state-resolved cross-sections for the radiative association of H and H+ and the photodissociation of H|$_2^+$|. We thank I. Schneider and N. Pop for sending us the thermal rate coefficient for the dissociative recombination of H|$_2^+$|. We are grateful to A. Larson for providing cross-sections for the mutual neutralization of H− and H+. We also thank D. Galli for sharing unpublished H and He-recombination spectrum data and B. Desrousseaux for providing the thermal rate coefficient for HD + H. B. Commerçon, T. González-Lezana, R. Lenoble, J. Loreau, O. Roncero, J. Rosdahl, Y. Scribano, and X. Urbain are finally acknowledged for useful discussions. DRF acknowledges the provision of local computing resources.
DATA AVAILABILITY
The data generated by this study are available on request to the corresponding author.
Footnotes
It should be noted that kI(T) and the case-B rate coefficient of reaction H1) do not obey detailed balance.
The theoretical data of Courtney et al. (2021) were digitalized from their fig. 1.
This code is available at http://www.Chluba.de/CosmoRec.
Owing to the parameters adopted in the numerical integration, z = 295 was our nearest output point to z = 300; this difference is not significant in the context of the present comparison. Note also that we plot normalized populations, ni/n(X), while fractional abundances (relative to nH) are shown in Figs 14 and 15 of W18.
Walker et al. (2018) plot, in their fig. 7 for example, the rates (s−1) of formation and destruction reactions.
Although not apparent on the scale of Fig. B1, the rate of destruction of H|$_2^+$| exceeds its rate of formation at low values of z.
References
APPENDIX A: DETAILED BALANCE AND SAHA EQUILIBRIUM
For a general photoionization reaction Xi + ν → Xi + 1 + e−, the detailed balance relation at full thermal equilibrium, i.e. when the heavy-particle, electron, and radiation temperatures are all equal (Tk = Te = Tr = T) can be written as
where kR(T) is the recombination (or radiative attachment) rate coefficient, gi is the statistical weigth of atoms in the ith state of ionization, kB is the Boltzmann constant, and χ is the ionization potential (in Kelvin) from ionization state i to i + 1. The right-hand side of equation (A1) is the Saha ratio of populations (ni + 1ne/ni) i.e. the Saha equilibrium solution. It should be noticed that equation (A1) involves both spontaneous and stimulated (Xi + 1 + e− + νb →Xi + ν + νb) radiative processes.
APPENDIX B: CHEMICAL AND DYNAMICAL TIMESCALES
Referring to equations (6) and (7) of the main text, the significance of the dynamical (adiabatic expansion) term, relative to chemical formation or destruction, may be assessed by comparing the magnitudes of the rates on the rhs of equation (6). In Fig. B1, we plot corresponding dynamical time-scale, 1/[3H(t)], with the chemical time-scales, given by the rate per unit volume of a formation or destruction reaction, divided by the species number density.6 Note that we have added in the lower panels of Fig. B1 the chemical times scales for the DR of H|$_2^+$| and HeH+, two destruction reactions not included in our network (see our discussion in Section 4.2). The rate coefficients were fitted using the modified-Arrhenius form over specific temperature ranges (T = 1–2000 K for H|$_2^+$| and T = 1–100 K for HeH+) with parameters α = 9.00 × 10⁻⁹ cm3 s−1, β = −1.00, γ = −3.49 K for H|$_2^+$| and α = 9.87 × 10⁻¹⁰ cm3 s−1, β = −0.352, γ = 0 K for HeH+, respectively, based on the measurements of Novotný et al. (2019) and the calculations of Epée Epée et al. (2016).
![A comparison of the time-scales for formation (in blue) and destruction (in red) of the indicated molecular species, computed as functions of the redshift, z, and compared with the dynamical time-scale for adiabatic expansion, 1/[3H(t)]; see text, Section 4.](https://oup.silverchair-cdn.com/oup/backfile/Content_public/Journal/mnras/531/1/10.1093_mnras_stae994/1/m_stae994figb1.jpeg?Expires=1750225414&Signature=z11hAOR~SaFuPmr8ahnc4pgdstEVixpe7d62en~f6Psi8m-u1zgw6VkRGqXF3Bhh-ZCsPFjlLx3I8XM39gEjtuFH~vf0CgJm9kYr2o5JGcL6qtEQKBrMKZ-AztvyuvqWeqrv0o80IamcLE6tO9vuL7BWHAFz~NutZD7Wz0TM4NY3xh7wnJiDZcD-UrGofZYCjQD5xkA3hHdK6RxrPOfbQo8pjUSujq1TS8XWvi92cWfySCkccTjNrsMTdPQzMVm6-2pkdbEY~q77GIyj-zsmm2xCEA5IvzbS2H1-2lQrc1QTmJmp5e3qoleBbkMc3yZLOyjR3y-bIvyxIPFMaRI85Q__&Key-Pair-Id=APKAIE5G5CRDK6RD3PGA)
A comparison of the time-scales for formation (in blue) and destruction (in red) of the indicated molecular species, computed as functions of the redshift, z, and compared with the dynamical time-scale for adiabatic expansion, 1/[3H(t)]; see text, Section 4.
As may be seen from the lower-left panel of Fig. B1, in the case of H|$_2^+$| the time-scales of reactions H7) (formation) and H9) (destruction) remain shorter than the dynamical time-scale up to z = 20 (and below), and the fractional abundance of H|$_2^+$| continues to decrease7, as shown in Fig. 13. A similar results is observed in the lower-right panel of Fig. B1 for HeH+, although we note in this case that the time-scales of chemical reactions that both form and destroy HeH+ become greater than the dynamical time-scale for z ≲ 10 (not plotted), where its fractional abundance freezes out with a fractional abundance of ∼10−14. We can also notice that the DR time-scale for both H|$_2^+$| and HeH+ is substantially greater than the time-scale for destruction by H over the entire range of Fig. B1, in agreement with our discussion in Section 4.2. In the case of H2 and HD (upper panels in Fig. B1), the time-scales of the formation reactions become greater than the dynamical time-scale for z ≲ 100, where their fractional abundances are indeed shown to freeze out in Fig. 13.
