


ABSTRACT
We present the first internally consistent set of [Fe/H] values for 14 of the 15 old globular clusters in the Large Magellanic Cloud (LMC). We make use of periods and amplitudes of fundamental mode (ab-type) RR Lyrae stars in the vicinity of these LMC clusters, mostly taken from the Optical Gravitational Lensing Experiment (OGLE) data base, in order to calculate metallicities for the clusters. Our data set contains a total of 417 ab-type cluster RR Lyrae stars (289 from OGLE and the rest from the literature) and yields a set of homogeneous metallicities for 14 old LMC globular clusters all on the Zinn and West scale. No previously published work contains metallicities for as many of the old LMC globular clusters as presented herein. An analysis of a subset of our abundances compared with seven other metallicity studies in the peer-reviewed literature indicates very little overall agreement between these [Fe/H] values suggesting that significantly more effort needs to be devoted to measuring internally consistent [Fe/H]s for the old LMC globular clusters.
1 INTRODUCTION
The age–metallicity relation (AMR) of the star clusters in the Large Magellanic Cloud (LMC) has been the focus of numerous studies over the past three decades (e.g. Da Costa 1991; Geisler et al. 1997; Sarajedini 1998; Narloch et al. 2022). The form and shape of this relation is one window into the star formation and chemical enrichment history of the LMC. After decades of studying the AMR and debating the existence of the “LMC age gap” (Narloch et al. 2022, and references therein), one feature of the AMR has remained largely unchanged – that there are a significant number of old (Age > ≈ 10 Gyr) star clusters that are members of the LMC with ages and metallicities akin to the halo globular clusters in the Milky Way. The exact number of such clusters has varied from 8 (Da Costa 1991) to 15 known today. Table 1 lists 14 of these clusters – the ones that are known to contain RR Lyrae variables. The cluster Hodge 11, which is also old and metal-poor, is the 15th one but does not appear to harbor RR Lyraes stars (Walker 1993b; see also Section 2 below).
LMC globular cluster RR Lyrae metallicities.
| Cluster Name | N(RRab) | 〈Period(RRab)〉 | [Fe/H] | [Fe/H] | 〈[Fe/H]〉 | RR Lyrae rference |
|---|---|---|---|---|---|---|
| (d) | (S06) | (A00) | (weighted) | |||
| NGC 1466 | 21 | 0.587 | −1.60 ± 0.07 | −1.59 ± 0.06 | −1.59 ± 0.05 | Walker (1992a) |
| NGC 1466 | 18 | 0.602 | −1.68 ± 0.09 | −1.71 ± 0.05 | −1.70 ± 0.04 | Kuehn et al. (2011) |
| NGC 1466 | 44 | 0.578 | −1.55 ± 0.05 | −1.55 ± 0.07 | −1.55 ± 0.04 | Soszyński et al. (2016) |
| Reticulum | 20 | 0.559 | −1.44 ± 0.07 | −1.48 ± 0.05 | −1.46 ± 0.04 | Walker (1992b) |
| Reticulum | 18 | 0.552 | −1.40 ± 0.08 | −1.59 ± 0.03 | −1.56 ± 0.03 | Kuehn et al. (2013) |
| NGC 1754 | 18 | 0.580 | −1.55 ± 0.12 | −1.26 ± 0.12 | −1.46 ± 0.08 | Soszyński et al. (2016) |
| NGC 1786 | 13 | 0.610 | −1.76 ± 0.13 | −1.45 ± 0.17 | −1.65 ± 0.10 | Kuehn et al. (2012) |
| NGC 1786 | 25 | 0.598 | −1.65 ± 0.10 | −1.27 ± 0.12 | −1.49 ± 0.08 | Soszyński et al. (2016) |
| NGC 1835 | 14 | 0.600 | −1.67 ± 0.12 | −1.77 ± 0.13 | −1.72 ± 0.09 | Walker (1993a) |
| NGC 1835 | 68 | 0.603 | −1.68 ± 0.06 | −1.58 ± 0.08 | −1.64 ± 0.05 | Soszyński et al. (2016) |
| NGC 1841 | 13 | 0.679 | −2.11 ± 0.07 | −2.09 ± 0.07 | −2.10 ± 0.05 | Walker (1990) |
| NGC 1898 | 25 | 0.577 | −1.55 ± 0.07 | −1.40 ± 0.09 | −1.49 ± 0.06 | Soszyński et al. (2016) |
| NGC 1916 | 6 | 0.715 | −2.27 ± 0.17 | −1.91 ± 0.29 | −2.17 ± 0.15 | Soszyński et al. (2016) |
| NGC 1928 | 6 | 0.634 | −1.84 ± 0.24 | −1.82 ± 0.20 | −1.83 ± 0.15 | Soszyński et al. (2016) |
| NGC 1939 | 15 | 0.576 | −1.54 ± 0.09 | −1.64 ± 0.10 | −1.58 ± 0.07 | Soszyński et al. (2016) |
| NGC 2005 | 7 | 0.649 | −1.91 ± 0.23 | −1.83 ± 0.18 | −1.86 ± 0.14 | Soszyński et al. (2016) |
| NGC 2019 | 31 | 0.613 | −1.73 ± 0.09 | −1.71 ± 0.11 | −1.72 ± 0.07 | Soszyński et al. (2016) |
| NGC 2210 | 27 | 0.620 | −1.79 ± 0.07 | −1.93 ± 0.11 | −1.83 ± 0.06 | Soszyński et al. (2016) |
| NGC 2257 | 11 | 0.594 | −1.63 ± 0.14 | −1.86 ± 0.08 | −1.80 ± 0.07 | Walker (1989) |
| NGC 2257 | 17 | 0.607 | −1.70 ± 0.12 | −1.94 ± 0.06 | −1.89 ± 0.05 | Soszyński et al. (2016) |
RR Lyrae (RRL) stars are pulsating variables located at the intersection of the instability strip and the horizontal branch (HB) phase of evolution. The two most prevalent types of RRL are the ab-type (also known as RR0) which pulsate in the fundamental mode and exhibit sawtooth shaped light curves and the c-type (also known as RR1) which pulsate in the first overtone and exhibit light curves that are sinusoidal in shape. Their utility in revealing the properties of their parent stellar population has been demonstrated in the literature (e.g. Catelan 2004; Sarajedini 2011).
One of the ways in which ab-type RRL are useful is as a proxy for the mean metallicity of the old component of their parent population. The determination of RR Lyrae metallicities using the properties of their light curves has a long history in the astronomical literature. The essential phenomenon here involves the correlation between period and metallicity, also known as the Oosterhoff (1939) effect, illustrated in the Bailey Diagram, which is a plot of RR Lyrae light-curve amplitudes as a function of their periods (Sandage 2004).
Alcock et al. (2000) quantified this correlation using observations of ab-type RRL in the LMC from the MACHO project. They used the Bailey diagram to derive a relationship between the [Fe/H] of the ab-type RR Lyraes and their periods and V-band amplitudes. Equation (1) below shows this relationship. Similarly, Sarajedini et al. (2006) derived an equation that quantifies the relationship between RRL metallicity and period without needing to know the light-curve amplitude because their Hubble Space Telescope Advanced Camera for Surveys archival observations of two fields in M33 revealed RRL variables whose periods were significantly better determined than their amplitudes. Therefore, Sarajedini et al. (2006) formulated such an relation using observations of 132 Galactic RRL stars from Layden (2005, private communication). The resultant relationship is given in equation (2) below.
Recent work by Sarajedini & Gokmen (2023) demonstrates that the equations derived by Alcock et al. (2000) and Sarajedini et al. (2006) that use ab-type RRL periods and amplitudes to calculate the [Fe/H]s of Galactic globular clusters yield values that are within ±0.28 dex of their spectroscopic values. Furthermore, the Alcock et al. (2000) relation which uses both the period and amplitude of pulsation is no more accurate or any more precise than the Sarajedini et al. (2006) relation, which uses only the period. Sarajedini & Gokmen (2023) also confirm the validity of the Alcock et al. (2000) and Sarajedini et al. (2006) relations by comparing their predictions with the latest field star RRL metallicities presented by Crestani et al. (2021) and find no statistically significant difference between the predictions of the Alcock et al. (2000) and Sarajedini et al. (2006) relations and these measured metallicities.
With these empirical results as a foundation and the existence of a vast data base of LMC RR Lyrae variables in the peer-reviewed literature most of which is provided by the Optical Gravitational Lensing Experiment (OGLE; Soszyński et al. 2016), we have an opportunity to establish the first internally consistent system of [Fe/H] values for 14 of the 15 old globular clusters in the LMC. That is the primary aim of this work, which is organized as follows. The details of the observations for each cluster are described in the next section. Our primary results, which consist of [Fe/H] values for each cluster in our sample, are presented in Section 3 while Section 4 compares our values with previous studies which each include a subset of the old LMC globular clusters. Our conclusions are summarized in the last section.
2 OBSERVATIONS
In this study, we are primarily interested in the 14 old globular clusters in the LMC that harbour RR Lyrae variables. Fig. 1 illustrates their locations on the sky and in relation to the main body of the LMC. The red points in this figure indicate the clusters that are coincident or located close to the LMC bar, which is the most crowded and reddened (both directly and differentially) portion of the galaxy.
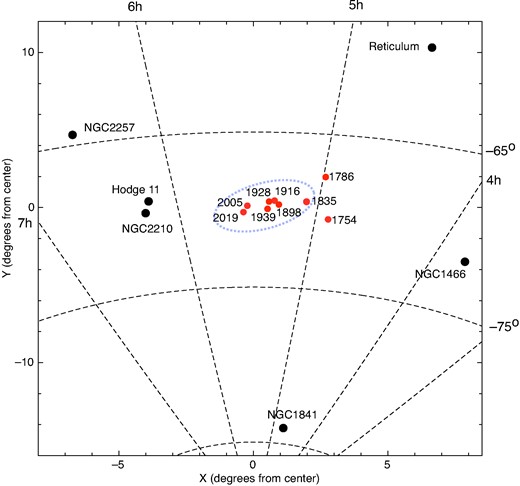
On-sky distribution of the old star clusters in the Large Magellanic Cloud. The dashed oval is the approximate location of the LMC bar. The red points represent the clusters located close to the LMC bar.
2.1 Data base of RR Lyrae variables
The vast majority of the observations of fundamental mode (ab-type) RR Lyrae stars used in the present study originate from the OGLE database (Soszyński et al. 2016), which contains a total of 45,451 RR Lyrae stars, of which 39,082 are in the direction of the Large Magellanic Cloud. The online search tool was used to query the database for variable stars. 1 A radius of 60 arcmin was used to extract RRab (fundamental mode) and RRc (first overtone) stars centered on each cluster listed in Table 1 as well as the cluster Hodge 11. This rather expansive choice of extraction radius helped us to determine the probable cluster membership of the RRLs based on their proximity from the centre of each cluster and their location in the Bailey Diagram. Soszyński et al. (2016) examined the number of RRL within each clusters’ radius as measured by Bica et al. (2008) – typically between ≈1 and ≈4 arcmin; they compared this number of probable cluster RRL with the number of probable field RRL stars. They concluded that only in the cases of NGC 1928 and NGC 1939 is there a chance that the RRL variables within the cluster radius are significantly contaminated by field RRLs.
Two LMC clusters in Table 1 are not within the OGLE footprint – Reticulum and NGC 1841. For these two objects, we rely upon other published sources for their RRL samples. Fig. 2 through 15 present the Bailey Diagrams for each cluster in Table 1 as well as that for Hodge 11 to show that it likely does not contain RR Lyraes as claimed by Walker (1993b). As we examined the appearance of the Bailey Diagrams in each radial zone and compared them with published RRL populations for the clusters with such data (see below), we concluded that the samples within 1 arcmin of each cluster centre are dominated by cluster members and these were used in the subsequent analysis to be representative of the cluster RRLs. There is one exception to this and that is NGC 1939, where there are only two ab-type RR Lyrae variables in the OGLE data base located within 1 arcmin of the cluster. In this case, we analysed the properties of RRLs inside 3 arcmin.
![The Bailey diagram for the RR Lyrae variables in the vicinity of NGC 1466 from the OGLE survey (Soszyński et al. 2016) in radial zones as indicated in each panel. The upper left panel also shows the RR Lyraes from the work of Walker (1992a) and Kuehn et al. (2011). In each panel, the dashed line represents the Alcock et al. (2000) relation for [Fe/H] = −2.0 while the dotted line is the relation for [Fe/H] = −1.0. In general, the ab-type variables exhibit log P > −0.35 while the c-types show log P < −0.35.](https://oup.silverchair-cdn.com/oup/backfile/Content_public/Journal/mnras/529/4/10.1093_mnras_stae752/1/m_stae752fig2.jpeg?Expires=1750309944&Signature=BboDEJsu~LXmunSgeUbyZfly-xlggcj~meDJ6a8pXNWoOrQ~XEJ4BR28KQFkGLHE2O9vIAz5Aqn02oyme2ggz8IWisNF2cYWwcYZWU5z6luAiytd-geesaNDxW5-J~2rb4mOyYbFJBvtHy-Um9lCdWCcbuEeUDwAEFm-ZRWPQlQe1jVOuuFrlqxLe5ikXgat3AjRI5GlNeD4PVHK6hanCsVMrwNXRlvI6rDdbWx~R6X7nARJR4jWHZLtR6gvpfBJl2OTLqFvLEB2wCSIYNP68lRkBY80Cr7JnDffVtH4WoUbYV9WtIr~lFYazQaMDHWQp5jBKAz1dVSMATZ7WLA28g__&Key-Pair-Id=APKAIE5G5CRDK6RD3PGA)
The Bailey diagram for the RR Lyrae variables in the vicinity of NGC 1466 from the OGLE survey (Soszyński et al. 2016) in radial zones as indicated in each panel. The upper left panel also shows the RR Lyraes from the work of Walker (1992a) and Kuehn et al. (2011). In each panel, the dashed line represents the Alcock et al. (2000) relation for [Fe/H] = −2.0 while the dotted line is the relation for [Fe/H] = −1.0. In general, the ab-type variables exhibit log P > −0.35 while the c-types show log P < −0.35.
2.2 Details of the cluster samples
In this section, we discuss previous studies focused on the RRL population of the clusters in our sample. It should be noted that there are no previously published samples of RRL in NGC 1754, 1898, 1916, 1928, 1939, 2005, nor NGC 2019. Our purpose in this section is two-fold. First, we will discuss the RRL samples of two of our clusters, NGC 1841 and Reticulum, that are not included in the OGLE survey footprint, but have been studied by other authors. Second, we aim to discuss other published samples of RRL in each cluster, to the extent that they exist, in order to support our contention that the RRL samples from OGLE within 1 arcmin of each cluster are likely to be dominated by cluster members. As such, the RR Lyrae samples with R < 1 arcmin are representative of the RR Lyrae population of each cluster as a whole. We note in passing that in assembling the RRL data sets for each cluster, we have excluded all variables known or suspected to exhibit the Blazhko effect. Figures 2 to 15 illustrate the relevant Bailey Diagrams for each cluster to be discussed below.
NGC 1466: Walker (1992a) presented 42 RR Lyrae stars in this cluster – 26 ab-type stars and 16 c-types. These are plotted as the filled circles in Fig. 2. Kuehn et al. (2011) also studied the variable star population of this cluster finding 50 RR Lyrae stars, of which 30 are ab-type and 11 are c-type. These are shown as crosses in Fig. 2. The Bailey diagram in the upper left panel of Fig. 2 suggests that the OGLE RR Lyraes within 1 arcmin of NGC 1466 are co-located with the variables identified by Walker (1992a) and Kuehn et al. (2011) as being members of the cluster. This suggests that the majority of RR Lyrae stars within 1 arcmin of the cluster center are likely to be cluster members.
Reticulum (ESO118-G031): As noted above and shown in Fig. 1, this cluster is located well away from the main body of the LMC and is not included in the OGLE survey. As such, we rely upon other sources to investigate its RRL population. Walker (1992b) lists pulsation properties for 30 RR Lyrae variables of which 20 are of the ab-type. Kuehn et al. (2013) measured the properties for 26 RRLs (22 RRab and 4 RRc stars) in their field of view around Reticulum. The right-hand panel of Fig. 3 shows the Bailey diagram of both these sets of stars.
![The Bailey Diagram for the RR Lyrae variables in NGC 1841 from Walker (1990) and Reticulum from Walker (1992b) and Kuehn et al. (2013). In each panel, the dashed line represents the Alcock et al. (2000) relation for [Fe/H] = −2.0 while the dotted line is the relation for [Fe/H] = −1.0. In general, the ab-type variables exhibit log P > −0.35 while the c-types show log P < −0.35.](https://oup.silverchair-cdn.com/oup/backfile/Content_public/Journal/mnras/529/4/10.1093_mnras_stae752/1/m_stae752fig3.jpeg?Expires=1750309944&Signature=s90dE8SHaDjWt-pEAPtBC6MSXyp12FpCSAh6oXwB5Gjei-b1XBuOXi2iCIV3sglyp2lJbaSGw-pl4nPMuTqVKkCGSDXeASNfTEhf74SLgxUygd-jLDe9aPVOGq~eJ6Z0BOONWMooEW4lCnSn010-8g61gkmEbToqfrZm~015iAWhC6M2wWAWr23iorWLAES1I9RZdUbCfU3pT8F9vn7bWIdXRXc-e8GkdwJpMc5wFz8gMDnDOZW76QolX3GyFl9KE3K6saXkju~E~pY6UET5dt0B5MCAsOYYQjO1rFjRsVTNQz8NvQ8aKW7QBXi2GUC41y~I7hehUGWc7RVPRPvC9g__&Key-Pair-Id=APKAIE5G5CRDK6RD3PGA)
The Bailey Diagram for the RR Lyrae variables in NGC 1841 from Walker (1990) and Reticulum from Walker (1992b) and Kuehn et al. (2013). In each panel, the dashed line represents the Alcock et al. (2000) relation for [Fe/H] = −2.0 while the dotted line is the relation for [Fe/H] = −1.0. In general, the ab-type variables exhibit log P > −0.35 while the c-types show log P < −0.35.
NGC 1786: Walker & Mack (1988) were able to derive periods for 10 RR Lyrae stars despite the very crowded star field around this cluster. Of these, 5 appear to be ab-type and the rest of c-type. Kuehn et al. (2012) also studied the variable star population of this cluster finding 53 RR Lyrae stars, of which 27 are ab-type and 18 are c-type. Thirteen of these RRLs with measured periods and amplitudes which are within 1 arcmin of the cluster center are plotted as filled circles in Fig. 5. A substantial fraction of their RRL sample is also in the OGLE data base used here. Fig. 1 indicates that this cluster is not far from the LMC bar suggesting that separating field RR Lyrae stars from those belonging to the cluster is a challenge. However, based on Kuehn et al.’s analysis of the cluster colour–magnitude diagram, the Bailey diagram of the RR Lyraes, and the cluster’s stellar density profile as compared with its surrounding field, they concluded that the majority of RR Lyraes within 1 arcmin of the cluster center are likely to be cluster members (see the finding chart in their Fig. 2).
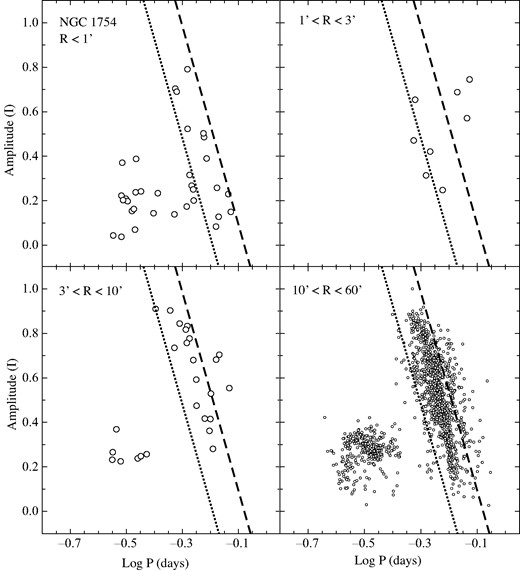
Same as Fig. 2 except that the OGLE RR Lyrae stars in the vicinity of NGC 1754 are plotted.

NGC 1835: Walker (1993a) surveyed a 4.2 arcmin square region centered on the cluster and characterized 36 RR Lyraes variables – 21 ab-type stars and 15 c-types. These stars are plotted as filled circles in the Bailey diagram shown in Fig. 6. As in the case of the other clusters in our sample, it appears that a radius of 1 arcmin encompasses the likely RR Lyrae members of this cluster.

NGC 1841: As noted above and shown in Fig. 1, and similarly to Reticulum, this cluster is located well away from the main body of the LMC and is not included in the OGLE survey. As such, we rely upon other sources to investigate its RRL population. In particular, Walker (1990) presents a sample of 22 RR Lyraes in the cluster - 17 ab-type stars and 5 c-types. The left-hand panel of Fig. 3 shows the Bailey Diagram of these stars. From the finding chart shown in Fig. 1 of Walker (1990), it appears that all of the candidate RRL stars are within ≈1.5 arcmin of the cluster center.
Hodge 11 (SL868): Walker (1993b) presents a detailed discussion of the potential RRL population in this cluster. One candidate variable star was identified located at 168 arcsec from the centre. This is likely to be the one RRL star plotted in the upper right panel of Fig. 13. After consideration of the expected field star density in the vicinity of Hodge 11, Walker (1993b) concludes that this one candidate variable star likely belongs to the field population and not to the cluster.
NGC 2210: Walker (1985) observed nine RR Lyraes within ≈1 arcmin of this cluster for the primary purpose of determining the cluster’s distance. They presented periods for these stars but no light-curve amplitudes. Reid & Freedman (1994) identified ≈27 RR Lyraes in the vicinity of this cluster but only tabulate periods and not amplitudes.
NGC 2257: Walker (1989) identified and characterized 33 cluster RRL variables of which 15 are ab-type and 16 are c-type. Their locations in the Bailey Diagram are shown by the filled circles in the upper left panel of Fig. 15. Nemec, Walker & Jeon (2009) followed up on the work of Walker (1989) finding 43 RR Lyraes – 23 of ab-type and 20 c-type. These are plotted in the upper left panel of Fig. 15 as the crosses. Both the Walker (1989) and Nemec et al. (2009) variables are co-located with the OGLE RRL in the R < 1 arcmin Bailey Diagram.
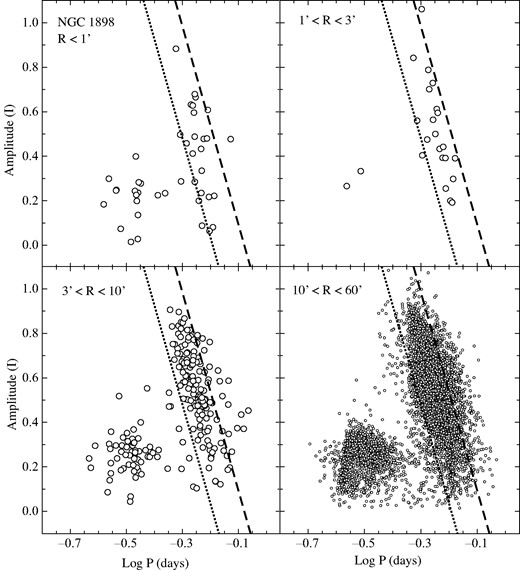
Same as Fig. 2 except that the RR Lyrae stars in the vicinity of NGC 1898 are plotted.
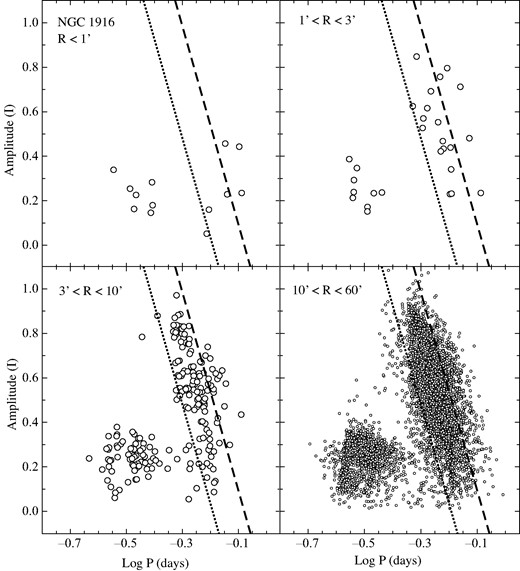
Same as Fig. 2 except that the RR Lyrae stars in the vicinity of NGC 1916 are plotted.
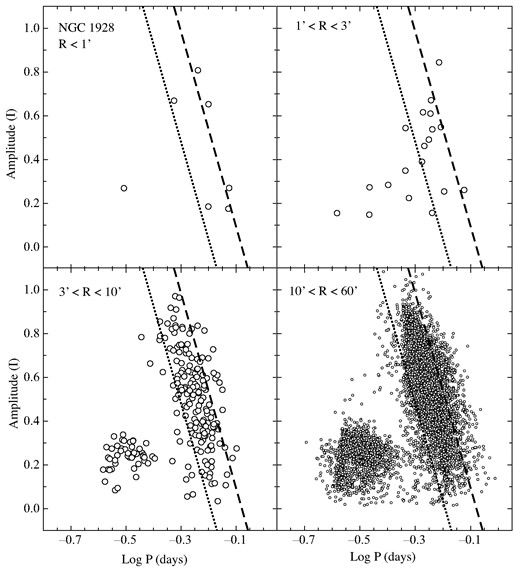
Same as Fig. 2 except that the RR Lyrae stars in the vicinity of NGC 1928 are plotted.
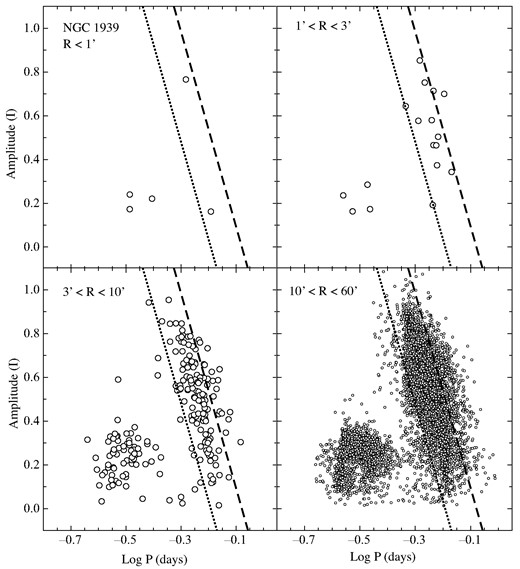
Same as Fig. 2 except that the RR Lyrae stars in the vicinity of NGC 1939 are plotted.

Same as Fig. 2 except that the RR Lyrae stars in the vicinity of NGC 2005 are plotted.
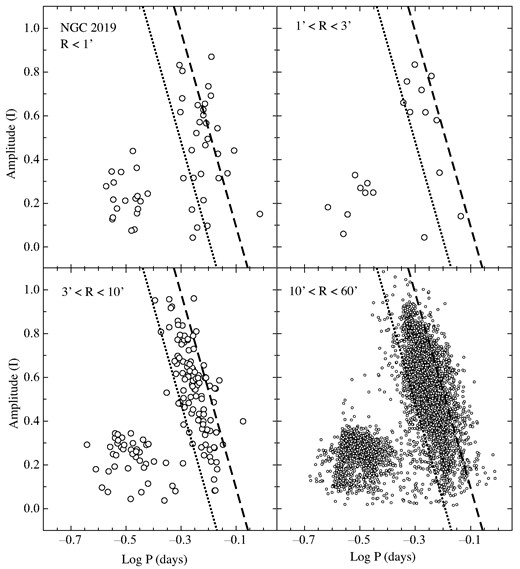
Same as Fig. 2 except that the RR Lyrae stars in the vicinity of NGC 2019 are plotted.

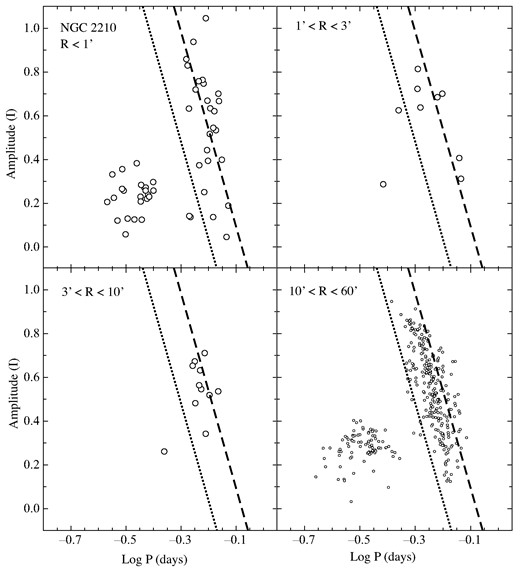
Same as Fig. 2 except that the RR Lyrae stars in the vicinity of NGC 2210 are plotted.

3 RESULTS
Now that we have established the data base of ab-type RR Lyrae stars, we can calculate their mean metallicities using two different equations as presented in Section 1 – both on the Zinn & West (1984) metallicity scale – one from the work of Alcock et al. (2000, hereafter A00):
and the other from the study of Sarajedini et al. (2006, hereafter S06):
where Pab represents the period of an individual ab-type RR Lyrae in days and Amp(V) is its V-band amplitude. The OGLE survey provides I-band amplitudes for the RRLs. As such, we use the relation from Dorfi & Feuchtinger (1999), which allows a conversion of the I-band amplitudes to the V band, i.e. Amp(V) = 0.075 + 1.497 Amp(I).
Focusing now on the OGLE ab-type RRL stars with R < 1 arcmin in each LMC globular cluster (R < 3 arcmin in the case of NGC 1939) and the ab-type RRL in Reticulum from Walker (1992b) and Kuehn et al. (2012) along with those in NGC 1841 from Walker (1990), we can apply the above equations to calculate mean [Fe/H] values for each cluster as tabulated in Table 1. The individual results derived from equations (1) and (2) are listed there as well as the weighted mean of these values. As a reminder, these abundances are all on the Zinn & West (1984) scale and represent a set of homogeneous metallicities for all of the old LMC globular clusters that harbor RR Lyrae variables.
4 DISCUSSION
4.1 Comparisons with previously published metallicities
No previous work presents metallicities for all of the clusters considered herein in a self-consistent manner; however, a subset of the 14 clusters have had their metallicities measured by previous investigators. Notable among these is the work of Narloch et al. (2022) who present [Fe/H] values based on Strömgren photometry of stars in 8 of the 14 clusters in Table 1. These are NGC 1754, 1786, 1835, 1898, 2005, 2019, 2210, and 2257. The Strömgren metallicity calibration used by Narloch et al. (2022) is tied to the Zinn & West (1984) scale, which is the same one used in equations (1) and (2) above. For these 8 clusters, the mean difference (This work – Norloch et al.) is Δ[Fe/H] = −0.34 ± 0.04 (sem). The top panel of Fig. 16 shows the variation of [Fe/H] difference compared with the results of Narloch et al. (2022) as a function of [Fe/H] from the present work. The other panels of Fig. 16 are relevant to the discussion below.
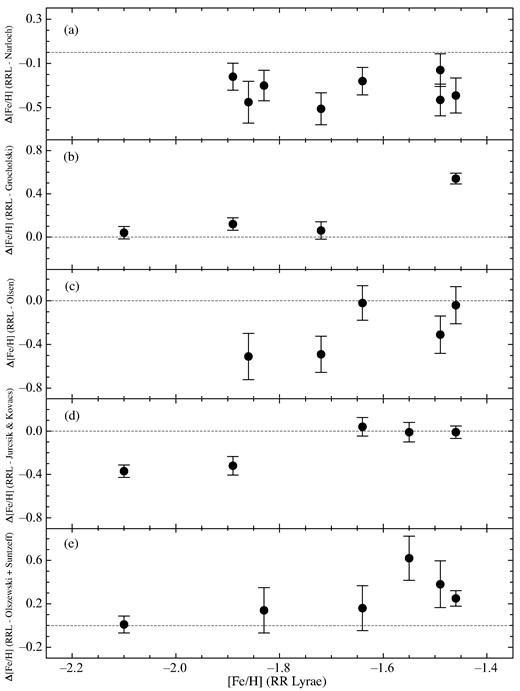
The difference in the individual cluster metal abundances for objects in common between the present study and those of Narloch et al. (2022), Grocholski et al. (2006), Olsen et al. (1998), Jurcsik & Kovács (1996), Olszewski et al. (1991), and Suntzeff et al. (1992) are shown in panels (a), (b), (c), (d), and (e), respectively. The dashed lines show the zero offset level. The mean offsets are given in the text.
Grocholski et al. (2006) use Calcium triplet spectroscopy of giants to measure metallicities for Reticulum, NGC 1841, 2019, and 2257 on the Carretta & Gratton (1997) scale. When converted to the Zinn & West (1984) system, for these 4 clusters, the mean difference (This work – Grocholski et al.) is Δ[Fe/H] = +0.19 ± 0.12 (sem). In this case, it should be noted that, as shown in Fig. 16b), the metallicity differences for NGC 1841, 2019, and 2257 are statistically consistent with zero whereas the difference for Reticulum is significantly greater.
Olsen et al. (1998) presented colour–magnitude diagrams for NGC 1754, 1835, 1898, 2005, and 2019. These clusters are located in or near the very crowded and differentially reddened bar region of the LMC as shown in Fig. 1. Despite these challenges, Olsen et al. were able to apply the red giant branch (RGB) fitting and analysis method of Sarajedini (1994) to determine metallicities for these clusters on the Zinn & West (1984) scale. For these 5 clusters, the mean difference (This work – Olsen et al.) is Δ[Fe/H] = −0.27 ± 0.11 (sem), as shown in Fig. 16c.
Jurcsik & Kovács (1996) performed an analysis similar to the present one in which they used a calibration between RRL [Fe/H] and Fourier light curve shape parameters to calculate metallicities for NGC 1466, Reticulum, NGC 1835, 1841, and 2257. For these 5 clusters, the mean difference (This work – Jurcsik & Kovács) is Δ[Fe/H] = −0.13 ± 0.09 (sem) as illustrated in Fig. 16d. The relatively good agreement here (in the mean) is perhaps not surprising since the technique used by Jurcsik & Kovács (1996) is related to the one we have employed herein.
Olszewski et al. (1991) determine metallicities for NGC 1466, 1786, 1835, and 2210 using giant star spectra at the Calcium triplet calibrated to a number of open and Galactic globular clusters on the Zinn & West (1984) Scale. In a subsequent paper of the series, Suntzeff et al. (1992) also present metallicities for NGC 1841 and Reticulum. For the [Fe/H] values of these 6 clusters, the mean difference (This work – Olszewski et al., Suntzeff et al.) is Δ[Fe/H] = +0.26 ± 0.09 (sem) as shown in Fig. 16e.
Mucciarelli, Origlia & Ferraro (2010) obtained high resolution spectra of a sample of 18 giant stars in NGC 1786, 2210, and 2257. Their resultant [Fe/H] values are quoted on the abundance scale of Carretta et al. (2009, see Wagner-Kaiser et al. 2017). We converted these to the Zinn & West (1984) scale using the equation provided by Carretta et al. (2009) after which we find a mean difference (This work – Muchiarelli et al.) for these 3 clusters of Δ[Fe/H] = +0.42 ± 0.12 (sem). This comparison is not shown graphically in Fig. 16 because only 3 clusters are in common.
Mackey & Gilmore (2004) presented colour–magnitude diagrams for Reticulum, NGC 1928, and NGC 1939. Their analysis of the red giant branch shapes of these clusters yielded reddenings and metallicities via the method of Sarajedini (1994). For these 3 clusters, the mean difference (This work – Mackey & Gilmore 2004) is Δ[Fe/H] = +0.05 ± 0.32 (sem). This is an encouragingly small difference, but it is important to note that while the Mackey & Gilmore (2004) [Fe/H] value for Reticulum differs by only +0.20 ± 0.12 dex from ours, those of NGC 1928 and NGC 1939 differ by –0.56 ± 0.20 and +0.52 ± 0.20 dex, respectively from the [Fe/H] values determined in this work.
A brief examination of Fig. 16 and the results discussed above but not plotted in that figure suggest that while there are no obvious trends with abundance in any of the [Fe/H]-difference plots, there is very little overall agreement between the seven different studies discussed in this section. In other words, they are all systematically different in one direction or the other. As shown in Fig. 17, the scales of Narloch et al. (2022), Olsen et al. (1998), and Jurcsik & Kovács (1996) appear to be in accord, and those of Grocholski et al. (2006), Muchiarelli et al. (2010), Olszewski et al. (1991), and Suntzeff et al. (1992) are also in accord but both sets are offset in opposite directions relative to the metallicities in the present work. The error bar on the Mackey & Gilmore (2004) offset is too large to make a definitive statement with respect to which scale their values agree.
![An illustration showing the mean [Fe/H] difference between those determined in this work and previously published values as labelled in the diagram. The dashed line shows the zero offset level. The mean offsets are given in the text and the error bars are the standard errors of the means.](https://oup.silverchair-cdn.com/oup/backfile/Content_public/Journal/mnras/529/4/10.1093_mnras_stae752/1/m_stae752fig17.jpeg?Expires=1750309944&Signature=r2Rlm40KHRG8kTC0ABIWekbYGjFqnyPEuxafl9Mf3K4PgNPqrLw5yrL1Z-T22Q8XbOKmpjBHLPddjo-G5e7H7e-lX8klB6d-GlLEiMupCz6NWIFtv~4f8bHL4tMVUYuOspVpzQ9JG2Ulv8gAdNLiUAijservfGd0SS3NpR7CqG7tN7soKcQHPXRitXH0su0IS2CN8fL8oQc8B56lxmXj96oW196ljxfRLspIIW7teCqT6qzFtqNLJRXFscRFIX9nIexF1SxZ8tAbOmCbyQE4a5nWfKNFOJ4JZAAw2NDOGvqTDE7-3-KgQSAfz~uo4SOMiVrJ950cmaGGMb45lg6DQA__&Key-Pair-Id=APKAIE5G5CRDK6RD3PGA)
An illustration showing the mean [Fe/H] difference between those determined in this work and previously published values as labelled in the diagram. The dashed line shows the zero offset level. The mean offsets are given in the text and the error bars are the standard errors of the means.
4.2 Comparison with non-OGLE RR Lyrae metallicities
One final check we can apply to our metallicities is to use ab-type RR Lyrae variables from other sources than those in the OGLE survey. As we’ve noted above, four of the clusters in Table 1, NGC 1466 (Walker 1992a; Kuehn et al. 2011), NGC 1786 (Kuehn et al. 2012), NGC 1835 (Walker 1993a), and NGC 2257 (Walker 1989) have non-OGLE samples of published periods and amplitudes for their ab-type RRL stars. For these 4 clusters (from 5 different studies), the mean difference (OGLE – non-OGLE) is Δ[Fe/H] = +0.07 ± 0.05 (sem), which is statistically indistinguishable from zero.
5 CONCLUSIONS
We have assembled a data set of ab-type RR Lyrae stars in the vicinity of the 15 “old” globular clusters in the Large Magellanic Cloud (LMC). Our data set contains a total of 417 ab-type cluster RR Lyrae stars (289 from OGLE and 128 from literature sources). The periods and amplitudes of these stars are used to calculate metallicities based on two empirical relations one from Alcock et al. (2000) and the other based on the work of Sarajedini et al. (2006). This yields a set of homogeneous metallicities for 14 of the 15 old LMC globular clusters all on the Zinn & West (1984) scale. The globular cluster Hodge 11 does not appear to contain any RR Lyrae stars. In cases where our mean cluster metal abundance is based purely on OGLE RR Lyrae measurements, we find good agreement with mean cluster metallicities based on RR Lyrae samples from previously published (i.e. non-OGLE) literature sources. However, we have also compared our mean cluster metal abundances with those from previous studies that use other methods to determine metallicities such as Strömgren photometry and various spectroscopic methods. In this case, we find it disconcerting that there is no consensus on the most “reliable” set of [Fe/H] values for these old LMC globular clusters.
ACKNOWLEDGEMENTS
The author is grateful to the Bjorn Lamborn Endowment in Physics for support of this work.
DATA AVAILABILITY
All of the data used in this work are available in the published articles referenced herein.
